Top
HSRCNet-Zero Electricity Generation and Distribution Technologies & Markets – 2022-2030 – With Corona & COP26 Impacts
NEW

Net-Zero Electricity Generation and Distribution Technologies & Markets - 2022-2030 – With Corona & COP26 Impacts

Bottom-up Research of 326 Submarkets. 2026 Market $125 Billion

  • July 2022
  • 415
  • 386
    • 4950 $
    • 5950 $
    • 8950 $
    • 12000 $

    Small Businesses, Startups & Academia - Up to 50% Off

Quantity
IBM
Amazon
Sandia National Lab
HITACHI
Thales
Smiths Detection
Nuctech
Korea Internet & Security Agency
L3Harris
Huawei
Leidos
NEC
Toshiba
Deloitte
MAG

Want to customize this report?

If you purchase this report, you are entitled to a 30% discount towards customizing it, to better fit your market research and strategic needs. Our Custom Research and Industry Insights Department will work with you to better understand your information gaps and strategic needs and will provide you with a tailor-made market research report within a short period of time.

Why Choose Us?

30+ Years of Experience
We are a multidisciplinary team of Transformational Technologies industry experts with over 30 years of experience.
Gold Standard
With over 950 private sector clients (73% repeat customers), including major defense and security vendors, and Forbes Global 2000 companies, HSRC earned the reputation as the industry’s Gold Standard for Transformational Technologies Market Reports.
Tailored Research Services
Provide you with clear, actionable recommendations designed to empower decision making and to help you exploit emerging opportunities in the Transformational Technologies industries.
Information Security
Your personal information is safe and secure.

From: $4,950

Description

The Net-Zero Electricity Generation and Distribution Technologies & Markets – 2022-2030 – With Corona & COP26 Impacts report fills a void in the climate change related Electricity Generation and Distribution market information. It is the first comprehensive market report that addresses button-up hundreds of markets. The report thoroughly analyzes 21 technology, 5 regional, 5 revenue source and 60 national markets, detailing 326 submarkets. According to the report, the 2026 market size will reach $125 Billion.


 “Adaptation plays a key role in reducing exposure and vulnerability to climate change”

 IPCC Report (Feb. 28, 2022)


 Key market drivers are:

  • To win the war against climate change, we must cultivate and invest trillions in zero-emission Electricity Generation and Distribution infrastructures across the globe
  • Investors’ eagerness for financing the Net-Zero Electricity Generation and Distribution Industry
  • Availability of key Net-Zero Electricity Generation and Distribution technologies and their cost-performance improvement at a fast pace
  • Multi-trillion business opportunities
  • Unprecedented public support, which drives governments and the private sector to invest in the green revolution
  • Government subsidies and investments
  • Following Russia’s invasion of Ukraine, governments consider sweeping changes to planning laws and investments in Electricity Generation and Distribution to improve their energy security

This market report is the utmost comprehensive review of the climate change-related Electricity Generation and Distribution market available today.

Questions answered in this report include:

  • What will the 2022-2030 market size be?
  • How do COP26 & Corona affect the market?
  • Which submarkets provide attractive business opportunities?
  • What drives customers to invest?
  • What are the technologies trends?
  • What are the challenges to market penetration & growth?

Net-Zero Electricity Generation and Distribution Market Segmentation Vectors


What does the Net-Zero Electricity Generation and Distribution Technologies & Markets – 2022-2030 – With Corona & COP26 Impacts report give you?

A. The Net-Zero Electricity Generation and Distribution Technologies & Markets size data is analyzed via four independent perspectives.

1. By 21 Net-Zero Electricity Generation and Distribution Technologies:

  • Bioenergy
  • Compressed-Air Storage
  • Concentrating Solar Power (CSP)
  • Direct Geothermal Heating & Cooling
  • Direct Solar Water Heating
  • Geothermal Power Generation
  • Grid Modernization  
  • Grid-Scale Battery Storage
  • Hydroelectric Energy Storage
  • Hydroelectric Power
  • Marine Power
  • Nuclear Energy Plants > 1 GW
  • Offshore Wind Power
  • Onshore Wind Power
  • Other Energy Storage Modalities
  • Other Renewable Energy
  • Rooftop Solar P.V.
  • Small Nuclear Reactors
  • Solar P.V. (Utility Scale)
  • Thermal Energy Storage
  • Waste to Energy Plants

 2. By 5 Revenue Source Markets:

  • Infrastructure
  • Product Sales
  • Maintenance
  • Upgrades
  • Other

3. By 5 Regional Markets:

  1. North America
  2. Latin America
  3. Europe
  4. Middle East & Africa
  5. Asia Pacific

4. By 60 National Markets:

  • The U.S.
  • Canada
  • Argentina
  • Brazil
  • Chile
  • Colombia
  • Cuba
  • Ecuador
  • Mexico
  • Peru
  • Puerto Rico
  • Venezuela
  • Rest of Latin America
  • Austria
  • Belarus
  • Belgium
  • Bulgaria
  • Czech Republic
  • Denmark
  • Finland
  • France
  • Germany
  • Greece
  • Hungary
  • Italy
  • Netherlands
  • Norway
  • Poland
  • Portugal
  • Romania
  • Russia
  • Serbia
  • Slovakia
  • Spain
  • Sweden
  • Switzerland
  • UK
  • Ukraine
  • Rest of Europe
  • Algeria
  • Egypt
  • Iran
  • Israel
  • Kuwait
  • Saudi Arabia
  • South Africa
  • Turkey
  • UAE
  • Rest of MEA
  • Australia
  • China
  • India
  • Indonesia
  • Japan
  • Kazakhstan
  • Philippines
  • South Korea
  • Thailand
  • Vietnam
  • Rest of Asia-Pacific

B. Detailed market analysis frameworks are provided, including:

  • Market drivers & inhibitors
  • Business opportunities
  • SWOT analysis
  • Competitive analysis
  • Business environment
  • The 2020-2030 market
  • Industry Value Chain   
  • Financing & Loans       
  • Governmental R&D Funding    
  • Levelized Cost of Energy- 2020-2040


Why Buy:

Bottom-up Research. The report provides you with exhaustive bottom-up research of Net-Zero Electricity Generation and Distribution related markets

Unique Analysts Team. Our multilingual team brings 40 years of hands-on record in the industry, corporate positions of chairperson, CEO, CTO, chief scientist, VP R & R&D, VP marketing, $8 B of products commercialization. The team published 352 market reports.

Extensive Research.  The report research team conducted interviews with dozens of experts. It reviewed over 380 reports, documents and papers published by other experts (including, for example, DOE, IEA, IRENA, the UN, the White House, the EU, US Congress CRS, the UK, German, PRC, Indian and other government agencies, SEC filings, investors’ presentations and more).

Multi-Source Intelligence Verification. With a highly fragmented market, we addressed each dollar spent. The global warming mitigation market was analyzed and crosschecked via 4 orthogonal viewpoints: technologies and services, countries, revenue sources and regions.

COP26 Revision. To guarantee the accuracy of the data and market size forecasts, we revised the report by following and analyzing the Glasgow COP26 meetings deliberations and investment pledges.

Money Trail. The report is the only study of ‘when?’, ‘where?’, ‘why?’ and ‘how much?’ of the cumulative 2022-2030 $13.2 trillion go to market.

Report Excel. Once you buy the report, you can get for a nominal price its Excel version.

Customized for Decision-Makers. This report aims to provide today’s strategic decision-makers with an expert 360-degree, time-sensitive, detailed view of this interconnected market.


Companies mentioned in the report: 

  • Aalborg CSP
  • ABB
  • Abengoa Solar
  • Acciona Energy
  • ACWA Power
  • Advanced Cyclone Systems, S.A.
  • AEG Power Solutions
  • AES Energy Storage LLC
  • ALACAES
  • Alstom Power, Inc.
  • Andritz Hydro
  • Ansaldo Energia
  • Ansaldo Nucleare              
  • Apex CAES
  • Aquamarine Power
  • Areva
  • Atb Riva Calzoni
  • Atlantis Resources
  • Atomenergomash              .
  • Atommash          
  • AWS Ocean Energy
  • Azure Power
  • B Fouress
  • Babcock Power
  • Baltimore Aircoil Company
  • Bath County Pumped Storage
  • BDR Thermea
  • BHEL
  • BioPower Systems
  • Bornay
  • Bosch Thermotechnology
  • BrightSource Energy
  • BRUKS Siwertell
  • Burns & Mcdonnel
  • BYD
  • Calmac
  • Carnegie Wave Energy
  • Carrier
  • Castaic Power Plant
  • Central Electronics
  • Chaira Hydropower Cascade
  • Chemtrols Solar
  • China Guodian Corporation
  • CKD Blansko
  • Climate Change Technologies
  • Cobra
  • Compte.R. (France)
  • CRRC
  • DC Pro Engineering
  • Delta Electronics, Inc.
  • Detroit Stoker Company
  • Dinorwig Power
  • DN Tanks
  • Doosan
  • Elecon Engineering
  • Emmvee Solar Systems
  • Enercon
  • Energy Innovations (UK)
  • Enessere
  • Entracque Power
  • Envision Energy
  • eSolar
  • Euro Multivision
  • Evergreen Engineering
  • Flovel Energy Private Limited
  • Fuji Electric
  • Fuji Heavy Industries
  • Ganz EEPM
  • Garioni Naval (Italy)
  • GE Renewable Energy
  • General Compression
  • General Electric
  • Gilbert Gilkes
  • GlassPoint Solar
  • Global Hydro Energy
  • Goldwind
  • Gordon Ltd
  • Grand`Maison
  • Greenera Energy India Pvt
  • Guangdong Pumped Storage
  • GUGLER
  • Hangzhou Boiler (China)
  • Hanjin
  • HEITRONICS
  • Hitachi
  • Hi-VAWT
  • Huizhou Pumped Storage
  • Hurst Boiler & Welding Co. Inc.
  • Hydrostor Inc.
  • Hyosung
  • Hyundai Heavy Industries
  • Iberdrola
  • Ice Energy Technologies Inc.
  • IndoSolar
  • Ingula Pumped Storage Scheme
  • Inox Wind
  • Interra Global Corporation
  • Japan Steel Works
  • John King Chains USA
  • Johnson Controls.
  • Jupiter Solar Power
  • Justsen Energiteknik (Denmark)
  • Kohlbach Group (Austria)
  • Kolektor Turboinstitut
  • Končar
  • La Muela II Pumped Storage
  • LAMBION Energy Solutions (Germany)
  • Lanco Solar Private
  • LG Chem
  • Liyang Pumped Storage
  • Lointek
  • Ludington
  • Machine Sazi Arak
  • Magnum Development LLC
  • Mahindra Solar One
  • MAN SE
  • Mapna
  • Marine Current Turbines (MCT)
  • Mavel
  • Mingtan
  • Mitsubishi Electric
  • Mitsubishi Heavy Industries
  • Modine
  • Moltex Energy
  • Moser Baer Photovoltaic
  • NEC Corporation
  • NG Advantage
  • Nibe Industrier
  • Nordex SE
  • Novatec
  • NuScale Power
  • Ocean Power Technologies
  • Oceanlinx
  • OCHSNER Warmepumpen
  • OKB Gidropress 
  • OKBM Afrikantov              
  • OpenHydro
  • Ormat
  • ORPC
  • Pacific Gas and Electric Company
  • PacWind
  • Panasonic
  • Polytechnik (Austria)
  • Presa de Aldead


  • Primus Power
  • Primus windpower
  • ProcessBarron
  • Pulse Tidal
  • Qingyuan
  • quietrevolution
  • Raccoon Mountain
  • Rackam
  • Rioglass Solar
  • RRB Energy Limited
  • Samsung SDI
  • SANY
  • Sardar Sarovar
  • Schott
  • Seabased
  • SENER
  • Sener Group
  • Shams Power
  • Shanghai Electric
  • Shanghai Industrial Boiler (China)
  • Shin Takasegawa
  • Siemens
  • Sinovel
  • SNC-Lavalin
  • Solar Euromed
  • Solar Turbines, Inc.
  • Solarlite
  • SolarReserve
  • Soliterm Group
  • Sopogy Micro CSP
  • SoyutWind
  • Stiebel Eltron
  • Storelectric Ltd.
  • STX Windpower
  • Suzlon
  • TECO
  • Terrestial Energy
  • Tesla
  • Tesup
  • The AES Corporation
  • Thermal energy storage Vsetín
  • Tianhuangping
  • Torresol Energy
  • Torxx Kinetic Pulverizer
  • Toshiba
  • Trane
  • TrinaBESS
  • TUGE Energia
  • UNISON
  • United Heavy Machinery 
  • Urban Green Energy
  • Vaillant
  • Vattenfall
  • Verdant Power
  • Vergnet
  • Vestas
  • Viessmann
  • Voith GmbH
  • WEG
  • Wello Oy
  • Wellons (USA)
  • Western Power (China)
  • Westinghouse Electric
  • Wizard Power
  • Wolf Material Handling Systems
  • World Wind
  • Wuxi Huaguang Boiler (China)
  • Xant
  • Zhejiang Jinlun Electromechanic
  • Zhengzhou Boiler (China)


Table of Contents

Download TOC as PDF

Contents

1         The Report Key Assumptions…………………………………. 37

2         Executive Summary………………………………………………. 38

2.1        Key Findings…………………………………………………… 38

2.2        Key Conclusions………………………………………………. 51

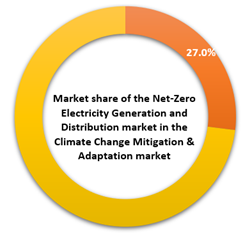
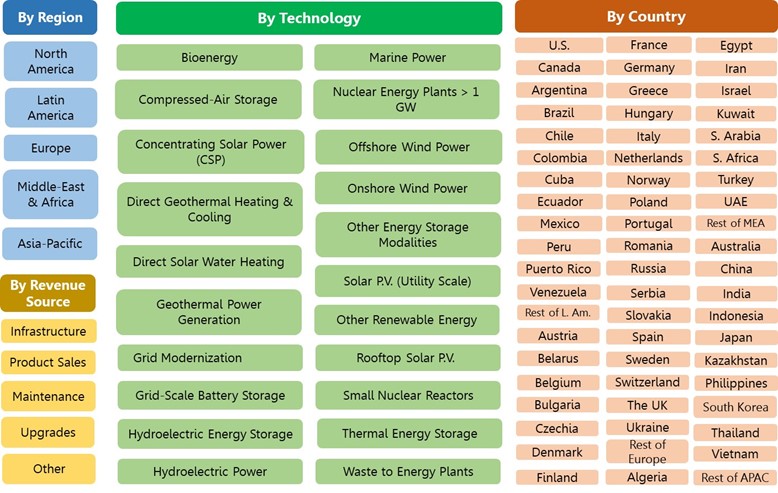
2.3        Global Net-Zero Electricity Generation and Distribution Market Segmentation Vectors……………………………… 61

2.4        Global Net-Zero Electricity Generation and Distribution Market – 2022-2030………………………………………….. 62

2.4.1            Global Market by Technology – 2022-2030………. 62

2.4.2            Global Market by Revenue Source – 2022-2030… 64

2.4.3            Global Market by Region – 2022-2030…………….. 64

2.4.4            Global Market by Country – 2022-2030……………. 66

3         COP26 & COVID-19 Implications……………………………… 67

3.1        COP26 Takeaway……………………………………………. 67

3.2        COVID-19 Implications………………………………………. 68

4         The Industry Value Chain……………………………………….. 70

5         Business Opportunities…………………………………………. 71

6         Market Drivers………………………………………………………. 82

7         Market Inhibitors…………………………………………………… 83

8         SWOT Analysis…………………………………………………….. 84

8.1        Strengths……………………………………………………….. 84

8.2        Weaknesses…………………………………………………… 85

8.3        Opportunities…………………………………………………… 86

8.4        Threats………………………………………………………….. 87

TECHNOLOGY, PRODUCT & SERVICE MARKETS…………….. 89

9         Global Net-Zero Electricity Generation and Distribution Technologies, Products & Services Markets – 2020-2030 89

9.1        Technology, Products & Services Markets Size………. 89

9.2        Technology Products & Services Markets Dynamics… 90

9.3        Technology Products & Services Markets Share……… 92

10      Bioenergy Market – 2022-2030………………………………… 94

10.1     CEO Takeaway……………………………………………….. 94

10.1.1          Summary………………………………………………….. 94

10.1.2          Bioenergy for Electricity Generation………………… 97

10.1.3          Bioenergy in Industry…………………………………… 97

10.1.4          Thermo-Chemical Process……………………………. 98

10.1.5          Bio-Chemical Process………………………………….. 99

10.1.6          Bioenergy Conversion Technologies……………… 100

10.1.7          Global Bioenergy Market…………………………….. 101

10.1.8          Global Bio-Heating Market………………………….. 101

10.1.9          Biomass Heating For Buildings…………………….. 102

10.1.10       Global Bio-Power Markets…………………………… 103

10.1.11       The Global Solid Biomass Industry……………….. 104

10.1.12       The Global Liquid Biofuels Industry……………….. 105

10.1.13       The Global Gaseous Biomass Industry………….. 105

10.1.14       Global Bioenergy CCS & CCU……………………… 105

10.1.15       Thermal Conversions…………………………………. 107

10.1.16       Chemical Conversion…………………………………. 107

10.1.17       Biochemical Conversion……………………………… 107

10.1.18       Electrochemical Conversions……………………….. 108

10.2     Key Vendors………………………………………………….. 108

10.3     Global Bioenergy Market – 2020-2030………………… 109

10.3.1          Bioenergy Market Size……………………………….. 109

10.3.2          Bioenergy Market Dynamics………………………… 109

10.3.3          Bioenergy Market Share……………………………… 109

11      Compressed-Air Storage Market – 2022-2030………….. 110

11.1     CEO Takeaway……………………………………………… 110

11.1.1          Summary………………………………………………… 110

11.1.2          Adiabatic Compressed-Air Energy Storage……… 112

11.1.3          Diabatic Compressed-Air Energy Storage………. 112

11.2     Key Vendors………………………………………………….. 113

11.3     Global Compressed-Air Storage Market – 2020-2030 113

11.3.1          Compressed-Air Storage Market Size……………. 113

11.3.2          Compressed-Air Storage Market Dynamics…….. 114

11.3.3          Compressed-Air Storage Market Share………….. 114

12      Concentrating Solar Power (CSP) Market – 2022-2030. 115

12.1     CEO Takeaway……………………………………………… 115

12.1.1          Summary………………………………………………… 115

12.1.2          CSP Projects……………………………………………. 117

12.1.3          CSP vs. Solar PV……………………………………… 118

12.2     CSP Key Vendors…………………………………………… 118

12.3     Global Concentrating Solar Power (CSP) Market – 2020-2030……………………………………………………………. 119

12.3.1          Concentrating Solar Power (CSP) Market Size… 119

12.3.2          Concentrating Solar Power (CSP) Market Dynamics……………………………………………………………… 120

12.3.3          Concentrating Solar Power (CSP) Market Share. 120

13      Direct Geothermal Heating & Cooling Market – 2022-2030 121

13.1     CEO Takeaway……………………………………………… 121

13.1.1          Summary………………………………………………… 121

13.1.2          Direct Geothermal Heating & Cooling Applications……………………………………………………………… 122

13.1.3          Geothermal Heat Pumps. Heating and Cooling… 122

13.1.4          Geothermal District Heating…………………………. 123

13.1.5          Geothermal Heating Pump Price Competitiveness……………………………………………………………… 124

13.2     Global Direct Geothermal Heating & Cooling Market – 2020-2030…………………………………………………….. 125

13.2.1          Direct Geothermal Heating & Cooling Market Size……………………………………………………………… 125

13.2.2          Direct Geothermal Heating & Cooling Market Dynamics………………………………………………… 126

13.2.3          Direct Geothermal Heating & Cooling Market Share……………………………………………………………… 126

14      Direct Solar Water Heating Market – 2022-2030………… 127

14.1     CEO Takeaway……………………………………………… 127

14.1.1          Summary………………………………………………… 127

14.2     Key Vendors………………………………………………….. 131

14.3     Global Direct Solar Water Heating Market – 2020-2030                                                                               131

14.3.1          Direct Solar Water Heating Market Size…………. 131

14.3.2          Direct Solar Water Heating Market Dynamics….. 132

14.3.3          Direct Solar Water Heating Market Share……….. 132

15      Geothermal Power Generation Market – 2022-2030…… 133

15.1     CEO Takeaway……………………………………………… 133

15.1.1          Summary………………………………………………… 133

15.1.2          Geothermal Electric Power Generation………….. 135

15.1.3          Geothermal Power Plants LCOE…………………… 136

15.1.4          Enhanced Geothermal Systems (EGS)………….. 136

15.1.5          The 2022-2030 Market Growth Drivers…………… 138

15.2     Key Vendors………………………………………………….. 139

15.3     Global Geothermal Power Generation Market – 2020-2030……………………………………………………………. 140

15.3.1          Geothermal Power Generation Market Size…….. 140

15.3.2          Geothermal Power Generation Market Dynamics 140

15.3.3          Geothermal Power Generation Market Share….. 141

16      Grid Modernization Market – 2022-2030………………….. 142

16.1     CEO Takeaway……………………………………………… 142

16.1.1          Summary………………………………………………… 142

16.1.2          Smart Grid………………………………………………. 144

16.1.3          Transmission Lines Modernization………………… 145

16.1.4          Demand Response……………………………………. 146

16.1.5          Hardening the Grid……………………………………. 146

16.1.6          Advanced Distribution Management Systems….. 147

16.1.7          Smart Inverters…………………………………………. 147

16.1.8          Smart Meters……………………………………………. 147

16.1.9          Microgrids……………………………………………….. 147

16.2     Global Grid Modernization Market – 2020-2030…….. 149

16.2.1          Grid Modernization Market Size……………………. 149

16.2.2          Grid Modernization Market Dynamics…………….. 150

16.2.3          Grid Modernization Market Share…………………. 150

17      Grid-Scale Battery Storage Market – 2022-2030……….. 151

17.1     CEO Takeaway……………………………………………… 151

17.1.1          Summary………………………………………………… 151

17.1.2          The U.S.  Energy Storage Market…………………. 154

17.1.3          Grid-Scale Battery Storage Benefits………………. 154

17.1.4          EVs and Energy Storage…………………………….. 155

17.2     Key Vendors………………………………………………….. 157

17.3     Global Grid-Scale Battery Storage Market – 2020-2030                                                                               157

17.3.1          Grid-Scale Battery Storage Market Size…………. 157

17.3.2          Grid-Scale Battery Storage Market Dynamics….. 158

17.3.3          Grid-Scale Battery Storage Market Share……….. 158

18      Hydroelectric Energy Storage Market – 2022-2030……. 159

18.1     CEO Takeaway……………………………………………… 159

18.1.1          Summary………………………………………………… 159

18.1.2          Facts & Figures………………………………………… 162

18.1.3          Pumped Hydroelectric Storage Technologies….. 162

18.1.4          Variable-Speed Pump-Storage Technology…….. 163

18.1.5          Key Vendors……………………………………………. 163

18.2     Global Hydroelectric Energy Storage Market – 2020-2030……………………………………………………………. 164

18.2.1          Hydroelectric Energy Storage Market Size……… 164

18.2.2          Hydroelectric Energy Storage Market Dynamics. 165

18.2.3          Hydroelectric Energy Storage Market Share……. 165

19      Hydroelectric Power Market – 2022-2030………………… 166

19.1     CEO Takeaway……………………………………………… 166

19.1.1          Summary………………………………………………… 166

19.1.2          Hydropower LCOE…………………………………….. 169

19.1.3          Hydropower Technology…………………………….. 169

19.1.4          Hydroelectric Power Project Construction Cost… 170

19.2     Key Vendors………………………………………………….. 171

19.3     Global Hydroelectric Power Market – 2020-2030…… 171

19.3.1          Hydroelectric Power Market Size………………….. 171

19.3.2          Hydroelectric Power Market Dynamics…………… 171

19.3.3          Hydroelectric Power Market Share………………… 172

20      Marine Power Systems Market – 2022-2030…………….. 173

20.1     CEO Takeaway……………………………………………… 173

20.1.1          Summary………………………………………………… 173

20.1.2          Marine Tidal Power technologies………………….. 174

20.1.3          Marine Current Power Generation………………… 175

20.1.4          Marine Osmotic Power Generation……………….. 175

20.1.5          Ocean Thermal Energy………………………………. 176

20.1.6          Marine Wave Power…………………………………… 176

20.2     Key Vendors………………………………………………….. 177

20.3     Global Marine Power Market – 2020-2030……………. 178

20.3.1          Marine Power Market Size………………………….. 178

20.3.2          Marine Power Market Dynamics…………………… 178

20.3.3          Marine Power Market Share………………………… 179

21      Nuclear Energy Plants (> 1 GW) Market – 2022-2030…. 180

21.1     CEO Takeaway……………………………………………… 180

21.1.1          Summary………………………………………………… 180

21.1.2          Facts and Figures……………………………………… 181

21.1.3          Installed Base of Power Reactors – 2021………… 182

21.2     Key Vendors………………………………………………….. 182

21.3     Global Nuclear Energy Plants > 1 GW Market – 2020-2030……………………………………………………………. 183

21.3.1          Nuclear Energy Plants > 1 GW Market Size……. 183

21.3.2          Nuclear Energy Plants > 1 GW Market Dynamics 183

21.3.3          Nuclear Energy Plants > 1 GW Market Share….. 184

22      Offshore Wind Power Market – 2022-2030……………….. 185

22.1     CEO Takeaway……………………………………………… 185

22.1.1          Summary………………………………………………… 185

22.1.2          Floating offshore wind power market……………… 190

22.1.3          The Proliferation of Offshore Wind Power Farms by Geography………………………………………………. 191

22.1.4          Operational Cost……………………………………….. 192

22.1.5          Cost trends……………………………………………… 192

22.2     Key Vendors………………………………………………….. 193

22.3     Global Offshore Wind Power Market – 2020-2030….. 193

22.3.1          Offshore Wind Power Market Size………………… 193

22.3.2          Offshore Wind Power Market Dynamics…………. 194

22.3.3          Offshore Wind Power Market Share………………. 194

23      Onshore Wind Power Market – 2022-2030……………….. 195

23.1     CEO Takeaway……………………………………………… 195

23.1.1          Summary………………………………………………… 195

23.1.2          Onshore Wind LCOE Outlook………………………. 197

23.1.3          Onshore Wind Power Disadvantages…………….. 197

23.1.4          Key Vendors……………………………………………. 197

23.2     Global Onshore Wind Power Market – 2020-2030….. 199

23.2.1          Onshore Wind Power Market Size………………… 199

23.2.2          Onshore Wind Power Market Dynamics…………. 199

23.2.3          Onshore Wind Power Market Share………………. 200

24      Other Energy Storage Modalities Market – 2022-2030.. 201

24.1     Global Other Energy Storage Modalities Market – 2020-2030……………………………………………………………. 201

24.1.1          Other Energy Storage Modalities Market Size….. 201

24.1.2          Other Energy Storage Modalities Market Dynamics……………………………………………………………… 201

24.1.3          Other Energy Storage Modalities Market Share.. 202

25      Other Renewable Energy Market – 2022-2030………….. 203

25.1     Global Other Renewable Energy Market – 2020-2030                                                                               203

25.1.1          Other Renewable Energy Market Size……………. 203

25.1.2          Other Renewable Energy Market Dynamics……. 203

25.1.3          Other Renewable Energy Market Share…………. 204

26      Rooftop Solar PV Market – 2022-2030…………………….. 205

26.1     CEO Takeaway……………………………………………… 205

26.1.1          Summary………………………………………………… 205

26.1.2          Solar Rooftop Technology…………………………… 206

26.1.3          Solar Rooftop System Economics……………….. 207

26.1.4          Adoption Of Rooftop PV……………………………. 207

26.2     Global Rooftop Solar PV Market – 2020-2030………. 207

26.2.1          Rooftop Solar PV Market Size……………………… 207

26.2.2          Rooftop Solar PV Market Dynamics………………. 208

26.2.3          Rooftop Solar PV Market Share……………………. 208

27      Small Nuclear Reactors Market – 2022-2030……………. 209

27.1     CEO Takeaway……………………………………………… 209

27.1.1          Summary………………………………………………… 209

27.1.2          Advantages of SMRs…………………………………. 210

27.1.3          SMR Challenges……………………………………….. 211

27.2     Key Vendors………………………………………………….. 211

27.3     Global Small Nuclear Reactors Market – 2020-2030. 212

27.3.1          Small Nuclear Reactors Market Size……………… 212

27.3.2          Small Nuclear Reactors Market Dynamics………. 212

27.3.3          Small Nuclear Reactors Market Share……………. 213

28      Solar PV (Utility Scale) Market – 2022-2030……………… 214

28.1     CEO Takeaway……………………………………………… 214

28.1.1          Summary………………………………………………… 214

28.1.2          Market Outlook…………………………………………. 218

28.2     Key Vendors………………………………………………….. 219

28.3     Global Solar PV (Utility Scale) Market – 2020-2030… 220

28.3.1          Solar PV (Utility Scale) Market Size………………. 220

28.3.2          Solar PV (Utility Scale) Market Dynamics……….. 221

28.3.3          Solar PV (Utility Scale) Market Share…………….. 221

29      Thermal Energy Storage Market – 2022-2030…………… 222

29.1     CEO Takeaway……………………………………………… 222

29.1.1          Summary………………………………………………… 222

29.1.2          Thermal Energy Storage  Advantages……………. 225

29.1.3          Molten Salt Storage Technology…………………… 226

29.1.4          Key Vendors……………………………………………. 226

29.2     Global Thermal Energy Storage Market – 2020-2030 227

29.2.1          Thermal Energy Storage Market Size…………….. 227

29.2.2          Thermal Energy Storage Market Dynamics…….. 227

29.2.3          Thermal Energy Storage Market Share………….. 228

30      Waste to Energy Plants Market – 2022-2030…………….. 229

30.1     CEO Takeaway……………………………………………… 229

30.1.1          Summary………………………………………………… 229

30.1.2          Facts & Figures………………………………………… 230

30.1.3          Waste to Energy Economy………………………….. 231

30.2     Global Waste to Energy Plants Market – 2020-2030. 232

30.2.1          Waste to Energy Plants Market Size……………… 232

30.2.2          Waste to Energy Plants Market Dynamics………. 232

30.2.3          Waste to Energy Plants Market Share……………. 233

REVENUE SOURCE MARKETS…………………………………….. 234

31      Net-Zero Electricity Generation and Distribution Market by Revenue Source – 2020-2030……………………………. 234

31.1     Global Market – 2020-2030………………………………. 234

31.2     Net-Zero Electricity Generation and Distribution Market Dynamics – 2020-2030……………………………………. 235

31.3     Net-Zero Electricity Generation and Distribution Market Share – 2020-2030…………………………………………. 236

REGIONAL MARKETS…………………………………………………. 237

32      Regional Net-Zero Electricity Generation and Distribution Markets – 2020-2030…………………………………………….. 237

32.1     Regional Markets – 2020-2030………………………….. 237

33      North America Net-Zero Electricity Generation and Distribution Market………………………………………………. 238

33.1     North America Market CEO Takeaway………………… 238

33.2     North America Market – 2020-2030…………………….. 240

33.2.1          Market by Sector………………………………………. 240

33.2.2          Market by Revenue Source…………………………. 242

33.3     North America Net-Zero Electricity Generation and Distribution Market Dynamics – 2020-2030…………… 243

33.4     North America Market Share – 2020-2030……………. 243

34      Latin America Net-Zero Electricity Generation and Distribution Market………………………………………………. 244

34.1     Latin America Market CEO Takeaway…………………. 244

34.2     Latin America Market – 2020-2030…………………….. 246

34.2.1          Market by Sector………………………………………. 246

34.2.2          Market by Revenue Source…………………………. 248

34.3     Latin America Net-Zero Electricity Generation and Distribution Market Dynamics – 2020-2030…………… 249

34.4     Latin America Market Share – 2020-2030…………….. 249

35      Europe Net-Zero Electricity Generation and Distribution Market……………………………………………………………….. 250

35.1     Europe Market CEO Takeaway………………………….. 250

35.2     Europe Market – 2020-2030……………………………… 252

35.2.1          Market by Sector………………………………………. 252

35.2.2          Market by Revenue Source…………………………. 254

35.3     Europe Net-Zero Electricity Generation and Distribution Market Dynamics – 2020-2030………………………….. 255

35.4     Europe Market Share – 2020-2030…………………….. 255

36      Middle East & Africa Net-Zero Electricity Generation and Distribution Market………………………………………………. 256

36.1     Africa Market CEO Takeaway……………………………. 256

36.2     The Middle East Market CEO Takeaway……………… 257

36.3     Middle East & Africa Market – 2020-2030…………….. 258

36.3.1          Market by Sector………………………………………. 258

36.3.2          Market by Revenue Source…………………………. 260

36.4     Middle East & Africa Net-Zero Electricity Generation and Distribution Market Dynamics – 2020-2030…………… 261

36.5     Middle East & Africa Market Share – 2020-2030……. 261

37      Asia Pacific Net-Zero Electricity Generation and Distribution Market………………………………………………. 262

37.1     Asia Pacific Market CEO Takeaway……………………. 262

37.2     Asia Pacific Market – 2020-2030………………………… 265

37.2.1          Market by Sector………………………………………. 265

37.2.2          Market by Revenue Source…………………………. 267

37.3     Asia Pacific Net-Zero Electricity Generation and Distribution Market Dynamics – 2020-2030…………… 268

37.4     Asia Pacific Market Share – 2020-2030……………….. 268

NATIONAL MARKETS…………………………………………………. 269

38      Net-Zero Electricity Generation and Distribution Market by Country – 2020-2030………………………………………… 269

38.1     Energy Consumption Indicatiors………………………… 269

38.2     National Markets Size – 2020-2030…………………….. 273

38.3     National Markets Dynamics – 2020-2030…………….. 274

38.4     National Markets Shares – 2020-2030………………… 276

38.5     National Markets by Revenue Source – 2020-2030… 279

38.5.1          Infrastructure Markets………………………………… 279

38.5.2          Product Sales…………………………………………… 281

38.5.3          Maintenance Markets…………………………………. 282

38.5.4          Upgrades Markets…………………………………….. 284

38.5.5          Other* Revenue Sources……………………………. 286

North America……………………………………………………………. 288

39      U.S. Net-Zero Electricity Generation and Distribution Market – 2020-2030………………………………………………. 288

39.1     U.S. Market CEO Takeaway……………………………… 288

39.1.1          Key Facts………………………………………………… 288

39.1.2          National Policy………………………………………….. 289

39.1.3          Energy Supply………………………………………….. 289

39.1.4          Energy Consumption…………………………………. 289

39.1.5          Electricity………………………………………………… 290

39.2     U.S. Net-Zero Electricity Generation and Distribution Market – 2020-2030………………………………………… 291

39.3     U.S. Market Dynamics – 2020-2030……………………. 291

39.4     U.S. Market Share – 2020-2030…………………………. 291

40      Canada Net-Zero Electricity Generation and Distribution Market – 2020-2030………………………………………………. 292

40.1     Canada Market CEO Takeaway…………………………. 292

40.1.1          Key Facts………………………………………………… 292

40.1.2          National Policy………………………………………….. 292

40.1.3          Energy Supply………………………………………….. 293

40.1.4          Energy Consumption…………………………………. 293

40.1.5          Electricity………………………………………………… 294

40.2     Canada Net-Zero Electricity Generation and Distribution Market – 2020-2030………………………………………… 294

40.3     Canada Market Dynamics – 2020-2030……………….. 294

40.4     Canada Market Share – 2020-2030……………………. 294

Latin America…………………………………………………………….. 296

41      Argentina Net-Zero Electricity Generation and Distribution Market – 2020-2030…………………………….. 296

41.1     Argentina Market CEO Takeaway………………………. 296

41.1.1          Key Facts………………………………………………… 296

41.1.2          National Policy………………………………………….. 296

41.1.3          Energy Consumption…………………………………. 297

41.1.4          Electricity………………………………………………… 298

41.2     Argentina Net-Zero Electricity Generation and Distribution Market – 2020-2030………………………… 298

41.3     Argentina Market Dynamics – 2020-2030…………….. 299

41.4     Argentina Market Share – 2020-2030………………….. 299

42      Brazil Net-Zero Electricity Generation and Distribution Market – 2020-2030………………………………………………. 299

42.1     Brazil Market CEO Takeaway……………………………. 299

42.1.1          Key Facts………………………………………………… 299

42.1.2          National Policy………………………………………….. 299

42.1.3          Energy Supply………………………………………….. 301

42.1.4          Energy Consumption…………………………………. 301

42.1.5          Electricity………………………………………………… 301

42.2     Brazil Net-Zero Electricity Generation and Distribution Market – 2020-2030………………………………………… 303

42.3     Brazil Market Dynamics – 2020-2030………………….. 303

42.4     Brazil Market Share – 2020-2030……………………….. 303

43      Chile Net-Zero Electricity Generation and Distribution Market – 2020-2030………………………………………………. 304

43.1     Chile Market CEO Takeaway…………………………….. 304

43.1.1          Key Facts………………………………………………… 304

43.1.2          National Policy………………………………………….. 304

43.1.3          Energy Supply………………………………………….. 305

43.2     Chile Net-Zero Electricity Generation and Distribution Market – 2020-2030………………………………………… 305

43.3     Chile Market Dynamics – 2020-2030…………………… 305

43.4     Chile Market Share – 2020-2030……………………….. 305

44      Colombia Net-Zero Electricity Generation and Distribution Market – 2020-2030…………………………….. 307

44.1     Colombia Market CEO Takeaway………………………. 307

44.1.1          Key Facts………………………………………………… 307

44.1.2          National Policy………………………………………….. 307

44.1.3          Energy Consumption…………………………………. 307

44.1.4          Electricity………………………………………………… 308

44.2     Colombia Net-Zero Electricity Generation and Distribution Market – 2020-2030………………………… 308

44.3     Colombia Market Dynamics – 2020-2030…………….. 309

44.4     Colombia Market Share – 2020-2030………………….. 309

45      Cuba Net-Zero Electricity Generation and Distribution Market – 2020-2030………………………………………………. 310

45.1     Cuba Market CEO Takeaway……………………………. 310

45.2     Cuba Net-Zero Electricity Generation and Distribution Market – 2020-2030………………………………………… 311

45.3     Cuba Market Dynamics – 2020-2030………………….. 311

45.4     Cuba Market Share – 2020-2030……………………….. 311

46      Ecuador Net-Zero Electricity Generation and Distribution Market – 2020-2030………………………………………………. 312

46.1     Ecuador Market CEO Takeaway………………………… 312

46.2     Ecuador Net-Zero Electricity Generation and Distribution Market – 2020-2030………………………………………… 312

46.3     Ecuador Market Dynamics – 2020-2030………………. 312

46.4     Ecuador Market Share – 2020-2030……………………. 313

47      Mexico Net-Zero Electricity Generation and Distribution Market – 2020-2030………………………………………………. 314

47.1     Mexico Market CEO Takeaway………………………….. 314

47.1.1          Key Facts………………………………………………… 314

47.1.2          National Policy………………………………………….. 314

47.1.3          Electricity………………………………………………… 316

47.2     Mexico Net-Zero Electricity Generation and Distribution Market – 2020-2030………………………………………… 316

47.3     Mexico Market Dynamics – 2020-2030………………… 316

47.4     Mexico Market Share – 2020-2030…………………….. 316

48      Peru Net-Zero Electricity Generation and Distribution Market – 2020-2030………………………………………………. 318

48.1     Peru Market CEO Takeaway…………………………….. 318

48.2     Peru Net-Zero Electricity Generation and Distribution Market – 2020-2030………………………………………… 319

48.3     Peru Market Dynamics – 2020-2030…………………… 319

48.4     Peru Market Share – 2020-2030………………………… 319

49      Puerto Rico Net-Zero Electricity Generation and Distribution Market – 2020-2030…………………………….. 320

49.1     Puerto Rico Market CEO Takeaway……………………. 320

49.2     Puerto Rico Net-Zero Electricity Generation and Distribution Market – 2020-2030………………………… 321

49.3     Puerto Rico Market Dynamics – 2020-2030………….. 321

49.4     Puerto Rico Market Share – 2020-2030……………….. 321

50      Venezuela Net-Zero Electricity Generation and Distribution Market – 2020-2030…………………………….. 322

50.1     Venezuela Market CEO Takeaway……………………… 322

50.2     Venezuela Net-Zero Electricity Generation and Distribution Market – 2020-2030………………………… 323

50.3     Venezuela Market Dynamics – 2020-2030……………. 323

50.4     Venezuela Market Share – 2020-2030………………… 323

51      Rest of Latin America Net-Zero Electricity Generation and Distribution Market – 2020-2030…………………………….. 324

51.1     Rest of Latin America Net-Zero Electricity Generation and Distribution Market – 2020-2030…………………… 324

51.2     Rest of Latin America Market Dynamics – 2020-2030 324

51.3     Rest of Latin America Market Share – 2020-2030….. 324

Europe……………………………………………………………………… 325

52      Austria Net-Zero Electricity Generation and Distribution Market – 2020-2030………………………………………………. 325

52.1     Austria Market CEO Takeaway………………………….. 325

52.2     Austria Net-Zero Electricity Generation and Distribution Market – 2020-2030………………………………………… 326

52.3     Austria Market Dynamics – 2020-2030………………… 326

52.4     Austria Market Share – 2020-2030……………………… 326

53      Belarus Net-Zero Electricity Generation and Distribution Market – 2020-2030………………………………………………. 327

53.1     Belarus Market CEO Takeaway…………………………. 327

53.2     Belarus Net-Zero Electricity Generation and Distribution Market – 2020-2030………………………………………… 328

53.3     Belarus Market Dynamics – 2020-2030……………….. 328

53.4     Belarus Market Share – 2020-2030…………………….. 329

54      Belgium Net-Zero Electricity Generation and Distribution Market – 2020-2030………………………………………………. 329

54.1     Belgium Market CEO Takeaway………………………… 329

54.2     Belgium Net-Zero Electricity Generation and Distribution Market – 2020-2030………………………………………… 330

54.3     Belgium Market Dynamics – 2020-2030………………. 331

54.4     Belgium Market Share – 2020-2030……………………. 331

55      Bulgaria Net-Zero Electricity Generation and Distribution Market – 2020-2030………………………………………………. 331

55.1     Bulgaria Market CEO Takeaway………………………… 331

55.2     Bulgaria Net-Zero Electricity Generation and Distribution Market – 2020-2030………………………………………… 333

55.3     Bulgaria Market Dynamics – 2020-2030………………. 334

55.4     Bulgaria Market Share – 2020-2030……………………. 334

56      Czech Republic Net-Zero Electricity Generation and Distribution Market – 2020-2030…………………………….. 335

56.1     Czech Republic Market CEO Takeaway………………. 335

56.2     Czech Republic Net-Zero Electricity Generation and Distribution Market – 2020-2030………………………… 336

56.3     Czech Republic Market Dynamics – 2020-2030…….. 336

56.4     Czech Republic Market Share – 2020-2030………….. 337

57      Denmark Net-Zero Electricity Generation and Distribution Market – 2020-2030………………………………………………. 337

57.1     Denmark Market CEO Takeaway……………………….. 337

57.2     Denmark Net-Zero Electricity Generation and Distribution Market – 2020-2030………………………… 339

57.3     Denmark Market Dynamics – 2020-2030……………… 340

57.4     Denmark Market Share – 2020-2030………………….. 340

58      Finland Net-Zero Electricity Generation and Distribution Market – 2020-2030………………………………………………. 341

58.1     Finland Market CEO Takeaway…………………………. 341

58.2     Finland Net-Zero Electricity Generation and Distribution Market – 2020-2030………………………………………… 342

58.3     Finland Market Dynamics – 2020-2030……………….. 342

58.4     Finland Market Share – 2020-2030…………………….. 343

59      France Net-Zero Electricity Generation and Distribution Market – 2020-2030………………………………………………. 343

59.1     France Market CEO Takeaway………………………….. 343

59.2     France Net-Zero Electricity Generation and Distribution Market – 2020-2030………………………………………… 345

59.3     France Market Dynamics – 2020-2030………………… 345

59.4     France Market Share – 2020-2030……………………… 345

60      Germany Net-Zero Electricity Generation and Distribution Market – 2020-2030………………………………………………. 347

60.1     Germany Net-Zero Electricity Generation and Distribution Market – 2020-2030………………………… 351

60.2     Germany Market Dynamics – 2020-2030……………… 351

60.3     Germany Market Share – 2020-2030………………….. 351

61      Greece Net-Zero Electricity Generation and Distribution Market – 2020-2030………………………………………………. 353

61.1     Greece Market CEO Takeaway…………………………. 353

61.2     Greece Net-Zero Electricity Generation and Distribution Market – 2020-2030………………………………………… 354

61.3     Greece Market Dynamics – 2020-2030……………….. 354

61.4     Greece Market Share – 2020-2030…………………….. 354

62      Hungary Net-Zero Electricity Generation and Distribution Market – 2020-2030………………………………………………. 355

62.1     Hungary Market CEO Takeaway………………………… 355

62.2     Hungary Net-Zero Electricity Generation and Distribution Market – 2020-2030………………………………………… 356

62.3     Hungary Market Dynamics – 2020-2030………………. 356

62.4     Hungary Market Share – 2020-2030…………………… 357

63      Italy Net-Zero Electricity Generation and Distribution Market – 2020-2030………………………………………………. 357

63.1     Italy Market CEO Takeaway……………………………… 357

63.2     Italy Net-Zero Electricity Generation and Distribution Market – 2020-2030………………………………………… 360

63.3     Italy Market Dynamics – 2020-2030……………………. 360

63.4     Italy Market Share – 2020-2030…………………………. 360

64      Netherlands Net-Zero Electricity Generation and Distribution Market – 2020-2030…………………………….. 361

64.1     Netherlands Market CEO Takeaway…………………… 361

64.2     Netherlands Net-Zero Electricity Generation and Distribution Market – 2020-2030………………………… 362

64.3     Netherlands Market Dynamics – 2020-2030…………. 362

64.4     Netherlands Market Share – 2020-2030………………. 363

65      Norway Net-Zero Electricity Generation and Distribution Market – 2020-2030………………………………………………. 364

65.1     Norway Market CEO Takeaway…………………………. 364

65.2     Norway Net-Zero Electricity Generation and Distribution Market – 2020-2030………………………………………… 365

65.3     Norway Market Dynamics – 2020-2030……………….. 365

65.4     Norway Market Share – 2020-2030…………………….. 366

66      Poland Net-Zero Electricity Generation and Distribution Market – 2020-2030………………………………………………. 366

66.1     Poland Market CEO Takeaway………………………….. 366

66.2     Poland Net-Zero Electricity Generation and Distribution Market – 2020-2030………………………………………… 368

66.3     Poland Market Dynamics – 2020-2030………………… 368

66.4     Poland Market Share – 2020-2030……………………… 368

67      Portugal Net-Zero Electricity Generation and Distribution Market – 2020-2030………………………………………………. 369

67.1     Portugal Market CEO Takeaway………………………… 369

67.2     Portugal Net-Zero Electricity Generation and Distribution Market – 2020-2030………………………………………… 370

67.3     Portugal Market Dynamics – 2020-2030………………. 370

67.4     Portugal Market Share – 2020-2030……………………. 370

68      Romania Net-Zero Electricity Generation and Distribution Market – 2020-2030………………………………………………. 372

68.1     Romania Market CEO Takeaway……………………….. 372

68.2     Romania Net-Zero Electricity Generation and Distribution Market – 2020-2030………………………… 373

68.3     Romania Market Dynamics – 2020-2030……………… 373

68.4     Romania Market Share – 2020-2030…………………… 373

69      Russia Net-Zero Electricity Generation and Distribution Market – 2020-2030………………………………………………. 375

69.1     Russia Market CEO Takeaway………………………….. 375

69.2     Russia Net-Zero Electricity Generation and Distribution Market – 2020-2030………………………………………… 377

69.3     Russia Market Dynamics – 2020-2030………………… 377

69.4     Russia Market Share – 2020-2030……………………… 377

70      Serbia Net-Zero Electricity Generation and Distribution Market – 2020-2030………………………………………………. 379

70.1     Serbia Market CEO Takeaway…………………………… 379

70.2     Serbia Net-Zero Electricity Generation and Distribution Market – 2020-2030………………………………………… 380

70.3     Serbia Market Dynamics – 2020-2030…………………. 380

70.4     Serbia Market Share – 2020-2030……………………… 380

71      Slovakia Net-Zero Electricity Generation and Distribution Market – 2020-2030………………………………………………. 381

71.1     Slovakia Market CEO Takeaway………………………… 381

71.2     Slovakia Net-Zero Electricity Generation and Distribution Market – 2020-2030………………………………………… 382

71.3     Slovakia Market Dynamics – 2020-2030………………. 382

71.4     Slovakia Market Share – 2020-2030…………………… 382

72      Spain Net-Zero Electricity Generation and Distribution Market – 2020-2030………………………………………………. 383

72.1     Spain Market CEO Takeaway……………………………. 383

72.2     Spain Net-Zero Electricity Generation and Distribution Market – 2020-2030………………………………………… 385

72.3     Spain Market Dynamics – 2020-2030………………….. 385

72.4     Spain Market Share – 2020-2030………………………. 385

73      Sweden Net-Zero Electricity Generation and Distribution Market – 2020-2030………………………………………………. 386

73.1     Sweden Market CEO Takeaway………………………… 386

73.2     Sweden Net-Zero Electricity Generation and Distribution Market – 2020-2030………………………………………… 388

73.3     Sweden Market Dynamics – 2020-2030………………. 388

73.4     Sweden Market Share – 2020-2030……………………. 388

74      Switzerland Net-Zero Electricity Generation and Distribution Market – 2020-2030…………………………….. 390

74.1     Switzerland Market CEO Takeaway……………………. 390

74.2     Switzerland Net-Zero Electricity Generation and Distribution Market – 2020-2030………………………… 391

74.3     Switzerland Market Dynamics – 2020-2030………….. 391

74.4     Switzerland Market Share – 2020-2030……………….. 391

75      UK Net-Zero Electricity Generation and Distribution Market – 2020-2030………………………………………………. 392

75.1     UK Market CEO Takeaway……………………………….. 392

75.2     UK Net-Zero Electricity Generation and Distribution Market – 2020-2030………………………………………… 394

75.3     UK Market Dynamics – 2020-2030……………………… 394

75.4     UK Market Share – 2020-2030………………………….. 395

76      Ukraine Net-Zero Electricity Generation and Distribution Market – 2020-2030………………………………………………. 396

76.1     Ukraine Market CEO Takeaway…………………………. 396

76.2     Ukraine Net-Zero Electricity Generation and Distribution Market – 2020-2030………………………………………… 397

76.3     Ukraine Market Dynamics – 2020-2030……………….. 397

76.4     Ukraine Market Share – 2020-2030…………………….. 397

77      Rest of Europe Net-Zero Electricity Generation and Distribution Market – 2020-2030…………………………….. 399

77.1     Rest of Europe Net-Zero Electricity Generation and Distribution Market – 2020-2030………………………… 399

77.2     Rest of Europe Market Dynamics – 2020-2030……… 399

77.3     Rest of Europe Market Share – 2020-2030…………… 399

Middle East & Africa……………………………………………………. 400

78      Algeria Net-Zero Electricity Generation and Distribution Market – 2020-2030………………………………………………. 400

78.1     Algeria Market CEO Takeaway………………………….. 400

78.2     Algeria Net-Zero Electricity Generation and Distribution Market – 2020-2030………………………………………… 400

78.3     Algeria Market Dynamics – 2020-2030………………… 401

78.4     Algeria Market Share – 2020-2030……………………… 401

79      Egypt Net-Zero Electricity Generation and Distribution Market – 2020-2030………………………………………………. 402

79.1     Egypt Market CEO Takeaway……………………………. 402

79.2     Egypt Net-Zero Electricity Generation and Distribution Market – 2020-2030………………………………………… 403

79.3     Egypt Market Dynamics – 2020-2030………………….. 403

79.4     Egypt Market Share – 2020-2030………………………. 403

80      Iran Net-Zero Electricity Generation and Distribution Market – 2020-2030………………………………………………. 405

80.1     Iran Market CEO Takeaway………………………………. 405

80.2     Iran Net-Zero Electricity Generation and Distribution Market – 2020-2030………………………………………… 406

80.3     Iran Market Dynamics – 2020-2030…………………….. 406

80.4     Iran Market Share – 2020-2030…………………………. 406

81      Israel Net-Zero Electricity Generation and Distribution Market – 2020-2030………………………………………………. 408

81.1     Israel Market CEO Takeaway……………………………. 408

81.2     Israel Net-Zero Electricity Generation and Distribution Market – 2020-2030………………………………………… 410

81.3     Israel Market Dynamics – 2020-2030………………….. 410

81.4     Israel Market Share – 2020-2030……………………….. 410

82      Kuwait Net-Zero Electricity Generation and Distribution Market – 2020-2030………………………………………………. 411

82.1     Kuwait Market CEO Takeaway………………………….. 411

82.2     Kuwait Net-Zero Electricity Generation and Distribution Market – 2020-2030………………………………………… 412

82.3     Kuwait Market Dynamics – 2020-2030………………… 412

82.4     Kuwait Market Share – 2020-2030……………………… 412

83      Saudi Arabia Net-Zero Electricity Generation and Distribution Market – 2020-2030…………………………….. 413

83.1     Saudi Arabia Net-Zero Electricity Generation and Distribution Market – 2020-2030………………………… 414

83.2     Saudi Arabia Market Dynamics – 2020-2030………… 414

83.3     Saudi Arabia Market Share – 2020-2030……………… 414

84      South Africa Net-Zero Electricity Generation and Distribution Market – 2020-2030…………………………….. 416

84.1     South Africa Market CEO Takeaway…………………… 416

84.2     South Africa Net-Zero Electricity Generation and Distribution Market – 2020-2030………………………… 417

84.3     South Africa Market Dynamics – 2020-2030…………. 417

84.4     South Africa Market Share – 2020-2030………………. 417

85      Turkey Net-Zero Electricity Generation and Distribution Market – 2020-2030………………………………………………. 419

85.1     Turkey Market CEO Takeaway………………………….. 419

85.2     Turkey Net-Zero Electricity Generation and Distribution Market – 2020-2030………………………………………… 421

85.3     Turkey Market Dynamics – 2020-2030………………… 421

85.4     Turkey Market Share – 2020-2030……………………… 421

86      UAE Net-Zero Electricity Generation and Distribution Market – 2020-2030………………………………………………. 422

86.1     UAE Market CEO Takeaway…………………………….. 422

86.2     UAE Net-Zero Electricity Generation and Distribution Market – 2020-2030………………………………………… 423

86.3     UAE Market Dynamics – 2020-2030…………………… 423

86.4     UAE Market Share – 2020-2030………………………… 423

87      Rest of MEA Net-Zero Electricity Generation and Distribution Market – 2020-2030…………………………….. 424

87.1     Rest of MEA Net-Zero Electricity Generation and Distribution Market – 2020-2030………………………… 424

87.2     Rest of MEA Market Dynamics – 2020-2030…………. 424

87.3     Rest of MEA Market Share – 2020-2030……………… 424

88      Australia Net-Zero Electricity Generation and Distribution Market – 2020-2030………………………………………………. 426

88.1     Australia Market CEO Takeaway……………………….. 426

88.2     Australia Net-Zero Electricity Generation and Distribution Market – 2020-2030………………………………………… 427

88.3     Australia Market Dynamics – 2020-2030……………… 427

88.4     Australia Market Share – 2020-2030…………………… 427

89      China Net-Zero Electricity Generation and Distribution Market – 2020-2030………………………………………………. 428

89.1     China Market CEO Takeaway……………………………. 428

89.2     China Net-Zero Electricity Generation and Distribution Market – 2020-2030………………………………………… 429

89.3     China Market Dynamics – 2020-2030………………….. 429

89.4     China Market Share – 2020-2030………………………. 429

90      India Net-Zero Electricity Generation and Distribution Market – 2020-2030………………………………………………. 430

90.1     India Market CEO Takeaway…………………………….. 430

90.2     India Net-Zero Electricity Generation and Distribution Market – 2020-2030………………………………………… 431

90.3     India Market Dynamics – 2020-2030…………………… 431

90.4     India Market Share – 2020-2030………………………… 431

91      Indonesia Net-Zero Electricity Generation and Distribution Market – 2020-2030…………………………….. 432

91.1     Indonesia Market CEO Takeaway………………………. 432

91.2     Indonesia Net-Zero Electricity Generation and Distribution Market – 2020-2030………………………… 433

91.3     Indonesia Market Dynamics – 2020-2030…………….. 433

91.4     Indonesia Market Share – 2020-2030………………….. 433

92      Japan Net-Zero Electricity Generation and Distribution Market – 2020-2030………………………………………………. 434

92.1     Japan Market CEO Takeaway…………………………… 434

92.2     Japan Net-Zero Electricity Generation and Distribution Market – 2020-2030………………………………………… 435

92.3     Japan Market Dynamics – 2020-2030…………………. 435

92.4     Japan Market Share – 2020-2030………………………. 435

93      Kazakhstan Net-Zero Electricity Generation and Distribution Market – 2020-2030…………………………….. 436

93.1     Kazakhstan Market CEO Takeaway……………………. 436

93.2     Kazakhstan Net-Zero Electricity Generation and Distribution Market – 2020-2030………………………… 437

93.3     Kazakhstan Market Dynamics – 2020-2030………….. 437

93.4     Kazakhstan Market Share – 2020-2030……………….. 437

94      Philippines Net-Zero Electricity Generation and Distribution Market – 2020-2030…………………………….. 438

94.1     Philippines Market CEO Takeaway…………………….. 438

94.2     Philippines Net-Zero Electricity Generation and Distribution Market – 2020-2030………………………… 439

94.3     Philippines Market Dynamics – 2020-2030…………… 439

94.4     Philippines Market Share – 2020-2030………………… 439

95      South Korea Net-Zero Electricity Generation and Distribution Market – 2020-2030…………………………….. 440

95.1     South Korea Market CEO Takeaway…………………… 440

95.2     South Korea Net-Zero Electricity Generation and Distribution Market – 2020-2030………………………… 441

95.3     South Korea Market Dynamics – 2020-2030…………. 441

95.4     South Korea Market Share – 2020-2030……………… 441

96      Thailand Net-Zero Electricity Generation and Distribution Market – 2020-2030………………………………………………. 442

96.1     Thailand Market CEO Takeaway……………………….. 442

96.2     Thailand Net-Zero Electricity Generation and Distribution Market – 2020-2030………………………………………… 443

96.3     Thailand Market Dynamics – 2020-2030……………… 443

96.4     Thailand Market Share – 2020-2030…………………… 443

97      Vietnam Net-Zero Electricity Generation and Distribution Market – 2020-2030………………………………………………. 444

97.1     Vietnam Market CEO Takeaway………………………… 444

97.2     Vietnam Net-Zero Electricity Generation and Distribution Market – 2020-2030………………………………………… 445

97.3     Vietnam Market Dynamics – 2020-2030………………. 445

97.4     Vietnam Market Share – 2020-2030……………………. 445

98      Rest of Asia-Pacific Net-Zero Electricity Generation and Distribution Market – 2020-2030…………………………….. 446

98.1     Rest of Asia-Pacific Net-Zero Electricity Generation and Distribution Market – 2020-2030………………………… 446

98.2     Rest of Asia-Pacific Market Dynamics – 2020-2030.. 446

98.3     Rest of Asia-Pacific Market Share – 2020-2030…….. 446

VENDORS…………………………………………………………………. 447

99      Company 1…………………………………………………………. 447

100    Company 2…………………………………………………………. 447

101    Company 3…………………………………………………………. 448

102    Company 4…………………………………………………………. 448

103    Company 5…………………………………………………………. 449

104    Company 6…………………………………………………………. 449

105    Company 7…………………………………………………………. 450

106    Company 8…………………………………………………………. 450

107    Company 9…………………………………………………………. 451

108    Company 10……………………………………………………….. 451

109    Company 11……………………………………………………….. 452

110    Company 12……………………………………………………….. 452

APPENDICES…………………………………………………………….. 453

111    Appendix A: Glossary………………………………………….. 453

112    Appendix B: Abbreviations…………………………………… 471

113    Research Methodology………………………………………… 476

113.1  Report Structure…………………………………………….. 476

113.2  Methodology………………………………………………….. 476

113.3  For Whom is this Report?…………………………………. 477

114    Disclaimer and Copyright……………………………………… 478


Tables

Table 1 – Electricity Production by Country – 2020……………………….. 48

Table 2 – Energy & Electricity and Per Capita Consumption by Country / Region……………………………………………………………… 49

Table 3 – Renewable vs. Fossil Fuels Heating Efficiency Cost [$ Cent / KWh] – 2020 & 2030 F…………………………………………. 57

Table 4 – Global Net-Zero Electricity Generation and Distribution Market by Technology [$B] – 2022-2030……………………………. 62

Table 5 – Global Net-Zero Electricity Generation and Distribution Market by Revenue [$B] – 2020-2030……………………………….. 64

Table 6 – Global Net-Zero Electricity Generation and Distribution Market by Region [$B] – 2022-2030………………………………….. 64

Table 7 – Global Net-Zero Electricity Generation and Distribution Market by Country [$B] – 2020-2030…………………………………. 66

Table 8 – Global Net-Zero Electricity Generation and Distribution Technology Products & Services [$B] Markets – 2022-2030………………………………………………………………… 89

Table 9 – Global Net-Zero Electricity Generation and Distribution Markets Annual Growth Rates [%] – 2022-2030…………. 90

Table 10 – Global Net-Zero Electricity Generation and Distribution Products & Services Markets Shares [%] – 2022-2030… 92

Table 11 – Energy Production from Solid Biofuels and Renewable Waste (MW) by Ten Leading Countries……………………. 96

Table 12 – Global Bioenergy Market Size [$B] – 2022-2030………….. 109

Table 13 – Global Bioenergy Market Dynamics [%] – 2022-2030……. 109

Table 14 – Global Net-Zero Electricity Generation and Distribution Market, Bioenergy Market Share [%] – 2022-2030…….. 109

Table 15 – Global Compressed-Air Storage Market Size [$B] – 2022-2030………………………………………………………………. 113

Table 16 – Global Compressed-Air Storage Market Dynamics [%] – 2022-2030……………………………………………………….. 114

Table 17 – Global Net-Zero Electricity Generation and Distribution Market, Compressed-Air Storage Market Share [%] – 2022-2030……………………………………………………….. 114

Table 18 – Global Concentrating Solar Power (CSP) Market Size [$B] – 2022-2030……………………………………………………….. 119

Table 19 – Global Concentrating Solar Power (CSP) Market Dynamics [%] – 2022-2030………………………………………………… 120

Table 20 – Global Warming Mitigation Market, Concentrating Solar Power (CSP) Market Share [%] – 2022-2030……………. 120

Table 21 – Cost (Euro/MWh) of Domestic Heating in France………… 124

Table 22 – Cost (Euro/MW) of District Heating in France……………… 125

Table 23 – Global Direct Geothermal Heating & Cooling Market Size [$B] – 2022-2030……………………………………………….. 125

Table 24 – Global Direct Geothermal Heating & Cooling Market Dynamics [%] – 2022-2030………………………………….. 126

Table 25 – Global Net-Zero Electricity Generation and Distribution Market, Direct Geothermal Heating & Cooling Market Share [%] – 2022-2030……………………………………….. 126

Table 26 – Global Direct Solar Water Heating Market Size [$B] – 2022-2030………………………………………………………………. 131

Table 27 – Global Direct Solar Water Heating Market Dynamics [%] – 2022-2030……………………………………………………….. 132

Table 28 – Global Net-Zero Electricity Generation and Distribution Market, Direct Solar Water Heating Market Share [%] – 2022-2030……………………………………………………….. 132

Table 29 – Global Geothermal Power Generation Market Size [$B] – 2022-2030……………………………………………………….. 140

Table 30 – Global Geothermal Power Generation Market Dynamics [%] – 2022-2030……………………………………………………… 140

Table 31 – Global Net-Zero Electricity Generation and Distribution Market, Geothermal Power Generation Market Share [%] – 2022-2030……………………………………………………….. 141

Table 32 – Global Grid Modernization Market Size [$B] – 2022-2030 149

Table 33 – Global Grid Modernization Market Dynamics [%] – 2022-2030………………………………………………………………. 150

Table 34 – Global Net-Zero Electricity Generation and Distribution Market, Grid Modernization Market Share [%] – 2022-2030                                                                                  150

Table 35 – Global Grid-Scale Battery Storage Market Size [$B] – 2022-2030………………………………………………………………. 157

Table 36 – Global Grid-Scale Battery Storage Market Dynamics [%] – 2022-2030……………………………………………………….. 158

Table 37 – Global Net-Zero Electricity Generation and Distribution Market, Grid-Scale Battery Storage Market Share [%] – 2022-2030……………………………………………………….. 158

Table 38 – Global Hydroelectric Energy Storage Market Size [$B] – 2022-2030……………………………………………………….. 164

Table 39 – Global Hydroelectric Energy Storage Market Dynamics [%] – 2022-2030……………………………………………………….. 165

Table 40 – Global Net-Zero Electricity Generation and Distribution Market, Hydroelectric Energy Storage Market Share [%] – 2022-2030……………………………………………………….. 165

Table 41 – Global Hydroelectric Power Market Size [$B] – 2022-2030                                                                                  171

Table 42 – Global Hydroelectric Power Market Dynamics [%] – 2022-2030………………………………………………………………. 171

Table 43 – Global Net-Zero Electricity Generation and Distribution Market, Hydroelectric Power Market Share [%] – 2022-2030………………………………………………………………. 172

Table 44 – Global Marine Power Market Size [$B] – 2022-2030…….. 178

Table 45 – Global Marine Power Market Dynamics [%] – 2022-2030. 178

Table 46 – Global Net-Zero Electricity Generation and Distribution Market, Marine Power Market Share [%] – 2022-2030.. 179

Table 47 – Global Nuclear Energy Plants > 1 GW Market Size [$B] – 2022-2030……………………………………………………….. 183

Table 48 – Global Nuclear Energy Plants > 1 GW Market Dynamics [%] – 2022-2030……………………………………………………… 183

Table 49 – Global Net-Zero Electricity Generation and Distribution Market, Nuclear Energy Plants > 1 GW Market Share [%] – 2022-2030……………………………………………………….. 184

Table 50 – Global Offshore Wind Power Market Size [$B] – 2022-2030                                                                                  193

Table 51 – Global Offshore Wind Power Market Dynamics [%] – 2022-2030………………………………………………………………. 194

Table 52 – Global Net-Zero Electricity Generation and Distribution Market, Offshore Wind Power Market Share [%] – 2022-2030………………………………………………………………. 194

Table 53 – Global Onshore Wind Power Market Size [$B] – 2022-2030                                                                                  199

Table 54 – Global Onshore Wind Power Market Dynamics [%] – 2022-2030………………………………………………………………. 199

Table 55 – Global Net-Zero Electricity Generation and Distribution Market, Onshore Wind Power Market Share [%] – 2022-2030………………………………………………………………. 200

Table 56 – Global Other Energy Storage Modalities Market Size [$B] – 2022-2030……………………………………………………….. 201

Table 57 – Global Other Energy Storage Modalities Market Dynamics [%] – 2022-2030………………………………………………… 201

Table 58 – Global Net-Zero Electricity Generation and Distribution Market, Other Energy Storage Modalities Market Share [%] – 2022-2030……………………………………………………. 202

Table 59 – Global Other Renewable Energy Market Size [$B] – 2022-2030………………………………………………………………. 203

Table 60 – Global Other Renewable Energy Market Dynamics [%] – 2022-2030……………………………………………………….. 203

Table 61 – Global Net-Zero Electricity Generation and Distribution Market, Other Renewable Energy Market Share [%] – 2022-2030……………………………………………………….. 204

Table 62 – Global Rooftop Solar PV Market Size [$B] – 2022-2030… 208

Table 63 – Global Rooftop Solar PV Market Dynamics [%] – 2022-2030                                                                                  208

Table 64 – Global Net-Zero Electricity Generation and Distribution Market, Rooftop Solar PV Market Share [%] – 2022-2030                                                                                  208

Table 65 – Global Small Nuclear Reactors Market Size [$B] – 2022-2030………………………………………………………………. 212

Table 66 – Global Small Nuclear Reactors Market Dynamics [%] – 2022-2030………………………………………………………………. 212

Table 67 – Global Net-Zero Electricity Generation and Distribution Market, Small Nuclear Reactors Market Share [%] – 2022-2030………………………………………………………………. 213

Table 68 – Global Solar PV (Utility Scale) Market Size [$B] – 2022-2030                                                                                  220

Table 69 – Global Solar PV (Utility Scale) Market Dynamics [%] – 2022-2030………………………………………………………………. 221

Table 70 – Global Net-Zero Electricity Generation and Distribution Market, Solar PV (Utility Scale) Market Share [%] – 2022-2030………………………………………………………………. 221

Table 71 – Global Thermal Energy Storage Market Size [$B] – 2022-2030………………………………………………………………. 227

Table 72 – Global Thermal Energy Storage Market Dynamics [%] – 2022-2030……………………………………………………….. 227

Table 73 – Global Net-Zero Electricity Generation and Distribution Market, Thermal Energy Storage Market Share [%] – 2022-2030………………………………………………………………. 228

Table 74 – Global Waste to Energy Plants Market Size [$B] – 2022-2030                                                                                  232

Table 75 – Global Waste to Energy Plants Market Dynamics [%] – 2022-2030………………………………………………………………. 232

Table 76 – Global Net-Zero Electricity Generation and Distribution Market, Waste to Energy Plants Market Share [%] – 2022-2030………………………………………………………………. 233

Table 77 – Net-Zero Electricity Generation and Distribution Market Size [$M] by Revenue Source – 2020-2030…………………… 234

Table 78 – Net-Zero Electricity Generation and Distribution Market AGRs [%] by Revenue Source – 2020-2030……………. 235

Table 79 – Net-Zero Electricity Generation and Distribution Market by Region [$B] – 2022-2030…………………………………….. 237

Table 80 – North America Net-Zero Electricity Generation and Distribution Market Size [$M] by Sector – 2020-2030… 240

Table 81 – North America Net-Zero Electricity Generation and Distribution Market Size [$M] by Revenue Source – 2020-2030………………………………………………………………. 242

Table 82 – North America Net-Zero Electricity Generation and Distribution Market AGRs [%] by Revenue Source – 2020-2030………………………………………………………………. 243

Table 83 – Latin America Net-Zero Electricity Generation and Distribution Market Size [$M] by Sector – 2020-2030… 246

Table 84 – Latin America Net-Zero Electricity Generation and Distribution Market Size [$M] by Revenue Source – 2020-2030………………………………………………………………. 248

Table 85 – Latin America Net-Zero Electricity Generation and Distribution Market AGRs [%] by Revenue Source – 2020-2030………………………………………………………………. 249

Table 86 – Europe Net-Zero Electricity Generation and Distribution Market Size [$M] by Sector – 2020-2030………………… 252

Table 87 – Europe Net-Zero Electricity Generation and Distribution Market Size [$M] by Revenue Source – 2020-2030…… 254

Table 88 – Europe Net-Zero Electricity Generation and Distribution Market AGRs [%] by Revenue Source – 2020-2030….. 255

Table 89 – Middle East & Africa Net-Zero Electricity Generation and Distribution Market Size [$M] by Sector – 2020-2030… 258

Table 90 – Middle East & Africa Net-Zero Electricity Generation and Distribution Market Size [$M] by Revenue Source – 2020-2030………………………………………………………………. 260

Table 91 – Middle East & Africa Net-Zero Electricity Generation and Distribution Market AGRs [%] by Revenue Source – 2020-2030………………………………………………………………. 261

Table 92 – Asia Pacific Net-Zero Electricity Generation and Distribution Market Size [$M] by Sector – 2020-2030………………… 265

Table 93 – Asia Pacific Net-Zero Electricity Generation and Distribution Market Size [$M] by Revenue Source – 2020-2030…… 267

Table 94 – Asia Pacific Net-Zero Electricity Generation and Distribution Market AGRs [%] by Revenue Source – 2020-2030….. 268

Table 95 – Net-Zero Electricity Generation and Distribution Technologies Market Size [$B] By Country – 2020-2030                                                                                  273

Table 96 – Net-Zero Electricity Generation and Distribution Market AGRs [%] By Country – 2020-2030……………………….. 274

Table 97 – National Market Shares of the Net-Zero Electricity Generation and Distribution Market [%] – 2020-2030… 276

Table 98 – Net-Zero Electricity Generation and Distribution Infrastructure Markets Size [$B] By Country – 2020-2030…………….. 279

Table 99 – Net-Zero Electricity Generation and Distribution Products Sales [$B] By Country – 2020-2030………………………. 281

Table 100 – Net-Zero Electricity Generation and Distribution Maintenance Markets Size [$B] By Country – 2020-2030                                                                                  282

Table 101 – Net-Zero Electricity Generation and Distribution Upgrades Markets Size [$B] By Country – 2020-2030…………….. 284

Table 102 – Net-Zero Electricity Generation and Distribution Other* Revenue Sources [$B] By Country – 2020-2030………. 286

Table 103 – Renewable Energy and Climate Targets in the United States…………………………………………………………….. 289

Figures

Figure 1 – COP26 Pledges & Targets Based GHG Emission [GTn] Forecast to 2030………………………………………………… 39

Figure 2 – Global Warming 2010-2020 by GHG Source…………………. 40

Figure 3 – Renewable Energy Generation By Technology & By User.. 42

Figure 4 – Greenhouse Gas Emissions [%] by Sector……………………. 43

Figure 5 – Climate Change Causes and Effects…………………………… 44

Figure 6- Global Energy demand (left) & GHS Emission (Right) By Sector – 2020…………………………………………………….. 45

Figure 7 – GHG Emission per GWh of Energy Production – 2020…….. 46

Figure 8 – Average USA Levelized cost [$/MWh] of Electricity By Energy Technology – 2020……………………………………. 46

Figure 9 – Renewable Electricity Generation by Technology and Region                                                                                    47

Figure 10 – Global Electricity Consumption by Energy Source – 1985-2020………………………………………………………………… 47

Figure 11 – Levelized Cost [$/MWh] of Energy, by Source – 2008-2020                                                                                    47

Figure 12 – Renewable, Nuclear & Fossil Energy Prices [$/MWh] & Installed Capacity – 2010-2019……………………………… 48

Figure 13 – Global Warming vs. Number of Climate-Related Disasters – 1970-2032…………………………………………………………. 50

Figure 14 – Energy Storage: Duration Time and Rated Power by Modality……………………………………………………………. 50

Figure 15 – Renewable Generation Capacity By Region………………… 51

Figure 16 – Leading Renewable Energy Capacity [GW] by Country – 2020………………………………………………………………… 51

Figure 17 – Negative Emissions Role in Achieving NetZero……………. 52

Figure 18 – Global GHG Emission Reduction [%] by Technology – 2030                                                                                    57

Figure 19 – Global Electricity Generation [000 TWh] by Source – 2010- 2040………………………………………………………………… 58

Figure 20 – Global Net-Zero Electricity Generation and Distribution Market by Region [$B] – 2022-2030………………………… 66

Figure 21 – Global LCOEs From Newly Commissioned, Utility-Scale Renewable Power Generation Technologies, 2010-2020 96

Figure 22 – Bioenergy Thermo-Chemical Process………………………. 100

Figure 23 – Bioenergy Bio-Chemical Process…………………………….. 101

Figure 24 – Global Bioenergy Market Size [$B] – 2022-2030…………. 110

Figure 25 – System Power Rating and Discharge Times of Energy Storage Technologies………………………………………… 111

Figure 26 – Compressed-Air Energy Storage System………………….. 112

Figure 27 – A Small Scale Compressed Air Storage System…………. 112

Figure 28 – Global Compressed-Air Storage Market Size [$B] – 2022-2030………………………………………………………………. 114

Figure 29 – Global Average Levelized Cost of Energy Generation [$/MWh] Concentrating Solar Power vs. Other Electric Power Sources – Q-4 2021………………………………….. 116

Figure 30 – Concentrating Solar Power System Layout and Costs…. 117

Figure 31 – Global LCOEs From Newly Commissioned, Utility-Scale Renewable Power Generation Technologies, 2010-2020                                                                                  118

Figure 32 – Global Concentrating Solar Power (CSP) Market Size [$B] – 2022-2030……………………………………………………….. 120

Figure 33 – Applications of Direct Utilization of Geothermal Energy… 123

Figure 34 – Closed (Left) & Open (Right) loop Geothermal Heat Pumps                                                                                  124

Figure 35 – EU Areas Suitable for Geothermal Networks & Actual Geothermal Installed Capacity……………………………… 125

Figure 36 – Global Direct Geothermal Heating & Cooling Market Size [$B] – 2022-2030……………………………………………….. 126

Figure 37 – Residential Direct Solar Water Heating System………….. 128

Figure 38 – Total Installed Solar Heating Area by Region – 2020……. 129

Figure 39 – Direct Solar Water Heating System Elements…………….. 129

Figure 40 – Direct Solar Heating Capacity [KW/1000 citizens] in 10 Leading Countries – 2020……………………………………. 130

Figure 41 – Global Solar Thermal Capacity [TWh] and Energy [TWh] – 2000-2022……………………………………………………….. 131

Figure 42 – Distribution of Solar Thermal Systems for Newly Installed Water Collector by Region – 2020…………………………. 131

Figure 43 – Global Direct Solar Water Heating Market Size [$B] – 2022-2030………………………………………………………………. 132

Figure 44 – Global Average Levelized Cost of Energy Generation [$/MWh] Geothermal vs. Other Electric Power Sources – Q-4 2021…………………………………………………………. 134

Figure 45 – Geothermal Electricity Generation Technologies……… 135

Figure 46 – Global LCOEs From Newly Commissioned, Utility-Scale Renewable Power Generation Technologies, 2010-2020                                                                                  135

Figure 47 – Enhanced Geothermal Systems……………………………… 136

Figure 48 – Geothermal Power Generation……………………………….. 137

Figure 49 – Map of 64 EGS Projects Around the World – 2020………. 139

Figure 50 – Global Geothermal Power Generation Market Size [$B] – 2022-2030……………………………………………………….. 141

Figure 51 – Diagram of a Conventional Electric Power System……… 143

Figure 52 – Modern Grid Architecture ……………………………………… 144

Figure 53 – Climate Change Effects on the Electricity Grid……………. 145

Figure 54 – Smart Grid Architecture………………………………………… 146

Figure 55 -Smart Grid Priorities……………………………………………… 149

Figure 56 – Global Grid Modernization Market Size [$B] – 2022-2030 150

Figure 57 – System Power Rating and Discharge Times of Energy Storage Technologies………………………………………… 152

Figure 58 – Grid Battery Storage Infrastructure………………………….. 153

Figure 59 – Next Generation Battery Storage Goals…………………… 154

Figure 60 – Grid-Scale Battery Storage System…………………………. 154

Figure 61 – Global Grid-Scale Battery Storage Market Size [$B] – 2022-2030………………………………………………………………. 159

Figure 62 – Pumped Storage Hydropower Site…………………………… 160

Figure 63 – Pumped Hydro Energy Storage, Power Rating and Discharge Times Vs. Other Energy Storage Technologies                                                                                  161

Figure 64 – Pumped Hydro Energy Storage System Layout………….. 162

Figure 65 – Global Hydroelectric Energy Storage Market Size [$B] – 2022-2030……………………………………………………….. 165

Figure 66 – Hydropower Installed Capacity by Country………………… 167

Figure 67 – Global Average Levelized Cost of Energy Generation [$/MWh] Hydropower vs. Other Electric Power Sources – Q-4 2021…………………………………………………………. 168

Figure 68 – Global LCOEs From Newly Commissioned, Utility-Scale Renewable Power Generation Technologies, 2010-2020                                                                                  168

Figure 69 – Hydropower Generation [TW h] by Region -1965-2020… 169

Figure 70- A Hydropower Plant………………………………………………. 171

Figure 71 – Global Hydroelectric Power Market Size [$B] – 2022-2030                                                                                  172

Figure 72 – Global LCOEs From Newly Commissioned, Utility-Scale Renewable Power Generation Technologies, 2010-2020                                                                                  174

Figure 73 – Ocean thermal energy Conversion System (Right) and Oscillating Water Column System (Left)…………………. 175

Figure 74 – Wave Power System……………………………………………. 178

Figure 75 – Global Marine Power Market Size [$B] – 2022-2030……. 179

Figure 76 – Global Average Levelized Cost of Energy Generation [$/MWh] Nuclear Energy Plants vs. Other Electric Power Sources – Q-4 2021……………………………………………. 181

Figure 77 – Global LCOEs From Newly Commissioned, Utility-Scale Renewable Power Generation Technologies, 2010-2020                                                                                  182

Figure 78 – Global Nuclear Energy Plants > 1 GW Market Size [$B] – 2022-2030……………………………………………………….. 184

Figure 79 – Global Average Levelized Cost of Energy Generation [$/MWh] Offshore Wind vs. Other Electric Power Sources – Q-4 2021…………………………………………………………. 186

Figure 80 – Wind Turbine Power and Size 1985-2030…………………. 187

Figure 81 – Global LCOEs from Newly Commissioned, Utility-Scale Renewable Power Generation Technologies, 2010-2020                                                                                  187

Figure 82 – U.S. DOE Offshore Wind Energy 2030 Goals…………….. 190

Figure 83- Global Installed Base Power [MW] of Offshore Wind Power to 2020……………………………………………………………. 190

Figure 84 – Annual 2001-2021 Additional Offshore Wind Installed Capacity [GW] China vs. the Rest of World……………… 191

Figure 85 – Global Offshore Wind Power Market Size [$B] – 2022-2030                                                                                  195

Figure 86 – Onshore Wind Turbines LCOE, Size, Capacity & Impacts – 2030………………………………………………………………. 196

Figure 87 – Global Average Levelized Cost of Energy Generation [$/MWh] Onshore Wind Power vs. Other Electric Power Sources – Q-4 2021……………………………………………. 197

Figure 88 – Global LCOEs From Newly Commissioned, Utility-Scale Renewable Power Generation Technologies, 2010-2020                                                                                  197

Figure 89 – Global Onshore Wind Power Market Size [$B] – 2022-2030                                                                                  200

Figure 90 – Global Other Energy Storage Modalities Market Size [$B] – 2022-2030……………………………………………………….. 202

Figure 91 – Global Other Renewable Energy Market Size [$B] – 2022-2030………………………………………………………………. 204

Figure 92 – Global Average Levelized Cost of Energy Generation [$/MWh] Rooftop Solar vs. Other Electric Power Sources – Q-4 2021…………………………………………………………. 206

Figure 93 – Global Rooftop Solar PV Market Size [$B] – 2022-2030.. 209

Figure 94 – Global Average Levelized Cost of Energy Generation [$/MWh] Small Nuclear Reactors vs. Other Electric Power Sources – Q-4 2021……………………………………………. 210

Figure 95 – Global LCOEs From Newly Commissioned, Utility-Scale Renewable Power Generation Technologies, 2010-2020                                                                                  211

Figure 96 – Global Small Nuclear Reactors Market Size [$B] – 2022-2030………………………………………………………………. 213

Figure 97 – Installed Base of Solar PV by Country……………………… 215

Figure 98 – Global Average Levelized Cost of Energy Generation [$/MWh] Solar PV vs. Other Electric Power Sources – Q-4 2021………………………………………………………………. 216

Figure 99 – Global LCOEs From Newly Commissioned, Utility-Scale Renewable Power Generation Technologies, 2010-2020                                                                                  217

Figure 100 – Ground Mounted Solar PV System………………………… 218

Figure 101 -The DOE Solar PV Deployment [GW] Outlook 2020-2050                                                                                  219

Figure 102 – Global Solar PV (Utility Scale) Market Size [$B] – 2022-2030………………………………………………………………. 221

Figure 103 – System Power Rating and Discharge Times Of Energy Storage Technologies………………………………………… 223

Figure 104 – Thermal Energy Storage (TES) System Layout………… 224

Figure 105 – Residential Thermal Energy Storage……………………… 225

Figure 106 – Global Thermal Energy Storage Market Size [$B] – 2022-2030………………………………………………………………. 228

Figure 107 – Waste Management Process………………………………… 230

Figure 108 – UN Projection of the Global Waste [M Ton/Annum] Quantity – 1950-2050…………………………………………. 231

Figure 109 – Global Waste to Energy Plants Market Size [$B] – 2022-2030………………………………………………………………. 233

Figure 110 – Net-Zero Electricity Generation and Distribution Market Size [$M] by Revenue Source – 2020-2030…………….. 236

Figure 111 – Net-Zero Electricity Generation and Distribution Market Share [%] by Revenue Source – 2020-2030……………. 237

Figure 112 – Net-Zero Electricity Generation and Distribution Market by Region [$B] – 2022-2030…………………………………….. 238

Figure 113 – North America Final Energy Demand by Sector [EJ]….. 239

Figure 114 – North America Primary Energy Consumption by Sector [EJ]                                                                                  240

Figure 115 – Cumulative 2022-2030 North America Net-Zero Electricity Generation and Distribution Market by Sector [$B]……. 242

Figure 116 – North America Net-Zero Electricity Generation and Distribution Market Size [$M] by Revenue Source – 2020-2030………………………………………………………………. 243

Figure 117 – North America Net-Zero Electricity Generation and Distribution Market Share [%] by Revenue Source – 2020-2030………………………………………………………………. 244

Figure 118 – Latin America Final Energy Demand by Sector [EJ]…… 245

Figure 119 – Latin America Primary Energy Consumption by Sector [EJ]                                                                                  247

Figure 120 – Cumulative 2022-2030 Latin America Net-Zero Electricity Generation and Distribution Market by Sector [$B]……. 248

Figure 121 – Latin America Net-Zero Electricity Generation and Distribution Market Size [$M] by Revenue Source – 2020-2030………………………………………………………………. 249

Figure 122 – Latin America Net-Zero Electricity Generation and Distribution Market Share [%] by Revenue Source – 2020-2030………………………………………………………………. 250

Figure 123 – Europe Final Energy Demand by Sector [EJ]……………. 251

Figure 124 – Europe Primary Energy Consumption by Sector [EJ]…. 252

Figure 125 – Cumulative 2022-2030 Europe Net-Zero Electricity Generation and Distribution Market by Sector [$B]……. 254

Figure 126 – Europe Net-Zero Electricity Generation and Distribution Market Size [$M] by Revenue Source – 2020-2030…… 255

Figure 127 – Europe Net-Zero Electricity Generation and Distribution Market Share [%] by Revenue Source – 2020-2030….. 256

Figure 128 – MEA Final Energy Demand by Sector [EJ]………………. 257

Figure 129 – MEA Primary Energy Consumption by Sector [EJ]…….. 258

Figure 130 – Cumulative 2022-2030 Global Middle East & Africa Change Mitigation & Adaptation Market by Sector [$B]. 260

Figure 131 – Middle East & Africa Net-Zero Electricity Generation and Distribution Market Size [$M] by Revenue Source – 2020-2030………………………………………………………………. 261

Figure 132 – Middle East & Africa Net-Zero Electricity Generation and Distribution Market Share [%] by Revenue Source – 2020-2030………………………………………………………………. 262

Figure 133 – Australia, New Zealand, Japan and South Korea Final Energy Demand by Sector [EJ]…………………………….. 263

Figure 134 – Australia, New Zealand, Japan and South Korea Primary Energy Consumption by Sector [EJ]………………………. 265

Figure 135 – Cumulative 2022-2030 Asia Pacific Net-Zero Electricity Generation and Distribution Market by Sector [$B]……. 267

Figure 136 – Asia Pacific Net-Zero Electricity Generation and Distribution Market Size [$M] by Revenue Source – 2020-2030………………………………………………………………. 268

Figure 137 – Asia Pacific Net-Zero Electricity Generation and Distribution Market Share [%] by Revenue Source – 2020-2030………………………………………………………………. 269

Figure 138 – Energy Use Per Person, 2019………………………………. 270

Figure 139 – Consumption-Based Energy Use Per Person: Global Map, 2020………………………………………………………………. 271

Figure 140 – Consumption-Based Energy Use Per Person: Selected Countries………………………………………………………… 271

Figure 141 – Primary Energy Consumption by World Region – 1965-2020………………………………………………………………. 272

Figure 142 – World Energy Trilemma Index: Leading Countries – 2021                                                                                  273

Figure 143 – Net-Zero Electricity Generation and Distribution Market Share by Country – 2030…………………………………….. 279

Figure 144 – U.S. Electricity Generation by Major Energy Source, 1950-2020………………………………………………………………. 291

Figure 145 – Canada Electricity Generation by Energy Source [%], 2018                                                                                  295

Figure 146 – Energy Consumption by Source, Argentina……………… 298

Figure 147 – Electricity Generation In Argentina In 2020, By Type Of Fuel* (In Terawatt Hours)……………………………………. 299

Figure 148 – Brazil Power Generation Supply, 2020…………………… 302

Figure 149 – Total Energy Supply (TES) by Source, Chile 1990-2020 306

Figure 150 – Consumption Trends by Energy Source (Mtoe)………… 309

Figure 151 – Total Energy Supply (TES) by Source, Cuba 1990-2020                                                                                  311

Figure 152 – Ecuador Power Generation, 2020………………………….. 313

Figure 153 – Mexico Electricity Generation by Technology (October 2020)……………………………………………………………… 317

Figure 154 – Distribution of Electricity Generation in Peru in 2020, By Source……………………………………………………………. 319

Figure 155 – Venezuela: Installed and Available Generating Capacity and Supply, 2000–2020……………………………………… 323

Figure 156 – Total Energy Supply (TES) by Source, Austria 1990-2020                                                                                  326

Figure 157 – Consumption Trends by Energy Source in Belarus (Mtoe)                                                                                  328

Figure 158 – Total Energy Supply (TES) by Source, Belgium 1990-2019                                                                                  331

Figure 159 – Bulgaria Installed Energy Capacity………………………… 333

Figure 160 – Total Energy Supply (TES) by Source, Czech Republic 1990-2019……………………………………………………….. 336

Figure 161 – Total Energy Supply (TES) by Source, Denmark 1990-2019………………………………………………………………. 338

Figure 162 – Electricity Generation by Energy Source, Finland, 2000-2019………………………………………………………………. 342

Figure 163 – France Total Energy Supply (TES) by Source 1990-2019                                                                                  345

Figure 164 -The German Renewable Energy Use & Reduced Energy Consumption Scenario – 2005-2050………………………. 349

Figure 165 – Germany Electricity Generation per Week 22 – 2021 by Energy Generation Mode……………………………………. 350

Figure 166 – Sources of Large-Scale Energy Capacity [MW] Installed in Greece as of June 2020……………………………………… 354

Figure 167 – Total Energy Supply (TES) by Source, Hungary 1990-2019                                                                                  356

Figure 168 – Total Energy Supply (TES) by Source, Italy 1990-2019. 359

Figure 169 – Distribution of Electricity Generation in the Netherlands in 2020, By Source……………………………………………….. 362

Figure 170 – National Electricity Generation by Energy Source, Norway, in 2019……………………………………………………………. 365

Figure 171 – Total Energy Supply (TES) by Source, Poland 1990-2019                                                                                  367

Figure 172 – Total Energy Supply (TES) by Source, Portugal 1990-2019                                                                                  370

Figure 173 – Romania Consumption Trends by Energy Source (Mtoe)                                                                                  373

Figure 174 – Russia Consumption Trends by Energy Source (Mtoe). 376

Figure 175 – Serbian Energy Distribution, 2019…………………………. 380

Figure 176 – Total Energy Supply (TES) by Source, Slovak Republic 1990-2020……………………………………………………….. 382

Figure 177 – Total Energy Supply (TES) by Source, Spain 1990-2020                                                                                  384

Figure 178 – Sweden Energy Consumption, 1800-2020………………. 387

Figure 179 – Total Energy Supply (TES) by Source, Switzerland 1990-2020………………………………………………………………. 391

Figure 180 – The UK Inland Energy Consumption, 1990 and 2020 by Energy Source………………………………………………….. 393

Figure 181 – The UK Electricity Generation, 1990 and 2020 by Energy Source……………………………………………………………. 394

Figure 182 – Solar PV Installed by Quarter in UK……………………….. 395

Figure 183 – Consumption Trends by Energy Source in Ukraine (Mtoe)                                                                                  397

Figure 184 – Installed Energy Capacity of Algeria, 2019 vs. Projected 2028………………………………………………………………. 401

Figure 185 – Consumption Trends by Energy Source (Mtoe)………… 403

Figure 186 – Iran’s Electricity Generation by Fuel, 2019………………. 406

Figure 187 – Consumption Trends by Energy Source in Israel (Mtoe)                                                                                  409

Figure 188 – Total Energy Supply (TES) by Source, Saudi Arabia, 1990-2019………………………………………………………………. 414

Figure 189 – South Africa Electricity Consumption Breakdown by Sector (2020, %)………………………………………………………… 417

Figure 190 – Electricity Generation in Turkey from 2019 to 2020, by Fuel                                                                                  420

Questions about this report?

Contact Sales: 1-571-527-1010 or Analysts: 1-202-455-0966

  • Have a question about Net-Zero Electricity Generation and Distribution Technologies & Markets - 2022-2030 – With Corona & COP26 Impacts
    Please fill out all fields in the form below and click "Submit" to send your question.
    Our representative will review your question and contact you with an answer as soon as possible.
  • 2+2=
  • This field is for validation purposes and should be left unchanged.
1
Interested in this report? Need more information?

You may also like…

X
Powered By