Top
HSRCExtreme Weather Events Mitigation Technologies & Markets – 2022-2030 – With Corona & COP26 Impacts
NEW

Extreme Weather Events Mitigation Technologies & Markets - 2022-2030 – With Corona & COP26 Impacts

Bottom-up Research of 311 Submarkets. 2026 Market $435 Billion.

  • July 2022
  • 320
  • 204
    • 4950 $
    • 5950 $
    • 8950 $
    • 12000 $

    Small Businesses, Startups & Academia - Up to 50% Off

Quantity
IBM
Amazon
Sandia National Lab
HITACHI
Thales
Smiths Detection
Nuctech
Korea Internet & Security Agency
L3Harris
Huawei
Leidos
NEC
Toshiba
Deloitte
MAG

Want to customize this report?

If you purchase this report, you are entitled to a 30% discount towards customizing it, to better fit your market research and strategic needs. Our Custom Research and Industry Insights Department will work with you to better understand your information gaps and strategic needs and will provide you with a tailor-made market research report within a short period of time.

Why Choose Us?

30+ Years of Experience
We are a multidisciplinary team of Transformational Technologies industry experts with over 30 years of experience.
Gold Standard
With over 950 private sector clients (73% repeat customers), including major defense and security vendors, and Forbes Global 2000 companies, HSRC earned the reputation as the industry’s Gold Standard for Transformational Technologies Market Reports.
Tailored Research Services
Provide you with clear, actionable recommendations designed to empower decision making and to help you exploit emerging opportunities in the Transformational Technologies industries.
Information Security
Your personal information is safe and secure.

From: $4,950

Description


The 320-page Extreme Weather Events Mitigation Technologies & Markets – 2022-2030 – With Corona & COP26 Impacts report contains a thorough analysis of 6 technologies, 5 regional, 5 revenue source and 60 national markets, detailing 311 markets.


IPCC-2022 Climate Risk to Climate Resilient Roadmap

Source: IPCC Report Feb. 28, 2022

 “Human-induced climate change, including more frequent and intense extreme events, has caused widespread adverse impacts and related losses and damages to nature and people”  

IPCC Report (Feb. 28, 2022)

The report focuses on the mitigation investments of weather emergencies such as tornadoes, hurricanes, ice storms, fire, flooding, sand storms and heat waves, earthquakes, landslides and tsunamis.

This market report is the utmost comprehensive review of the Extreme Weather Events Mitigation market available today.

Questions answered in this report include:

  • What will the 2022-2030 market size be?
  • How do COP26 & Corona affect the market?
  • Which submarkets provide attractive business opportunities?
  • What drives customers to invest?
  • What are the technologies trends?
  • What are the challenges to market penetration & growth?
  • How much are countries expected to invest in Extreme Weather Events Mitigation?

Extreme Weather Events Mitigation Market Segmentation Vectors


What does the Extreme Weather Events Mitigation Technologies & Markets – 2022-2030 – With Corona & COP26 Impacts report give you?

A. The Extreme Weather Events Mitigation Technologies market size data is analyzed via four independent perspectives.

1. By 6 Extreme Weather Events Mitigation Technologies:

  • Climate Adapted Water Infrastructure
  • Floods Control
  • Wildfire Mitigation
  • Weather Monitoring, Modeling & Forecasting
  • Extreme Weather Public Warning Systems
  • GHG Emission Tracking

 2. By 5 Revenue Source Markets:

  • Infrastructure
  • Product Sales
  • Maintenance
  • Upgrades
  • Other

3. By 5 Regional Markets:

  1. North America
  2. Latin America
  3. Europe
  4. Middle East & Africa
  5. Asia Pacific

4. By 60 National Markets:

  • The U.S.
  • Canada
  • Argentina
  • Brazil
  • Chile
  • Colombia
  • Cuba
  • Ecuador
  • Mexico
  • Peru
  • Puerto Rico
  • Venezuela
  • Rest of Latin America
  • Austria
  • Belarus
  • Belgium
  • Bulgaria
  • Czech Republic
  • Denmark
  • Finland
  • France
  • Germany
  • Greece
  • Hungary
  • Italy
  • Netherlands
  • Norway
  • Poland
  • Portugal
  • Romania
  • Russia
  • Serbia
  • Slovakia
  • Spain
  • Sweden
  • Switzerland
  • UK
  • Ukraine
  • Rest of Europe
  • Algeria
  • Egypt
  • Iran
  • Israel
  • Kuwait
  • Saudi Arabia
  • South Africa
  • Turkey
  • UAE
  • Rest of MEA
  • Australia
  • China
  • India
  • Indonesia
  • Japan
  • Kazakhstan
  • Philippines
  • South Korea
  • Thailand
  • Vietnam
  • Rest of Asia-Pacific

B. Detailed market analysis frameworks are provided, including:

  • Market drivers & inhibitors
  • Business opportunities
  • SWOT analysis
  • Competitive analysis
  • Business environment
  • The 2020-2030 market
  • Industry Value Chain   
  • Financing & Loans       
  • Governmental R&D Funding    

C. Companies mentioned in the report: 

  • ABB Ltd
  • AccuWeather Inc.
  • Aerobotics
  • Airmar Technology Corporation
  • All Weather, Inc.
  • AMETEK, Inc.
  • Amii Sp. z o.o.
  • Aquaphor
  • AWMA
  • Barchemicals
  • Bentley Systems
  • Berghof Membrane Technology
  • Berluto Armaturen GmbH
  • Bernardinello Engineering S.p.a.
  • Bertfelt Teknik AB
  • bestUV BV
  • Binder Engineering B.V.
  • BioEnTech
  • Bio-Microbics, Inc.
  • Biotek Environmental Science Ltd.
  • BIO-UV Group
  • Blount International
  • Blücher GmbH
  • Blue Foot Membranes NV
  • BLUEMATER SA
  • Blupura
  • BML METAL MANUFACTORY CO., LTD
  • Bokju Co., Ltd.
  • Bona Water Purification
  • Borg & Overström
  • Bosman Watermanagement B.V
  • Campbell Scientific   
  • Caterpillar
  • Changzhou Boyuan Plastic Co.,Ltd
  • Columbia Weather Systems
  • DAGAGA Co., Ltd.
  • Deere & Company
  • Doosan Infracore
  • DroneSeed
  • Ecolab Engineering GmbH
  • Ecolog
  • Emerson Electric Co
  • Flood Control Asia RS
  • Flood Control International
  • FloodBreak
  • Floodgates Ireland
  • FPZ SPA
  • Gebrüder Heyl Vertriebsgesellschaft für innovative Wasseraufbereitung mbH
  • General Electric Company
  • Haining BEISHI Environment Protection Technology CO., LTD
  • Hitachi Construction Machinery
  • Hunton Engineering
  • IBS Engineered Products
  • Insight Robotics
  • Integrated Forest Management
  • Komatsu Forest AB
  • Livingcare Co., Ltd.
  • Lufft Mess-und Regeltechnik
  • MM Engineering
  • Morcom International
  • Parafoil
  • Parker Hannifin Corporation
  • Pingluo Baojun Activated Carbon Co.,Ltd. | China
  • POLTANK SAU
  • Ponsse
  • Quantum Spatial
  • Raven Industries
  • Rockwell Automation, Inc
  • Rottne Industri AB
  • Sampo Rosenlew
  • SHENZHEN FONTUS TECHNOLOGY CO., LTD.
  • Sick AG
  • Siemens AG
  • Silvere
  • Skye Instruments 
  • SPC Biomicrogel Company Ltd
  • StormGeo
  • Sutron Corporation
  • Teledyne Technologies
  • The Weather Company  
  • Thermo Fisher Scientific
  • Tigercat
  • Treemetrics
  • Treevia Forest Technologies
  • Trimble
  • Vaisala OY
  • Veolia Water Technologies Techno Center Netherlands B.V.
  • Water Care Filter srl


D. 35 Traded Companies are mentioned in the report

Why Buy:

Bottom-up Research. The report provides you with exhaustive bottom-up research of 311 Extreme Weather Events Mitigation related markets.

Unique Analysts Team. Our multilingual team brings 40 years of hands-on record in the industry, corporate positions of chairperson, CEO, CTO, chief scientist, VP R & R&D, VP marketing, $8 B of products commercialization. The team published 352 market reports.

Extensive Research.  The report research team conducted interviews with dozens of experts. It reviewed over 380 reports, documents and papers published by other experts (including, for example, DOE, IEA, IRENA, the UN, the White House, the EU, US Congress CRS, the UK, German, PRC, Indian and other government agencies, SEC filings, investors’ presentations and more).

Multi-Source Intelligence Verification. With a highly fragmented market, we addressed each dollar spent. The global warming mitigation market was analyzed and crosschecked via 4 orthogonal viewpoints: technologies and services, countries, revenue sources and regions.

COP26 Revision. To guarantee the accuracy of the data and market size forecasts, we revised the report by following and analyzing the Glasgow COP26 meetings deliberations and investment pledges.

Money Trail. The report is the only study of ‘when?’, ‘where?’, ‘why?’ and ‘how much?’ of the cumulative 2022-2030 $5.4 trillion go to market.

Report Excel. Once you buy the report, you can get for a nominal price its Excel version.

Customized for Decision-Makers. This report aims to provide today’s strategic decision-makers with an expert 360-degree, time-sensitive, detailed view of this interconnected market.


Table of Contents

Download TOC as PDF

Contents

1         The Report Key Assumptions…………………………………. 29

2         Executive Summary………………………………………………. 30

2.1        Key Findings…………………………………………………… 30

2.2        Key Conclusions………………………………………………. 43

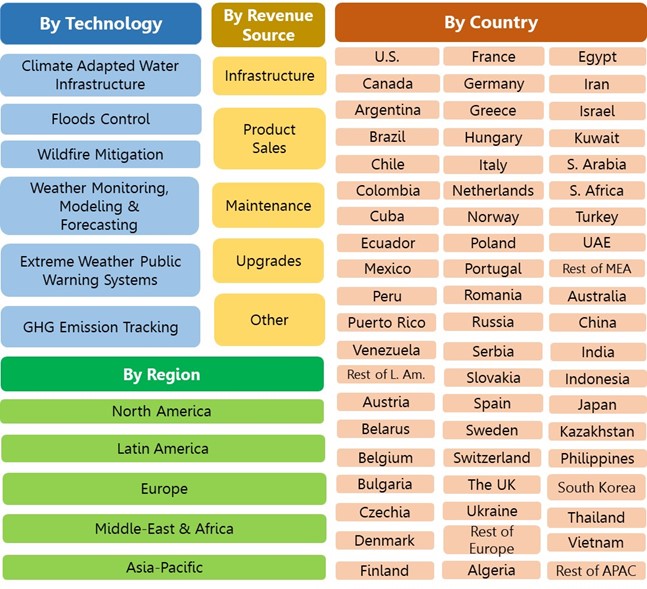
2.3        Global Extreme Weather Events Mitigation Market Segmentation Vectors……………………………………….. 53

2.4        Global Extreme Weather Events Mitigation Market – 2022-2030………………………………………………………. 54

2.4.1            Global Market by Technology – 2022-2030………. 54

2.4.2            Global Market by Revenue Source – 2022-2030… 56

2.4.3            Global Market by Region – 2022-2030…………….. 56

2.4.4            Global Market by Country – 2022-2030……………. 58

3         COP26 & COVID-19 Implications……………………………… 59

3.1        COP26 Takeaway……………………………………………. 59

3.2        COVID-19 Implications………………………………………. 60

4         The Industry Value Chain……………………………………….. 62

5         Business Opportunities…………………………………………. 63

6         Market Drivers………………………………………………………. 74

7         Market Inhibitors…………………………………………………… 75

8         SWOT Analysis…………………………………………………….. 76

8.1        Strengths……………………………………………………….. 76

8.2        Weaknesses…………………………………………………… 77

8.3        Opportunities…………………………………………………… 78

8.4        Threats………………………………………………………….. 79

TECHNOLOGY, PRODUCT & SERVICE MARKETS…………….. 81

9         Global Extreme Weather Events Mitigation Technologies, Products & Services Markets – 2020-2030………………… 81

9.1        Technology, Products & Services Markets Size………. 81

9.2        Technology Products & Services Markets Dynamics… 82

9.3        Technology Products & Services Markets Share……… 84

10      Climate Adapted Water Infrastructure Market – 2022-2030 86

10.1     CEO Takeaway……………………………………………….. 86

10.1.1          Summary………………………………………………….. 86

10.1.2          Digital Technologies……………………………………. 94

10.1.3          Water Management Strategy…………………………. 95

10.1.4          Agriculture Water Management……………………… 99

10.1.5          Urban Water Management………………………….. 100

10.1.6          Urban Decision Support System…………………… 101

10.2     Key Vendors………………………………………………….. 101

10.3     Global Climate Adapted Water Infrastructure Market – 2020-2030…………………………………………………….. 103

10.3.1          Climate Adapted Water Infrastructure Market Size……………………………………………………………… 103

10.3.2          Climate Adapted Water Infrastructure Market Dynamics………………………………………………… 103

10.3.3          Climate Adapted Water Infrastructure Market Share……………………………………………………………… 104

11      Extreme Weather Public Warning Systems Market – 2022-2030…………………………………………………………………… 105

11.1     CEO Takeaway……………………………………………… 105

11.1.1          Summary………………………………………………… 105

11.1.2          Cell Baed Broadcast………………………………….. 109

11.1.3          Location Based Alert SMS…………………………… 111

11.2     Global Extreme Weather Public Warning Systems Market – 2020-2030………………………………………… 113

11.2.1          Extreme Weather Public Warning Systems Market Size……………………………………………………….. 113

11.2.2          Extreme Weather Public Warning Systems Market Dynamics………………………………………………… 114

11.2.3          Extreme Weather Public Warning Systems Market Share……………………………………………………… 114

12      Flood Control Market – 2022-2030………………………….. 115

12.1     CEO Takeaway……………………………………………… 115

12.1.1          Summary………………………………………………… 115

12.1.2          Structural Forms of Mitigation………………………. 118

12.1.3          Nonstructural Measures……………………………… 119

12.1.4          Floodwater Diversion and Storage………………… 119

12.1.5          Floodplain and Stream Restoration……………….. 119

12.2     Key Vendors………………………………………………….. 119

12.3     Global Floods Control Market – 2020-2030…………… 120

12.3.1          Floods Control Market Size…………………………. 120

12.3.2          Floods Control Market Dynamics………………….. 121

12.3.3          Floods Control Market Share……………………….. 121

13      GHG Emission Tracking Market – 2022-2030…………… 122

13.1     CEO Takeaway……………………………………………… 122

13.1.1          Summary………………………………………………… 122

13.1.2          Methane Emission Tracking Technologies………. 126

13.2     Key Vendors………………………………………………….. 128

13.3     Global GHG Emission Tracking Market – 2020-2030. 128

13.3.1          GHG Emission Tracking Market Size…………….. 128

13.3.2          GHG Emission Tracking Market Dynamics……… 129

13.3.3          GHG Emission Tracking Market Share…………… 129

14      Weather Monitoring, Modeling & Forecasting Market – 2022-2030…………………………………………………………… 130

14.1     CEO Takeaway……………………………………………… 130

14.1.1          Summary………………………………………………… 130

14.1.2          AI and Machine Learning To Predict Weather Events……………………………………………………. 131

14.2     Key Vendors………………………………………………….. 133

14.3     Global Weather Monitoring, Modeling & Forecasting Market – 2020-2030………………………………………… 133

14.3.1          Weather Monitoring, Modeling & Forecasting Market Size……………………………………………………….. 133

14.3.2          Weather Monitoring, Modeling & Forecasting Market Dynamics………………………………………………… 134

14.3.3          Weather Monitoring, Modeling & Forecasting Market Share……………………………………………………… 134

15      Wildfire Mitigation Market – 2022-2030……………………. 135

15.1     CEO Takeaway……………………………………………… 135

15.1.1          Summary………………………………………………… 135

15.1.2          Carbon Emissions…………………………………….. 136

15.2     Key Vendors………………………………………………….. 137

15.3     Global Wildfire Mitigation Market – 2020-2030………. 138

15.3.1          Wildfire Mitigation Market Size……………………… 138

15.3.2          Wildfire Mitigation Market Dynamics………………. 138

15.3.3          Wildfire Mitigation Market Share…………………… 138

REVENUE SOURCE MARKETS…………………………………….. 139

16      Extreme Weather Events Mitigation Market by Revenue Source – 2020-2030……………………………………………… 139

16.1     Global Market – 2020-2030………………………………. 139

16.2     Extreme Weather Events Mitigation Market Dynamics – 2020-2030…………………………………………………….. 140

16.3     Extreme Weather Events Mitigation Market Share – 2020-2030…………………………………………………….. 141

REGIONAL MARKETS…………………………………………………. 142

17      Regional Extreme Weather Events Mitigation Markets – 2020-2030…………………………………………………………… 142

17.1     Regional Markets – 2020-2030………………………….. 142

18      North America Extreme Weather Events Mitigation Market……………………………………………………………….. 143

18.1     North America Market CEO Takeaway………………… 143

18.2     North America Market – 2020-2030…………………….. 145

18.2.1          Market by Sector………………………………………. 145

18.2.2          Market by Revenue Source…………………………. 147

18.3     North America Extreme Weather Events Mitigation Market Dynamics – 2020-2030………………………….. 148

18.4     North America Market Share – 2020-2030……………. 148

19      Latin America Extreme Weather Events Mitigation Market 149

19.1     Latin America Market CEO Takeaway…………………. 149

19.2     Latin America Market – 2020-2030…………………….. 151

19.2.1          Market by Sector………………………………………. 151

19.2.2          Market by Revenue Source…………………………. 153

19.3     Latin America Extreme Weather Events Mitigation Market Dynamics – 2020-2030………………………….. 154

19.4     Latin America Market Share – 2020-2030…………….. 154

20      Europe Extreme Weather Events Mitigation Market….. 155

20.1     Europe Market CEO Takeaway………………………….. 155

20.2     Europe Market – 2020-2030……………………………… 157

20.2.1          Market by Sector………………………………………. 157

20.2.2          Market by Revenue Source…………………………. 159

20.3     Europe Extreme Weather Events Mitigation Market Dynamics – 2020-2030……………………………………. 160

20.4     Europe Market Share – 2020-2030…………………….. 160

21      Middle East & Africa Extreme Weather Events Mitigation Market……………………………………………………………….. 161

21.1     Africa Market CEO Takeaway……………………………. 161

21.2     The Middle East Market CEO Takeaway……………… 162

21.3     Middle East & Africa Market – 2020-2030…………….. 163

21.3.1          Market by Sector………………………………………. 163

21.3.2          Market by Revenue Source…………………………. 165

21.4     Middle East & Africa Extreme Weather Events Mitigation Market Dynamics – 2020-2030………………………….. 166

21.5     Middle East & Africa Market Share – 2020-2030……. 166

22      Asia Pacific Extreme Weather Events Mitigation Market 167

22.1     Asia Pacific Market CEO Takeaway……………………. 167

22.2     Asia Pacific Market – 2020-2030………………………… 170

22.2.1          Market by Sector………………………………………. 170

22.2.2          Market by Revenue Source…………………………. 172

22.3     Asia Pacific Extreme Weather Events Mitigation Market Dynamics – 2020-2030……………………………………. 173

22.4     Asia Pacific Market Share – 2020-2030……………….. 173

NATIONAL MARKETS…………………………………………………. 174

23      Extreme Weather Events Mitigation Market by Country – 2020-2030…………………………………………………………… 174

23.1     Energy Consumption Indicatiors………………………… 174

23.2     National Markets Size – 2020-2030…………………….. 178

23.3     National Markets Dynamics – 2020-2030…………….. 179

23.4     National Markets Shares – 2020-2030………………… 181

23.5     National Markets by Revenue Source – 2020-2030… 184

23.5.1          Infrastructure Markets………………………………… 184

23.5.2          Product Sales…………………………………………… 186

23.5.3          Maintenance Markets…………………………………. 187

23.5.4          Upgrades Markets…………………………………….. 189

23.5.5          Other* Revenue Sources……………………………. 191

North America……………………………………………………………. 193

24      U.S. Extreme Weather Events Mitigation Market – 2020-2030…………………………………………………………………… 193

24.1     U.S. Market CEO Takeaway……………………………… 193

24.1.1          Key Facts………………………………………………… 193

24.1.2          National Policy………………………………………….. 194

24.1.3          Energy Supply………………………………………….. 194

24.1.4          Energy Consumption…………………………………. 194

24.1.5          Electricity………………………………………………… 195

24.2     U.S. Extreme Weather Events Mitigation Market – 2020-2030……………………………………………………………. 195

24.3     U.S. Market Dynamics – 2020-2030……………………. 196

24.4     U.S. Market Share – 2020-2030…………………………. 196

25      Canada Extreme Weather Events Mitigation Market – 2020-2030…………………………………………………………… 197

25.1     Canada Market CEO Takeaway…………………………. 197

25.1.1          Key Facts………………………………………………… 197

25.1.2          National Policy………………………………………….. 197

25.1.3          Energy Supply………………………………………….. 198

25.1.4          Energy Consumption…………………………………. 198

25.1.5          Electricity………………………………………………… 199

25.2     Canada Extreme Weather Events Mitigation Market – 2020-2030…………………………………………………….. 199

25.3     Canada Market Dynamics – 2020-2030……………….. 199

25.4     Canada Market Share – 2020-2030……………………. 199

Latin America…………………………………………………………….. 201

26      Argentina Extreme Weather Events Mitigation Market – 2020-2030…………………………………………………………… 201

26.1     Argentina Market CEO Takeaway………………………. 201

26.1.1          Key Facts………………………………………………… 201

26.1.2          National Policy………………………………………….. 201

26.1.3          Energy Consumption…………………………………. 202

26.1.4          Electricity………………………………………………… 203

26.2     Argentina Extreme Weather Events Mitigation Market – 2020-2030…………………………………………………….. 203

26.3     Argentina Market Dynamics – 2020-2030…………….. 204

26.4     Argentina Market Share – 2020-2030………………….. 204

27      Brazil Extreme Weather Events Mitigation Market – 2020-2030…………………………………………………………………… 204

27.1     Brazil Market CEO Takeaway……………………………. 204

27.1.1          Key Facts………………………………………………… 204

27.1.2          National Policy………………………………………….. 204

27.1.3          Energy Supply………………………………………….. 206

27.1.4          Energy Consumption…………………………………. 206

27.1.5          Electricity………………………………………………… 206

27.2     Brazil Extreme Weather Events Mitigation Market – 2020-2030…………………………………………………….. 208

27.3     Brazil Market Dynamics – 2020-2030………………….. 208

27.4     Brazil Market Share – 2020-2030……………………….. 208

28      Chile Extreme Weather Events Mitigation Market – 2020-2030…………………………………………………………………… 209

28.1     Chile Market CEO Takeaway…………………………….. 209

28.1.1          Key Facts………………………………………………… 209

28.1.2          National Policy………………………………………….. 209

28.1.3          Energy Supply………………………………………….. 210

28.2     Chile Extreme Weather Events Mitigation Market – 2020-2030…………………………………………………….. 210

28.3     Chile Market Dynamics – 2020-2030…………………… 210

28.4     Chile Market Share – 2020-2030……………………….. 210

29      Colombia Extreme Weather Events Mitigation Market – 2020-2030…………………………………………………………… 212

29.1     Colombia Market CEO Takeaway………………………. 212

29.1.1          Key Facts………………………………………………… 212

29.1.2          National Policy………………………………………….. 212

29.1.3          Energy Consumption…………………………………. 212

29.1.4          Electricity………………………………………………… 213

29.2     Colombia Extreme Weather Events Mitigation Market – 2020-2030…………………………………………………….. 213

29.3     Colombia Market Dynamics – 2020-2030…………….. 214

29.4     Colombia Market Share – 2020-2030………………….. 214

30      Cuba Extreme Weather Events Mitigation Market – 2020-2030…………………………………………………………………… 215

30.1     Cuba Market CEO Takeaway……………………………. 215

30.2     Cuba Extreme Weather Events Mitigation Market – 2020-2030…………………………………………………….. 216

30.3     Cuba Market Dynamics – 2020-2030………………….. 216

30.4     Cuba Market Share – 2020-2030……………………….. 216

31      Ecuador Extreme Weather Events Mitigation Market – 2020-2030…………………………………………………………… 217

31.1     Ecuador Market CEO Takeaway………………………… 217

31.2     Ecuador Extreme Weather Events Mitigation Market – 2020-2030…………………………………………………….. 217

31.3     Ecuador Market Dynamics – 2020-2030………………. 217

31.4     Ecuador Market Share – 2020-2030……………………. 218

32      Mexico Extreme Weather Events Mitigation Market – 2020-2030…………………………………………………………… 219

32.1     Mexico Market CEO Takeaway………………………….. 219

32.1.1          Key Facts………………………………………………… 219

32.1.2          National Policy………………………………………….. 219

32.1.3          Electricity………………………………………………… 221

32.2     Mexico Extreme Weather Events Mitigation Market – 2020-2030…………………………………………………….. 221

32.3     Mexico Market Dynamics – 2020-2030………………… 221

32.4     Mexico Market Share – 2020-2030…………………….. 221

33      Peru Extreme Weather Events Mitigation Market – 2020-2030…………………………………………………………………… 223

33.1     Peru Market CEO Takeaway…………………………….. 223

33.2     Peru Extreme Weather Events Mitigation Market – 2020-2030……………………………………………………………. 224

33.3     Peru Market Dynamics – 2020-2030…………………… 224

33.4     Peru Market Share – 2020-2030………………………… 224

34      Puerto Rico Extreme Weather Events Mitigation Market – 2020-2030…………………………………………………………… 225

34.1     Puerto Rico Market CEO Takeaway……………………. 225

34.2     Puerto Rico Extreme Weather Events Mitigation Market – 2020-2030………………………………………………….. 226

34.3     Puerto Rico Market Dynamics – 2020-2030………….. 226

34.4     Puerto Rico Market Share – 2020-2030……………….. 226

35      Venezuela Extreme Weather Events Mitigation Market – 2020-2030…………………………………………………………… 227

35.1     Venezuela Market CEO Takeaway……………………… 227

35.2     Venezuela Extreme Weather Events Mitigation Market – 2020-2030…………………………………………………….. 228

35.3     Venezuela Market Dynamics – 2020-2030……………. 228

35.4     Venezuela Market Share – 2020-2030………………… 228

36      Rest of Latin America Extreme Weather Events Mitigation Market – 2020-2030………………………………………………. 229

36.1     Rest of Latin America Extreme Weather Events Mitigation Market – 2020-2030…………………………… 229

36.2     Rest of Latin America Market Dynamics – 2020-2030 229

36.3     Rest of Latin America Market Share – 2020-2030….. 229

Europe……………………………………………………………………… 230

37      Austria Extreme Weather Events Mitigation Market – 2020-2030…………………………………………………………… 230

37.1     Austria Market CEO Takeaway………………………….. 230

37.2     Austria Extreme Weather Events Mitigation Market – 2020-2030…………………………………………………….. 231

37.3     Austria Market Dynamics – 2020-2030………………… 231

37.4     Austria Market Share – 2020-2030……………………… 231

38      Belarus Extreme Weather Events Mitigation Market – 2020-2030…………………………………………………………… 232

38.1     Belarus Market CEO Takeaway…………………………. 232

38.2     Belarus Extreme Weather Events Mitigation Market – 2020-2030…………………………………………………….. 233

38.3     Belarus Market Dynamics – 2020-2030……………….. 233

38.4     Belarus Market Share – 2020-2030…………………….. 234

39      Belgium Extreme Weather Events Mitigation Market – 2020-2030…………………………………………………………… 234

39.1     Belgium Market CEO Takeaway………………………… 234

39.2     Belgium Extreme Weather Events Mitigation Market – 2020-2030…………………………………………………….. 235

39.3     Belgium Market Dynamics – 2020-2030………………. 236

39.4     Belgium Market Share – 2020-2030……………………. 236

40      Bulgaria Extreme Weather Events Mitigation Market – 2020-2030…………………………………………………………… 236

40.1     Bulgaria Market CEO Takeaway………………………… 236

40.2     Bulgaria Extreme Weather Events Mitigation Market – 2020-2030…………………………………………………….. 238

40.3     Bulgaria Market Dynamics – 2020-2030………………. 239

40.4     Bulgaria Market Share – 2020-2030……………………. 239

41      Czech Republic Extreme Weather Events Mitigation Market – 2020-2030………………………………………………. 240

41.1     Czech Republic Market CEO Takeaway………………. 240

41.2     Czech Republic Extreme Weather Events Mitigation Market – 2020-2030………………………………………… 241

41.3     Czech Republic Market Dynamics – 2020-2030…….. 241

41.4     Czech Republic Market Share – 2020-2030………….. 242

42      Denmark Extreme Weather Events Mitigation Market – 2020-2030…………………………………………………………… 242

42.1     Denmark Market CEO Takeaway……………………….. 242

42.2     Denmark Extreme Weather Events Mitigation Market – 2020-2030…………………………………………………….. 244

42.3     Denmark Market Dynamics – 2020-2030……………… 245

42.4     Denmark Market Share – 2020-2030………………….. 245

43      Finland Extreme Weather Events Mitigation Market – 2020-2030…………………………………………………………… 246

43.1     Finland Market CEO Takeaway…………………………. 246

43.2     Finland Extreme Weather Events Mitigation Market – 2020-2030…………………………………………………….. 247

43.3     Finland Market Dynamics – 2020-2030……………….. 247

43.4     Finland Market Share – 2020-2030…………………….. 248

44      France Extreme Weather Events Mitigation Market – 2020-2030…………………………………………………………… 248

44.1     France Market CEO Takeaway………………………….. 248

44.2     France Extreme Weather Events Mitigation Market – 2020-2030…………………………………………………….. 250

44.3     France Market Dynamics – 2020-2030………………… 250

44.4     France Market Share – 2020-2030……………………… 250

45      Germany Extreme Weather Events Mitigation Market – 2020-2030…………………………………………………………… 252

45.1     Germany Extreme Weather Events Mitigation Market – 2020-2030…………………………………………………….. 256

45.2     Germany Market Dynamics – 2020-2030……………… 256

45.3     Germany Market Share – 2020-2030………………….. 256

46      Greece Extreme Weather Events Mitigation Market – 2020-2030…………………………………………………………… 258

46.1     Greece Market CEO Takeaway…………………………. 258

46.2     Greece Extreme Weather Events Mitigation Market – 2020-2030…………………………………………………….. 259

46.3     Greece Market Dynamics – 2020-2030……………….. 259

46.4     Greece Market Share – 2020-2030…………………….. 259

47      Hungary Extreme Weather Events Mitigation Market – 2020-2030…………………………………………………………… 260

47.1     Hungary Market CEO Takeaway………………………… 260

47.2     Hungary Extreme Weather Events Mitigation Market – 2020-2030…………………………………………………….. 261

47.3     Hungary Market Dynamics – 2020-2030………………. 261

47.4     Hungary Market Share – 2020-2030…………………… 262

48      Italy Extreme Weather Events Mitigation Market – 2020-2030…………………………………………………………………… 262

48.1     Italy Market CEO Takeaway……………………………… 262

48.2     Italy Extreme Weather Events Mitigation Market – 2020-2030……………………………………………………………. 265

48.3     Italy Market Dynamics – 2020-2030……………………. 265

48.4     Italy Market Share – 2020-2030…………………………. 265

49      Netherlands Extreme Weather Events Mitigation Market – 2020-2030…………………………………………………………… 266

49.1     Netherlands Market CEO Takeaway…………………… 266

49.2     Netherlands Extreme Weather Events Mitigation Market – 2020-2030………………………………………………….. 267

49.3     Netherlands Market Dynamics – 2020-2030…………. 267

49.4     Netherlands Market Share – 2020-2030………………. 268

50      Norway Extreme Weather Events Mitigation Market – 2020-2030…………………………………………………………… 269

50.1     Norway Market CEO Takeaway…………………………. 269

50.2     Norway Extreme Weather Events Mitigation Market – 2020-2030…………………………………………………….. 270

50.3     Norway Market Dynamics – 2020-2030……………….. 270

50.4     Norway Market Share – 2020-2030…………………….. 271

51      Poland Extreme Weather Events Mitigation Market – 2020-2030…………………………………………………………… 271

51.1     Poland Market CEO Takeaway………………………….. 271

51.2     Poland Extreme Weather Events Mitigation Market – 2020-2030…………………………………………………….. 273

51.3     Poland Market Dynamics – 2020-2030………………… 273

51.4     Poland Market Share – 2020-2030……………………… 273

52      Portugal Extreme Weather Events Mitigation Market – 2020-2030…………………………………………………………… 274

52.1     Portugal Market CEO Takeaway………………………… 274

52.2     Portugal Extreme Weather Events Mitigation Market – 2020-2030…………………………………………………….. 275

52.3     Portugal Market Dynamics – 2020-2030………………. 275

52.4     Portugal Market Share – 2020-2030……………………. 275

53      Romania Extreme Weather Events Mitigation Market – 2020-2030…………………………………………………………… 277

53.1     Romania Market CEO Takeaway……………………….. 277

53.2     Romania Extreme Weather Events Mitigation Market – 2020-2030…………………………………………………….. 278

53.3     Romania Market Dynamics – 2020-2030……………… 278

53.4     Romania Market Share – 2020-2030…………………… 278

54      Russia Extreme Weather Events Mitigation Market – 2020-2030…………………………………………………………… 280

54.1     Russia Market CEO Takeaway………………………….. 280

54.2     Russia Extreme Weather Events Mitigation Market – 2020-2030…………………………………………………….. 282

54.3     Russia Market Dynamics – 2020-2030………………… 282

54.4     Russia Market Share – 2020-2030……………………… 282

55      Serbia Extreme Weather Events Mitigation Market – 2020-2030…………………………………………………………………… 284

55.1     Serbia Market CEO Takeaway…………………………… 284

55.2     Serbia Extreme Weather Events Mitigation Market – 2020-2030…………………………………………………….. 285

55.3     Serbia Market Dynamics – 2020-2030…………………. 285

55.4     Serbia Market Share – 2020-2030……………………… 285

56      Slovakia Extreme Weather Events Mitigation Market – 2020-2030…………………………………………………………… 286

56.1     Slovakia Market CEO Takeaway………………………… 286

56.2     Slovakia Extreme Weather Events Mitigation Market – 2020-2030…………………………………………………….. 287

56.3     Slovakia Market Dynamics – 2020-2030………………. 287

56.4     Slovakia Market Share – 2020-2030…………………… 287

57      Spain Extreme Weather Events Mitigation Market – 2020-2030…………………………………………………………………… 288

57.1     Spain Market CEO Takeaway……………………………. 288

57.2     Spain Extreme Weather Events Mitigation Market – 2020-2030…………………………………………………….. 290

57.3     Spain Market Dynamics – 2020-2030………………….. 290

57.4     Spain Market Share – 2020-2030………………………. 290

58      Sweden Extreme Weather Events Mitigation Market – 2020-2030…………………………………………………………… 291

58.1     Sweden Market CEO Takeaway………………………… 291

58.2     Sweden Extreme Weather Events Mitigation Market – 2020-2030…………………………………………………….. 293

58.3     Sweden Market Dynamics – 2020-2030………………. 293

58.4     Sweden Market Share – 2020-2030……………………. 293

59      Switzerland Extreme Weather Events Mitigation Market – 2020-2030…………………………………………………………… 295

59.1     Switzerland Market CEO Takeaway……………………. 295

59.2     Switzerland Extreme Weather Events Mitigation Market – 2020-2030………………………………………………….. 296

59.3     Switzerland Market Dynamics – 2020-2030………….. 296

59.4     Switzerland Market Share – 2020-2030……………….. 296

60      UK Extreme Weather Events Mitigation Market – 2020-2030…………………………………………………………………… 297

60.1     UK Market CEO Takeaway……………………………….. 297

60.2     UK Extreme Weather Events Mitigation Market – 2020-2030……………………………………………………………. 299

60.3     UK Market Dynamics – 2020-2030……………………… 299

60.4     UK Market Share – 2020-2030………………………….. 300

61      Ukraine Extreme Weather Events Mitigation Market – 2020-2030…………………………………………………………… 301

61.1     Ukraine Market CEO Takeaway…………………………. 301

61.2     Ukraine Extreme Weather Events Mitigation Market – 2020-2030…………………………………………………….. 302

61.3     Ukraine Market Dynamics – 2020-2030……………….. 302

61.4     Ukraine Market Share – 2020-2030…………………….. 302

62      Rest of Europe Extreme Weather Events Mitigation Market – 2020-2030………………………………………………. 304

62.1     Rest of Europe Extreme Weather Events Mitigation Market – 2020-2030………………………………………… 304

62.2     Rest of Europe Market Dynamics – 2020-2030……… 304

62.3     Rest of Europe Market Share – 2020-2030…………… 304

Middle East & Africa……………………………………………………. 305

63      Algeria Extreme Weather Events Mitigation Market – 2020-2030…………………………………………………………… 305

63.1     Algeria Market CEO Takeaway………………………….. 305

63.2     Algeria Extreme Weather Events Mitigation Market – 2020-2030…………………………………………………….. 305

63.3     Algeria Market Dynamics – 2020-2030………………… 306

63.4     Algeria Market Share – 2020-2030……………………… 306

64      Egypt Extreme Weather Events Mitigation Market – 2020-2030…………………………………………………………………… 307

64.1     Egypt Market CEO Takeaway……………………………. 307

64.2     Egypt Extreme Weather Events Mitigation Market – 2020-2030…………………………………………………….. 308

64.3     Egypt Market Dynamics – 2020-2030………………….. 308

64.4     Egypt Market Share – 2020-2030………………………. 308

65      Iran Extreme Weather Events Mitigation Market – 2020-2030…………………………………………………………………… 310

65.1     Iran Market CEO Takeaway………………………………. 310

65.2     Iran Extreme Weather Events Mitigation Market – 2020-2030……………………………………………………………. 311

65.3     Iran Market Dynamics – 2020-2030…………………….. 311

65.4     Iran Market Share – 2020-2030…………………………. 311

66      Israel Extreme Weather Events Mitigation Market – 2020-2030…………………………………………………………………… 313

66.1     Israel Market CEO Takeaway……………………………. 313

66.2     Israel Extreme Weather Events Mitigation Market – 2020-2030…………………………………………………….. 315

66.3     Israel Market Dynamics – 2020-2030………………….. 315

66.4     Israel Market Share – 2020-2030……………………….. 315

67      Kuwait Extreme Weather Events Mitigation Market – 2020-2030…………………………………………………………… 316

67.1     Kuwait Market CEO Takeaway………………………….. 316

67.2     Kuwait Extreme Weather Events Mitigation Market – 2020-2030…………………………………………………….. 317

67.3     Kuwait Market Dynamics – 2020-2030………………… 317

67.4     Kuwait Market Share – 2020-2030……………………… 317

68      Saudi Arabia Extreme Weather Events Mitigation Market – 2020-2030………………………………………………………… 318

68.1     Saudi Arabia Extreme Weather Events Mitigation Market – 2020-2030………………………………………………….. 319

68.2     Saudi Arabia Market Dynamics – 2020-2030………… 319

68.3     Saudi Arabia Market Share – 2020-2030……………… 319

69      South Africa Extreme Weather Events Mitigation Market – 2020-2030…………………………………………………………… 321

69.1     South Africa Market CEO Takeaway…………………… 321

69.2     South Africa Extreme Weather Events Mitigation Market – 2020-2030………………………………………………….. 322

69.3     South Africa Market Dynamics – 2020-2030…………. 322

69.4     South Africa Market Share – 2020-2030………………. 322

70      Turkey Extreme Weather Events Mitigation Market – 2020-2030…………………………………………………………… 324

70.1     Turkey Market CEO Takeaway………………………….. 324

70.2     Turkey Extreme Weather Events Mitigation Market – 2020-2030…………………………………………………….. 326

70.3     Turkey Market Dynamics – 2020-2030………………… 326

70.4     Turkey Market Share – 2020-2030……………………… 326

71      UAE Extreme Weather Events Mitigation Market – 2020-2030…………………………………………………………………… 327

71.1     UAE Market CEO Takeaway…………………………….. 327

71.2     UAE Extreme Weather Events Mitigation Market – 2020-2030……………………………………………………………. 328

71.3     UAE Market Dynamics – 2020-2030…………………… 328

71.4     UAE Market Share – 2020-2030………………………… 328

72      Rest of MEA Extreme Weather Events Mitigation Market – 2020-2030…………………………………………………………… 329

72.1     Rest of MEA Extreme Weather Events Mitigation Market – 2020-2030………………………………………………….. 329

72.2     Rest of MEA Market Dynamics – 2020-2030…………. 329

72.3     Rest of MEA Market Share – 2020-2030……………… 329

73      Australia Extreme Weather Events Mitigation Market – 2020-2030…………………………………………………………… 331

73.1     Australia Market CEO Takeaway……………………….. 331

73.2     Australia Extreme Weather Events Mitigation Market – 2020-2030…………………………………………………….. 332

73.3     Australia Market Dynamics – 2020-2030……………… 332

73.4     Australia Market Share – 2020-2030…………………… 332

74      China Extreme Weather Events Mitigation Market – 2020-2030…………………………………………………………………… 333

74.1     China Market CEO Takeaway……………………………. 333

74.2     China Extreme Weather Events Mitigation Market – 2020-2030…………………………………………………….. 334

74.3     China Market Dynamics – 2020-2030………………….. 334

74.4     China Market Share – 2020-2030………………………. 334

75      India Extreme Weather Events Mitigation Market – 2020-2030…………………………………………………………………… 335

75.1     India Market CEO Takeaway…………………………….. 335

75.2     India Extreme Weather Events Mitigation Market – 2020-2030……………………………………………………………. 336

75.3     India Market Dynamics – 2020-2030…………………… 336

75.4     India Market Share – 2020-2030………………………… 336

76      Indonesia Extreme Weather Events Mitigation Market – 2020-2030…………………………………………………………… 337

76.1     Indonesia Market CEO Takeaway………………………. 337

76.2     Indonesia Extreme Weather Events Mitigation Market – 2020-2030…………………………………………………….. 338

76.3     Indonesia Market Dynamics – 2020-2030…………….. 338

76.4     Indonesia Market Share – 2020-2030………………….. 338

77      Japan Extreme Weather Events Mitigation Market – 2020-2030…………………………………………………………………… 339

77.1     Japan Market CEO Takeaway…………………………… 339

77.2     Japan Extreme Weather Events Mitigation Market – 2020-2030…………………………………………………….. 340

77.3     Japan Market Dynamics – 2020-2030…………………. 340

77.4     Japan Market Share – 2020-2030………………………. 340

78      Kazakhstan Extreme Weather Events Mitigation Market – 2020-2030…………………………………………………………… 341

78.1     Kazakhstan Market CEO Takeaway……………………. 341

78.2     Kazakhstan Extreme Weather Events Mitigation Market – 2020-2030………………………………………………….. 342

78.3     Kazakhstan Market Dynamics – 2020-2030………….. 342

78.4     Kazakhstan Market Share – 2020-2030……………….. 342

79      Philippines Extreme Weather Events Mitigation Market – 2020-2030…………………………………………………………… 343

79.1     Philippines Market CEO Takeaway…………………….. 343

79.2     Philippines Extreme Weather Events Mitigation Market – 2020-2030…………………………………………………….. 344

79.3     Philippines Market Dynamics – 2020-2030…………… 344

79.4     Philippines Market Share – 2020-2030………………… 344

80      South Korea Extreme Weather Events Mitigation Market – 2020-2030…………………………………………………………… 345

80.1     South Korea Market CEO Takeaway…………………… 345

80.2     South Korea Extreme Weather Events Mitigation Market – 2020-2030………………………………………………….. 346

80.3     South Korea Market Dynamics – 2020-2030…………. 346

80.4     South Korea Market Share – 2020-2030……………… 346

81      Thailand Extreme Weather Events Mitigation Market – 2020-2030…………………………………………………………… 347

81.1     Thailand Market CEO Takeaway……………………….. 347

81.2     Thailand Extreme Weather Events Mitigation Market – 2020-2030…………………………………………………….. 348

81.3     Thailand Market Dynamics – 2020-2030……………… 348

81.4     Thailand Market Share – 2020-2030…………………… 348

82      Vietnam Extreme Weather Events Mitigation Market – 2020-2030…………………………………………………………… 349

82.1     Vietnam Market CEO Takeaway………………………… 349

82.2     Vietnam Extreme Weather Events Mitigation Market – 2020-2030…………………………………………………….. 350

82.3     Vietnam Market Dynamics – 2020-2030………………. 350

82.4     Vietnam Market Share – 2020-2030……………………. 350

83      Rest of Asia-Pacific Extreme Weather Events Mitigation Market – 2020-2030………………………………………………. 351

83.1     Rest of Asia-Pacific Extreme Weather Events Mitigation Market – 2020-2030………………………………………… 351

83.2     Rest of Asia-Pacific Market Dynamics – 2020-2030.. 351

83.3     Rest of Asia-Pacific Market Share – 2020-2030…….. 351

VENDORS…………………………………………………………………. 352

84      Company 1…………………………………………………………. 352

85      Company 2…………………………………………………………. 352

86      Company 3…………………………………………………………. 353

87      Company 4…………………………………………………………. 353

88      Company 5…………………………………………………………. 354

89      Company 6…………………………………………………………. 354

90      Company 7…………………………………………………………. 355

91      Company 8…………………………………………………………. 355

92      Company 9…………………………………………………………. 356

93      Company 10……………………………………………………….. 356

94      Company 11……………………………………………………….. 357

95      Company 12……………………………………………………….. 357

APPENDICES…………………………………………………………….. 358

96      Appendix A: Glossary………………………………………….. 358

97      Appendix B: Abbreviations…………………………………… 376

98      Research Methodology………………………………………… 381

98.1     Report Structure…………………………………………….. 381

98.2     Methodology………………………………………………….. 381

98.3     For Whom is this Report?…………………………………. 382

99      Disclaimer and Copyright……………………………………… 383


Tables

Table 1 – Electricity Production by Country – 2020……………………….. 40

Table 2 – Energy & Electricity and Per Capita Consumption by Country / Region……………………………………………………………… 41

Table 3 – Renewable vs. Fossil Fuels Heating Efficiency Cost [$ Cent / KWh] – 2020 & 2030 F…………………………………………. 49

Table 4 – Global Extreme Weather Events Mitigation Market by Technology [$B] – 2022-2030………………………………… 54

Table 5 – Global Extreme Weather Events Mitigation Market by Revenue [$B] – 2020-2030……………………………………. 56

Table 6 – Global Extreme Weather Events Mitigation Market by Region [$B] – 2022-2030………………………………………………… 56

Table 7 – Global Extreme Weather Events Mitigation Market by Country [$B] – 2020-2030………………………………………………… 58

Table 8 – Global Extreme Weather Events Mitigation Technology Products & Services [$B] Markets – 2022-2030…………. 81

Table 9 – Global Extreme Weather Events Mitigation Markets Annual Growth Rates [%] – 2022-2030………………………………. 82

Table 10 – Global Extreme Weather Events Mitigation Products & Services Markets Shares [%] – 2022-2030……………….. 84

Table 11 – Global Climate Adapted Water Infrastructure Market Size [$B] – 2022-2030……………………………………………….. 103

Table 12 – Global Climate Adapted Water Infrastructure Market Dynamics [%] – 2022-2030………………………………….. 103

Table 13 – Global Extreme Weather Events Mitigation Market, Climate Adapted Water Infrastructure Market Share [%] – 2022-2030………………………………………………………………. 104

Table 14 – Global Extreme Weather Public Warning Systems Market Size [$B] – 2022-2030………………………………………… 113

Table 15 – Global Extreme Weather Public Warning Systems Market Dynamics [%] – 2022-2030………………………………….. 114

Table 16 – Global Extreme Weather Events Mitigation Market, Extreme Weather Public Warning Systems Market Share [%] – 2022-2030……………………………………………………….. 114

Table 17 – Global Floods Control Market Size [$B] – 2022-2030……. 120

Table 18 – Global Floods Control Market Dynamics [%] – 2022-2030 121

Table 19 – Global Extreme Weather Events Mitigation Market, Floods Control Market Share [%] – 2022-2030…………………… 121

Table 20 – Global GHG Emission Tracking Market Size [$B] – 2022-2030………………………………………………………………. 128

Table 21 – Global GHG Emission Tracking Market Dynamics [%] – 2022-2030……………………………………………………….. 129

Table 22 – Global Extreme Weather Events Mitigation Market, GHG Emission Tracking Market Share [%] – 2022-2030…….. 129

Table 23 – Global Weather Monitoring, Modeling & Forecasting Market Size [$B] – 2022-2030………………………………………… 133

Table 24 – Global Weather Monitoring, Modeling & Forecasting Market Dynamics [%] – 2022-2030………………………………….. 134

Table 25 – Global Extreme Weather Events Mitigation Market, Weather Monitoring, Modeling & Forecasting Market Share [%] – 2022-2030……………………………………………………….. 134

Table 26 – Global Wildfire Mitigation Market Size [$B] – 2022-2030.. 138

Table 27 – Global Wildfire Mitigation Market Dynamics [%] – 2022-2030                                                                                  138

Table 28 – Global Extreme Weather Events Mitigation Market, Wildfire Mitigation Market Share [%] – 2022-2030………………… 138

Table 29 – Extreme Weather Events Mitigation Market Size [$M] by Revenue Source – 2020-2030……………………………… 139

Table 30- Extreme Weather Events Mitigation Market AGRs [%] by Revenue Source – 2020-2030……………………………… 140

Table 31 – Extreme Weather Events Mitigation Market by Region [$B] – 2022-2030……………………………………………………….. 142

Table 32 – North America Extreme Weather Events Mitigation Market Size [$M] by Sector – 2020-2030………………………….. 145

Table 33 – North America Extreme Weather Events Mitigation Market Size [$M] by Revenue Source – 2020-2030…………….. 147

Table 34 – North America Extreme Weather Events Mitigation Market AGRs [%] by Revenue Source – 2020-2030……………. 148

Table 35 – Latin America Extreme Weather Events Mitigation Market Size [$M] by Sector – 2020-2030………………………….. 151

Table 36 – Latin America Extreme Weather Events Mitigation Market Size [$M] by Revenue Source – 2020-2030…………….. 153

Table 37 – Latin America Extreme Weather Events Mitigation Market AGRs [%] by Revenue Source – 2020-2030……………. 154

Table 38 – Europe Extreme Weather Events Mitigation Market Size [$M] by Sector – 2020-2030……………………………………….. 157

Table 39 – Europe Extreme Weather Events Mitigation Market Size [$M] by Revenue Source – 2020-2030………………………….. 159

Table 40 – Europe Extreme Weather Events Mitigation Market AGRs [%] by Revenue Source – 2020-2030………………………… 160

Table 41 – Middle East & Africa Extreme Weather Events Mitigation Market Size [$M] by Sector – 2020-2030………………… 163

Table 42 – Middle East & Africa Extreme Weather Events Mitigation Market Size [$M] by Revenue Source – 2020-2030…… 165

Table 43 – Middle East & Africa Extreme Weather Events Mitigation Market AGRs [%] by Revenue Source – 2020-2030….. 166

Table 44 – Asia Pacific Extreme Weather Events Mitigation Market Size [$M] by Sector – 2020-2030………………………………… 170

Table 45 – Asia Pacific Extreme Weather Events Mitigation Market Size [$M] by Revenue Source – 2020-2030…………………… 172

Table 46 – Asia Pacific Extreme Weather Events Mitigation Market AGRs [%] by Revenue Source – 2020-2030……………. 173

Table 47 – Extreme Weather Events Mitigation Technologies Market Size [$B] By Country – 2020-2030………………………… 178

Table 48 – Extreme Weather Events Mitigation Market AGRs [%] By Country – 2020-2030…………………………………………. 179

Table 49 – National Market Shares of the Extreme Weather Events Mitigation Market [%] – 2020-2030………………………… 181

Table 50 – Extreme Weather Events Mitigation Infrastructure Markets Size [$B] By Country – 2020-2030………………………… 184

Table 51 – Extreme Weather Events Mitigation Products Sales [$B] By Country – 2020-2030…………………………………………. 186

Table 52 – Extreme Weather Events Mitigation Maintenance Markets Size [$B] By Country – 2020-2030………………………… 187

Table 53 – Extreme Weather Events Mitigation Upgrades Markets Size [$B] By Country – 2020-2030……………………………….. 189

Table 54 – Extreme Weather Events Mitigation Other* Revenue Sources [$B] By Country – 2020-2030……………………………….. 191

Table 55 – Renewable Energy and Climate Targets in the United States.                                                                                  194

Figures

Figure 1 – COP26 Pledges & Targets Based GHG Emission [GTn] Forecast to 2030………………………………………………… 31

Figure 2 – Global Warming 2010-2020 by GHG Source…………………. 32

Figure 3 – Renewable Energy Generation By Technology & By User.. 34

Figure 4 – Greenhouse Gas Emissions [%] by Sector……………………. 35

Figure 5 – Climate Change Causes and Effects…………………………… 36

Figure 6- Global Energy demand (left) & GHS Emission (Right) By Sector – 2020…………………………………………………….. 37

Figure 7 – GHG Emission per GWh of Energy Production – 2020…….. 38

Figure 8 – Average USA Levelized cost [$/MWh] of Electricity By Energy Technology – 2020……………………………………. 38

Figure 9 – Renewable Electricity Generation by Technology and Region                                                                                    39

Figure 10 – Global Electricity Consumption by Energy Source – 1985-2020………………………………………………………………… 39

Figure 11 – Levelized Cost [$/MWh] of Energy, by Source – 2008-2020                                                                                    39

Figure 12 – Renewable, Nuclear & Fossil Energy Prices [$/MWh] & Installed Capacity – 2010-2019……………………………… 40

Figure 13 – Global Warming vs. Number of Climate-Related Disasters – 1970-2032…………………………………………………………. 42

Figure 14 – Energy Storage: Duration Time and Rated Power by Modality……………………………………………………………. 42

Figure 15 – Renewable Generation Capacity By Region………………… 43

Figure 16 – Leading Renewable Energy Capacity [GW] by Country – 2020………………………………………………………………… 43

Figure 17 – Negative Emissions Role in Achieving NetZero……………. 43

Figure 18 – Global GHG Emission Reduction [%] by Technology – 2030                                                                                    48

Figure 19 – Global Electricity Generation [000 TWh] by Source – 2010- 2040………………………………………………………………… 50

Figure 20 – Global Extreme Weather Events Mitigation Market by Region [$B] – 2022-2030……………………………………… 58

Figure 21 – Global Water Stress Map………………………………………… 88

Figure 22 – Global Water Extraction and Consumption by End User– 1900-2025…………………………………………………………. 90

Figure 23 – Water Supply Adaptation Strategy…………………………….. 91

Figure 24 – Potential Drought Adaptation Measures……………………… 93

Figure 25 –Global Urban Population Facing Water Scarcity 2019-2050                                                                                    94

Figure 26 – Climate Change Impact on Water Supply……………………. 95

Figure 27 – Adapting Water Management to Climate Change…………. 96

Figure 28 – Metrices for Decision Making  …………………………………. 97

Figure 29 – Global Climate Adapted Water Infrastructure Market Size [$B] – 2022-2030……………………………………………….. 104

Figure 30 – Sweden Public Alarm Infrastructure Evolution……………. 106

Figure 31 – The UN Risk Based Public Warning Evolution -1960-2020                                                                                  107

Figure 32 – Public Warning System Architecture………………………… 108

Figure 33 – The Israeli Public (Location Based) Alarm System Poster                                                                                  109

Figure 34 – Mobile Alarm System……………………………………………. 111

Figure 35 – Cell Broadcast…………………………………………………….. 112

Figure 36 – Geo Fenced Alarm System……………………………………. 113

Figure 37 – Fixed WIFI Alarm System……………………………………… 114

Figure 38 – Global Extreme Weather Public Warning Systems Market Size [$B] – 2022-2030………………………………………… 114

Figure 39 – An Integrated Flood Protection……………………………….. 116

Figure 40 – Storm Surge Flooding…………………………………………… 117

Figure 41 – Provisional Flood Barriers……………………………………… 118

Figure 42 – Tidal Flood Barrier……………………………………………….. 119

Figure 43 – Global Floods Control Market Size [$B] – 2022-2030…… 121

Figure 44 – Greenhouse Gas Emissions [%] By Sector……………….. 123

Figure 45 – GHG Emission Tracking Technologies……………………… 124

Figure 46 – CO2 Emissions [GTn] by Geography – 1960-2020……… 126

Figure 47 – MethaneSAT Performance……………………………………. 128

Figure 48 – Methane Surveillance Technologies. Frequency-Range vs. Resolution……………………………………………………….. 128

Figure 49 – Global GHG Emission Tracking Market Size [$B] – 2022-2030………………………………………………………………. 129

Figure 50 – Global Weather Monitoring, Modeling & Forecasting Market Size [$B] – 2022-2030………………………………………… 134

Figure 51 – The U.S. Wildfires Facts……………………………………….. 137

Figure 52 – Global Wildfire Mitigation Market Size [$B] – 2022-2030. 139

Figure 53 – Extreme Weather Events Mitigation Market Size [$M] by Revenue Source – 2020-2030……………………………… 141

Figure 54 – Extreme Weather Events Mitigation Market Share [%] by Revenue Source – 2020-2030……………………………… 142

Figure 55 – Extreme Weather Events Mitigation Market by Region [$B] – 2022-2030……………………………………………………….. 143

Figure 56 – North America Final Energy Demand by Sector [EJ]……. 144

Figure 57 – North America Primary Energy Consumption by Sector [EJ]                                                                                  145

Figure 58 – Cumulative 2022-2030 North America Extreme Weather Events Mitigation Market by Sector [$B]…………………. 147

Figure 59 – North America Extreme Weather Events Mitigation Market Size [$M] by Revenue Source – 2020-2030…………….. 148

Figure 60 – North America Extreme Weather Events Mitigation Market Share [%] by Revenue Source – 2020-2030……………. 149

Figure 61 – Latin America Final Energy Demand by Sector [EJ]…….. 150

Figure 62 – Latin America Primary Energy Consumption by Sector [EJ]                                                                                  152

Figure 63 – Cumulative 2022-2030 Latin America Extreme Weather Events Mitigation Market by Sector [$B]…………………. 153

Figure 64 – Latin America Extreme Weather Events Mitigation Market Size [$M] by Revenue Source – 2020-2030…………….. 154

Figure 65 – Latin America Extreme Weather Events Mitigation Market Share [%] by Revenue Source – 2020-2030……………. 155

Figure 66 – Europe Final Energy Demand by Sector [EJ]……………… 156

Figure 67 – Europe Primary Energy Consumption by Sector [EJ]…… 157

Figure 68 – Cumulative 2022-2030 Europe Extreme Weather Events Mitigation Market by Sector [$B]…………………………… 159

Figure 69 – Europe Extreme Weather Events Mitigation Market Size [$M] by Revenue Source – 2020-2030…………………… 160

Figure 70 – Europe Extreme Weather Events Mitigation Market Share [%] by Revenue Source – 2020-2030…………………….. 161

Figure 71 – MEA Final Energy Demand by Sector [EJ]………………… 162

Figure 72 – MEA Primary Energy Consumption by Sector [EJ]………. 163

Figure 73 – Cumulative 2022-2030 Global Middle East & Africa Change Mitigation & Adaptation Market by Sector [$B]…………. 165

Figure 74 – Middle East & Africa Extreme Weather Events Mitigation Market Size [$M] by Revenue Source – 2020-2030…… 166

Figure 75 – Middle East & Africa Extreme Weather Events Mitigation Market Share [%] by Revenue Source – 2020-2030….. 167

Figure 76 – Australia, New Zealand, Japan and South Korea Final Energy Demand by Sector [EJ]…………………………….. 168

Figure 77 – Australia, New Zealand, Japan and South Korea Primary Energy Consumption by Sector [EJ]………………………. 170

Figure 78 – Cumulative 2022-2030 Asia Pacific Extreme Weather Events Mitigation Market by Sector [$B]…………………. 172

Figure 79 – Asia Pacific Extreme Weather Events Mitigation Market Size [$M] by Revenue Source – 2020-2030…………………… 173

Figure 80 – Asia Pacific Extreme Weather Events Mitigation Market Share [%] by Revenue Source – 2020-2030……………. 174

Figure 81 – Energy Use Per Person, 2019………………………………… 175

Figure 82 – Consumption-Based Energy Use Per Person: Global Map, 2020………………………………………………………………. 176

Figure 83 – Consumption-Based Energy Use Per Person: Selected Countries………………………………………………………… 176

Figure 84 – Primary Energy Consumption by World Region – 1965-2020                                                                                  177

Figure 85 – World Energy Trilemma Index: Leading Countries – 2021 178

Figure 86 – Extreme Weather Events Mitigation Market Share by Country – 2030…………………………………………………. 184

Figure 87 – U.S. Electricity Generation by Major Energy Source, 1950-2020………………………………………………………………. 196

Figure 88 – Canada Electricity Generation by Energy Source [%], 2018                                                                                  200

Figure 89 – Energy Consumption by Source, Argentina……………….. 203

Figure 90 – Electricity Generation In Argentina In 2020, By Type Of Fuel* (In Terawatt Hours)……………………………………. 204

Figure 91 – Brazil Power Generation Supply, 2020…………………….. 207

Figure 92 – Total Energy Supply (TES) by Source, Chile 1990-2020. 211

Figure 93 – Consumption Trends by Energy Source (Mtoe)………….. 214

Figure 94 – Total Energy Supply (TES) by Source, Cuba 1990-2020. 216

Figure 95 – Ecuador Power Generation, 2020……………………………. 218

Figure 96 – Mexico Electricity Generation by Technology (October 2020)                                                                                  222

Figure 97 – Distribution of Electricity Generation in Peru in 2020, By Source……………………………………………………………. 224

Figure 98 – Venezuela: Installed and Available Generating Capacity and Supply, 2000–2020……………………………………………. 228

Figure 99 – Total Energy Supply (TES) by Source, Austria 1990-2020                                                                                  231

Figure 100 – Consumption Trends by Energy Source in Belarus (Mtoe)                                                                                  233

Figure 101 – Total Energy Supply (TES) by Source, Belgium 1990-2019                                                                                  236

Figure 102 – Bulgaria Installed Energy Capacity………………………… 238

Figure 103 – Total Energy Supply (TES) by Source, Czech Republic 1990-2019……………………………………………………….. 241

Figure 104 – Total Energy Supply (TES) by Source, Denmark 1990-2019………………………………………………………………. 243

Figure 105 – Electricity Generation by Energy Source, Finland, 2000-2019………………………………………………………………. 247

Figure 106 – France Total Energy Supply (TES) by Source 1990-2019                                                                                  250

Figure 107 -The German Renewable Energy Use & Reduced Energy Consumption Scenario – 2005-2050………………………. 254

Figure 108 – Germany Electricity Generation per Week 22 – 2021 by Energy Generation Mode……………………………………. 255

Figure 109 – Sources of Large-Scale Energy Capacity [MW] Installed in Greece as of June 2020……………………………………… 259

Figure 110 – Total Energy Supply (TES) by Source, Hungary 1990-2019                                                                                  261

Figure 111 – Total Energy Supply (TES) by Source, Italy 1990-2019. 264

Figure 112 – Distribution of Electricity Generation in the Netherlands in 2020, By Source……………………………………………….. 267

Figure 113 – National Electricity Generation by Energy Source, Norway, in 2019……………………………………………………………. 270

Figure 114 – Total Energy Supply (TES) by Source, Poland 1990-2019                                                                                  272

Figure 115 – Total Energy Supply (TES) by Source, Portugal 1990-2019                                                                                  275

Figure 116 – Romania Consumption Trends by Energy Source (Mtoe)                                                                                  278

Figure 117 – Russia Consumption Trends by Energy Source (Mtoe). 281

Figure 118 – Serbian Energy Distribution, 2019…………………………. 285

Figure 119 – Total Energy Supply (TES) by Source, Slovak Republic 1990-2020……………………………………………………….. 287

Figure 120 – Total Energy Supply (TES) by Source, Spain 1990-2020                                                                                  289

Figure 121 – Sweden Energy Consumption, 1800-2020………………. 292

Figure 122 – Total Energy Supply (TES) by Source, Switzerland 1990-2020………………………………………………………………. 296

Figure 123 – The UK Inland Energy Consumption, 1990 and 2020 by Energy Source………………………………………………….. 298

Figure 124 – The UK Electricity Generation, 1990 and 2020 by Energy Source……………………………………………………………. 299

Figure 125 – Solar PV Installed by Quarter in UK……………………….. 300

Figure 126 – Consumption Trends by Energy Source in Ukraine (Mtoe)                                                                                  302

Figure 127 – Installed Energy Capacity of Algeria, 2019 vs. Projected 2028………………………………………………………………. 306

Figure 128 – Consumption Trends by Energy Source (Mtoe)………… 308

Figure 129 – Iran’s Electricity Generation by Fuel, 2019………………. 311

Figure 130 – Consumption Trends by Energy Source in Israel (Mtoe)                                                                                  314

Figure 131 – Total Energy Supply (TES) by Source, Saudi Arabia, 1990-2019………………………………………………………………. 319

Figure 132 – South Africa Electricity Consumption Breakdown by Sector (2020, %)………………………………………………………… 322

Figure 133 – Electricity Generation in Turkey from 2019 to 2020, by Fuel                                                                                  325

Questions about this report?

Contact Sales: 1-571-527-1010 or Analysts: 1-202-455-0966

  • Have a question about Extreme Weather Events Mitigation Technologies & Markets - 2022-2030 – With Corona & COP26 Impacts
    Please fill out all fields in the form below and click "Submit" to send your question.
    Our representative will review your question and contact you with an answer as soon as possible.
  • 2+2=
  • This field is for validation purposes and should be left unchanged.
1
Interested in this report? Need more information?

You may also like…

X
Powered By