Top
HSRCEurope Climate Change Mitigation & Adaptation Market & Technologies – 2022-2030 – With Corona & COP26 Impacts
NEW

Europe Climate Change Mitigation & Adaptation Market & Technologies - 2022-2030 – With Corona & COP26 Impacts

Bottom-up Research of 177 Submarkets. 2026 Market of 843 Billion

  • July 2022
  • 410
  • 385
    • 4950 $
    • 5950 $
    • 8950 $
    • 12000 $

    Small Businesses, Startups & Academia - Up to 50% Off

Quantity
IBM
Amazon
Sandia National Lab
HITACHI
Thales
Smiths Detection
Nuctech
Korea Internet & Security Agency
L3Harris
Huawei
Leidos
NEC
Toshiba
Deloitte
MAG

Want to customize this report?

If you purchase this report, you are entitled to a 30% discount towards customizing it, to better fit your market research and strategic needs. Our Custom Research and Industry Insights Department will work with you to better understand your information gaps and strategic needs and will provide you with a tailor-made market research report within a short period of time.

Why Choose Us?

30+ Years of Experience
We are a multidisciplinary team of Transformational Technologies industry experts with over 30 years of experience.
Gold Standard
With over 950 private sector clients (73% repeat customers), including major defense and security vendors, and Forbes Global 2000 companies, HSRC earned the reputation as the industry’s Gold Standard for Transformational Technologies Market Reports.
Tailored Research Services
Provide you with clear, actionable recommendations designed to empower decision making and to help you exploit emerging opportunities in the Transformational Technologies industries.
Information Security
Your personal information is safe and secure.

From: $4,950

Description

The 410-page Europe Climate Change Mitigation & Adaptation Market & Technologies – 2022-2030 – With Corona & COP26 Impacts report contains a thorough analysis of 16 sectors, 60 technology, 5 revenue source and 26 national markets, detailing 177 markets. According to the report, the 2026 market size will reach 843 billion.


IPCC-2022 Climate Change Temperature Rise effects on Europe

Source: IPCC Report Feb. 28, 2022

“People see that it (investments in renewables, following the Ukraine invasion) is not only a climate-related issue, but an energy security related issue”

R. Habeck, German Vice Chancellor, Feb. 2022

The following factors drive the European market:

  • Europe is the leader in the energy revolution. Nearly all the continent’s governments are committed to the COP26 agreement.
  • The Russian – Ukraine war is a threat to Europe’s energy security.
  • Coal has substantial shares in electricity production in Europe. Twelve European countries are committed to phase-out coal by 2030 and Germany by 2038.
  • Western Europe’s reliance on fossil energy import and its current conflict with Russia drive its low-carbon policy, with a strong decarbonization target of 55% by 2030 vs. the prior 40% policy. Last year it was introduced into the European Climate Law.
  • The UK embarked on an impressive goal to reduce GHG by 68% by 2030.
  • The EU R&D funding “Horizon Europe” committed about $35 billion from 2022 to 2027 to climate change mitigation research and development projects, about a third of Horizon Europe’s grants.

Europe Electric Generation Primary* Sources Outlook – 2050

(*) Excluding Hydrogen Generation sources, which are based on the primary sources

  • Several European countries, led by Russia, France and the UK, will expand their nuclear energy infrastructure and invest in small nuclear reactors (SMR) programs.
  • Onshore and offshore wind power generation dominates (about 50%) the 2050 electricity production, and solar PV follows (about 20%). The EU invests in electrolysis generated Hydrogen in the hope of dominating the energy sector by 2050.
  • About 40% of the European motor vehicle fleet will convert to EVs by the mid-2030’s.
  • Climate change is expected to boost the frequency of weather-related calamities across Europe in the coming years. Heavy rainstorms are expected to become more common and more intense, and flash floods are likely to become more frequent across the continent.
  • Strong public support. 90% of Europeans believe their children will experience the effects of climate change.
  • In 2021, the European Parliament approved a landmark law setting GHG targets for 2050 to achieve carbon neutrality and, after 2050 – negative emissions.
  • Following Russia’s invasion of Ukraine, the EU and European governments launched sweeping changes to planning laws and investments to improve their energy security.

Europe 2030 Targets:

  1. Decrease GHG emissions by 55% from the 1990 level.
  2. Generate 32% of energy from renewables.
  3. Improve energy efficiency by 32.5%.


Per Capita Annual CO-2 Emissions [Ton/ Person] in Leading  European Countries

Why Buy:

  • Comprehensive Report. It’s a comprehensive strategic investigation of the European Warming Mitigation & Adaptation markets.
  • Bottom-up Research. The report provides you with exhaustive bottom-up research of 297 climate change mitigation and adaptation-related markets.
  • Extensive Research.  The report analysts conducted interviews with dozens of experts. It reviewed over 660 reports, documents and papers published by other experts (including, for example, IEA, IRENA, the UN, Fraunhofer, the UK, German and other government agencies and more).
  • Multi-Source Intelligence Verification. With a highly fragmented market, we addressed each dollar spent. The European warming mitigation market was analyzed and crosschecked via four orthogonal viewpoints: technologies and services, sectors, countries and revenue sources.
  • COP26 Revision. To guarantee the accuracy of the data and market size forecasts, we revised the data by following and analyzing the Nov. 2021 Glasgow COP26 meetings deliberations of European national pledges.
  • Money Trail. The report offers the only mega-study of ‘when?’, ‘where?’, ‘why?’ and ‘how much?’ of the cumulative 2022-2030 $9.6 Trillion go to market.
  • Report Excel. Once you buy the report, you can get for a nominal price its Excel version.
  • Customized for Decision-Makers. This report aims to provide today’s strategic decision-makers with an expert 360-degree, time-sensitive, detailed view of this interconnected market.
Market Segmentation Vectors


A. Questions answered in this report include:

  • What will the 2022-2030 market size be?
  • How do COP26 & Corona affect the market?
  • Which submarkets provide attractive business opportunities?
  • What drives customers to invest?
  • What are the Warming Mitigation technologies & services trends?
  • What are the challenges to market penetration & growth?
  • How much are European countries expected to invest in warming mitigation?

B. The European Warming Mitigation & Adaptation market data is analyzed via 4 independent perspectives:

  1. By 60 Technologies and Services:
  • Biological Carbon Capture & Sequestration
  • Carbon Capture & Storage
  • Carbon Capture & Utilization
  • Hydroelectric Power
  • Geothermal Power Generation
  • Direct Geothermal Heating & Cooling 
  • Bioenergy
  • Marine Power
  • Solar PV (Utility Scale)
  • Rooftop Solar PV
  • Concentrating Solar Power (CSP)
  • Direct Solar Water Heating
  • Offshore Wind Power
  • Energy-Efficient Electric Appliances (w/o ACR)
  • Air Sourced Heat Pumps
  • Passenger BEV Cars
  • Two & Three-Wheeler BEVs
  • Freight BEVs
  • Electric Buses
  • Other BEVs
  • EV Charging Systems
  • Hydrogen Vehicles
  • Hydrogen Electrolyzes
  • Hydrogen Fueling Infrastructure
  • Green Hydrogen Production
  • Methane Abatement
  • Green Cement
  • Green Steel
  • Passive Green Buildings
  • Grid Modernization
  • Desalination Plants
  • Onshore Wind Power
  • Nuclear Energy Plants > 1 GW
  • Small Nuclear Reactors 
  • Other Renewable Energy
  • Grid-Scale Battery Storage
  • Thermal Energy Storage
  • Compressed-Air Storage
  • Hydroelectric Energy Storage 
  • Other Energy Storage Modalities
  • Waste to Energy Plants
  • Low Carbon Fuels Manufacturing Plants
  • Energy-Efficient Air Conditioning & Refrigeration (ACR)
  • Precision Agriculture
  • Regenerative agriculture
  • Climate Adapted Water Infrastructure
  • Water Redeemable Systems
  • Precision Irrigation
  • Climate Adapted Agriculture
  • Reforestation
  • Bioremediation
  • Floods Control
  • Wildfire Mitigation
  • Weather Monitoring, Modeling & Forecasting
  • Extreme Weather Public Warning Systems
  • GHG Emission Tracking
  • Big Data & AI
  • Cybersecurity
  • ICT (W/O Cyber, AI, Big Data)
  • Other

 2. By 5 Revenue Source Markets:

  • Infrastructure
  • Product Sales
  • Maintenance
  • Upgrades
  • Other

3. By 26 National Markets:

  • Austria
  • Belarus
  • Belgium
  • Bulgaria
  • Czech Republic
  • Denmark
  • Finland
  • France
  • Germany
  • Greece
  • Hungary
  • Italy
  • Netherlands
  • Norway
  • Poland
  • Portugal
  • Romania
  • Russia
  • Serbia
  • Slovakia
  • Spain
  • Sweden
  • Switzerland
  • UK
  • Ukraine
  • Rest of Europe

4. By 16 Sectors

  • GHG Capture 
  • Renewable Energy
  • Energy Storage
  • Zero Emission Electric Utility Plants
  • Green Fuel Production Plants
  • Passive & Active Heating and Cooling
  • Electric Vehicles Fleet
  • Hydrogen Economy
  • Green Materials
  • Agriculture, Forests & Land
  • Water
  • Energy Efficient Buildings
  • Extreme Weather Events Mitigation
  • Software
  • Electric Grid 
  • Other Sectors  

C. Detailed market analysis frameworks are provided, including:

  • Market drivers & inhibitors
  • Business opportunities
  • SWOT analysis
  • Competitive analysis
  • Business environment
  • The 2020-2030 market
  • Industry Value Chain   
  • Financing & Loans       
  • Governmental R&D Funding    

D. Companies mentioned in the report: 

  • 7c Solarparken
  • Aalborg CSP
  • ABB Environmental Services Inc.
  • Abengoa
  • ABN AMRO
  • ABO Wind
  • Access Power
  • Acciona
  • ACTIAM
  • ACWA Power
  • Advanced Cyclone Systems, S.A.
  • Aeroqual
  • Ag Leader Technology
  • AGCO Corporation
  • AgJunction, Inc.
  • AIMCo
  • Airmar Technology Corporation
  • Aker Clean Carbon AS
  • Alectris
  • Alfa Laval
  • All Weather, Inc
  • Alstom Energy
  • Altogen Labs
  • Alumasc Group Plc
  • AMEA Power
  • Ameret Llc
  • Amvik Systems
  • Andritz Hydro
  • Ansaldo Energia
  • APG
  • Aquatech International
  • Areva
  • Argenta Banken Verzekeringsgroep nv
  • Ascent Solar Technologies, Inc
  • Atb Riva Calzoni
  • AVTECH
  • Azelio
  • Azure Power
  • B Fouress
  • Ballard Power Systems
  • Banpro, Grupo Promerica
  • BASF SE
  • Basler Kantonalbank
  • Bauder Limited
  • BayernLB
  • BBVA
  • BDR Thermea
  • Berner Kantonalbank AG BEKB
  • Bester Energy
  • BHEL
  • Binderholz GmbH
  • Bioactive Services Inc.
  • Bioremediation Consulting Inc.
  • Bioremedy Pty. Ltd.
  • Biwater
  • BlackRock
  • Boralex Inc
  • Bornay 
  • Bosch Thermotechnology
  • Boston Consulting Group
  • BrightSource Energy
  • Brookfield Renewable Partners
  • BRUKS Siwertell
  • BTG Pactual
  • Bündnis Bürgerenergie
  • Caixabank, SA
  • Campbell Scientific   
  • Canadian Solar, Inc
  • Carbon Clean Solutions
  • Cardano
  • Carrier Corporation
  • Carus Corp.
  • CDC Group
  • CertainTeed Corporation
  • China Guodian Corporation 
  • China HuaNeng Group
  • Chinese Renewable Energy
  • CIBC
  • CIMB Group Holdings Berhad
  • CKD Blansko
  • Coastal Enterprises, Inc
  • Cobra
  • Columbia Weather Systems
  • Comerica, Inc
  • Compte.R.
  • ConocoPhillips Company
  • Cooperativa Abaco
  • Coopeservidores RL
  • Couldberry Clean Energy
  • CropMetrics LLC
  • CRRC 
  • CSIC 
  • Daikin Industries Ltd.
  • Dakota Gasification
  • Deere and Company
  • Desjardins Group
  • Detroit Stoker Company
  • Dii Desert Energy
  • Dongfang Electric
  • Doosan heavy industries & construction
  • Doosan 
  • Dow
  • Drylet Llc
  • Dulas
  • Dutch Marine Energy Centre
  • du Pont de Nemours and Company
  • Eco Blue Bioremediation Canada
  • Ecology Building Society
  • ECOWAS Centre for Renewable
  • EDP Renováveis, S.A.
  • Efficiency Partnership (REEEP)
  • EG&G Inc.
  • EIG Global Energy Partners
  • EKO energy
  • Elecon Engineering 
  • Emerson
  • ENEL Green Power (EGP)
  • Enercon 
  • ENERGIA
  • Energiekontor AG
  • Energy and Energy Efficiency (RCREEE)
  • Energy Innovations (UK)
  • Energy Watch Group
  • Enessere 
  • Enlight Renewable Energy Ltd.
  • Enphase Energy
  • Envira
  • Envirogen Technologies Inc.
  • Environment Development
  • Envision Energy 
  • Enviva
  • eSolar
  • Evergreen Engineering
  • Evoqua Water Technologies
  • Falck Renewables
  • Ferrovial
  • FinDev Canada
  • Finergreen
  • First National Energy Corp
  • First Solar Holding, LLC
  • FirstRand Group Ltd
  • Fisia Italimpianti
  • Fiton Group
  • Flibe Energy
  • Flovel Energy Private Limited
  • Fluence
  • Fluor Corporation
  • FMO
  • Forbo International SA
  • FTI Consulting
  • Fuji Electric
  • Fuji Heavy Industries 
  • Gamesa Corporación Tecnológica
  • Ganz EEPM
  • Garioni Naval (Italy)
  • General Electric
  • Genesis Water Technologies
  • Geothermal Energy Nordic AS (gtml)
  • Geovation Engineering P.C.
  • GFZ Helmholtz Zentrum Potsdam
  • Gilbert Gilkes & Gordon Ltd
  • GlassPoint Solar
  • Global Hydro Energy
  • Global Solar Council (GSC)
  • Global Wind Energy Council (GWEC)
  • Gold Standard
  • Goldwind
  • Graded
  • Gradko
  • Greenera Energy India Pvt
  • Greenpeace International
  • GUGLER
  • Halliburton
  • Hangzhou Boiler (China)
  • Hanjin 
  • Hannon Armstrong
  • Hanwell Solutions
  • Hanwha Asset Management
  • HEITRONICS
  • Hitachi
  • Hi-VAWT 
  • Hivos
  • Honeywell
  • HS Orka
  • HSBC Holdings PLC
  • HTCO2 Systems
  • Hurst Boiler & Welding Co. Inc.
  • Husk Power Systems
  • Hyosung 
  • Hyundai Heavy Industries 
  • Iberdrola SA
  • ICLEI – Local Governments
  • IDE Technologies
  • Infigen Energy
  • Ingersoll-Rand PLC
  • Inox Wind  
  • Interface Inc.
  • Interra Global Corporation
  • iSun isunenergy.com
  • Ivey International Inc.
  • Japan Steel Works 
  • John King Chains USA
  • JRW Bioremediation Llc
  • Justsen Energiteknik (Denmark)
  • Kankyo Cleantech Llp
  • KBC Group
  • kiloWattsol
  • Kingspan Group plc
  • Koch Separation Solutions
  • Kohlbach Group (Austria)
  • Kolektor Turboinstitut
  • Končar 
  • Lafarge
  • Lambda Bioremediation Systems Inc.
  • LAMBION Energy Solutions (Germany)
  • Limited
  • Lekela Power
  • Lhoist UK Ltd/Tradical
  • Linde Engineering
  • Lointek
  • Longyuan Power
  • Lufft Mess-und Regeltechnik   
  • Machine Sazi Arak 
  • MagNet Hungarian Community Bank
  • Mainstream Renewable Power
  • MAKE/Wood Mackenzie
  • Makona Hardware and Industrial (Pty.) Ltd.
  • Mali Folkecenter
  • Mapna 
  • Masdar
  • Mavel
  • MENA
  • Metito
  • Microgen Biotech Ltd.
  • Mitsubishi Electric Corporation
  • Mitsubishi Heavy Industries
  • MN
  • Modine
  • Moltex Energy
  • Morcom International
  • Morgan Stanley
  • Mouser Electronics
  • MS Energy Solutions Ltd
  • Mujeres en Energía Renovable
  • Münchener Verein Versicherung
  • National Fiber
  • NatWest Group
  • Neoen
  • Netherlands Wind Energy
  • Network Consulting Group
  • Network for the 21st Century (REN21)
  • New Energy Nexus
  • NIBC Holding NV
  • Nibe Industrier
  • NN Group
  • Nordex SE 
  • Nordic Folkecenter
  • Novatec
  • Novozymes
  • Ocean Energy Europe
  • Ocean Power Technologies, Inc
  • OCHSNER Warmepumpen
  • Oil Spill Eater International Corp.
  • Ontario Sustainable Energy
  • Opsis
  • Ormat Technologies Inc.
  • Owens Corning
  • PacWind 
  • Pall Corporation
  • Panasonic Corporation
  • Phanes Group
  • Phoenix Group


  • PIDG – The Private Infrastructure Development Group Ltd
  • PlanetEnergy
  • PostFinance AG
  • PPG Industries
  • Practical Action
  • Primus windpower
  • Probiosphere Inc.
  • ProcessBarron
  • Produbanco
  • PV Crystalox Solar, plc
  • QM Environmental International B.V.
  • quietrevolution 
  • Qway Energy
  • Rabobank
  • Rackam
  • Rahimafrooz Renewable
  • Raise Green, Inc
  • Raven Industries Inc.
  • RE100/The Climate Group
  • RedBuilt, LLC
  • Renovagen Ltd.
  • Revelle Group
  • REVOLVE
  • Reward Wall Systems
  • Rioglass Solar
  • Rizal Commercial Banking Corporation
  • RNAS Remediation Products
  • RNHB BV
  • Robeco
  • Robert Bosch GmbH (Bosch Thermotechnology Corporation)
  • Rocky Mountain Institute (RMI)
  • Rotronic
  • RRB Energy Limited 
  • Ryse Energy
  • SAC Apoyo Integral, SA
  • Safbon Water Technology
  • Samorka, tbc
  • SANY 
  • Sasol Limited
  • Schneider Electric
  • Schott
  • SENER
  • SER Colombia
  • Sevenson Environmental Services Inc.
  • SGS Weather
  • Shams Power
  • Shandong Sukahan Bio-Technology Co. Ltd.
  • Shanghai Electric 
  • Shell Cansolv
  • Shinhan Financial Group
  • Siemens
  • Sinovel 
  • Skye Instruments
  • Skypower
  • SMA Solar Technology
  • Smp drilling, tbc
  • SNC-Lavalin
  • Solar Euromed
  • Solar Head of State
  • SolarCoin Foundation
  • SolarEdge Technologies, Inc
  • Solarlite
  • SolarPower Europe
  • SolarReserve
  • SolarWorld AG
  • Soliterm Group
  • Sopogy Micro CSP
  • SoyutWind
  • Statoil ASA
  • Stichting Pensioenfonds Metaal en Techniek (PMT)
  • Stichting Pensioenfonds van de Metalektro (PME)
  • Stiebel Eltron
  • Structurlam Products Ltd.
  • STX Windpower
  • SUEZ
  • Summit Carbon Capture
  • Sunlabob Renewable Energy
  • SunPower Corporation
  • Sunrun
  • Sutron Corporation
  • Suzlon 
  • Syndicat des Énergies
  • Synex International
  • TCXFund
  • TECO 
  • TERI School of Advanced Studies
  • Terna Energy
  • Terra Power
  • Terrestrial Energy
  • TES Vsetín
  • Tesla, Inc.
  • Tesup 
  • The Glen Dimplex Group
  • The Nature Conservancy
  • The Weather Company   
  • ThermoFisher Scientific
  • ThorCon Power
  • Topcon Corporation
  • Torresol Energy
  • Torxx Kinetic Pulverizer
  • Toshiba
  • Trane
  • Transatomic Power Corporation
  • Trident Environmental Llc
  • Trimble, Inc.
  • Trina Solar
  • TUGE Energia 
  • TVP Solar
  • UGE International, LTD
  • UNISON 
  • Urban Green Energy 
  • Vaillant
  • Vaisala
  • Van Lanschot Kempen
  • Vancity
  • Vasudha Foundation
  • VEOLIA
  • Verde Environmental Group
  • Vergnet 
  • Vestas Wind Systems
  • Viessmann Group
  • Voith GmbH
  • VSECU
  • Vulcan Energie Ressourcen GmbH, tbc
  • WABAG
  • WaterPower Canada
  • WEG 
  • Wellons
  • Western Power
  • WETICO (Water & Environment Technologies)
  • WindForce
  • Wizard Power
  • Wolf Material Handling Systems
  • Wuxi Huaguang Boiler (China)
  • WWF-Emirates Nature WPO
  • XacBank
  • Xant 
  • Xylem (YSI)
  • Yansa Group
  • Yeager Energy B.V.
  • Yellow Door Energy
  • Zhejiang Jinlun Electromechanic
  • Zhengzhou Boiler
  • Zhuhai Wangyang Water Treatment Equipment


Table of Contents

Download TOC as PDF

Contents

1         The Report Key Assumptions…………………………………. 47

2         Executive Summary………………………………………………. 48

2.1        Key Findings…………………………………………………… 48

2.2        Key Conclusions………………………………………………. 61

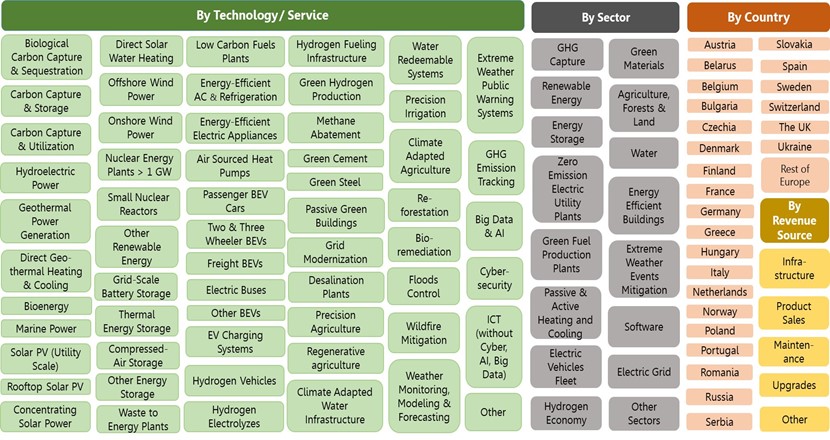
2.3        Europe Climate Change Mitigation & Adaptation Market Segmentation Vectors……………………………………….. 71

2.4        Europe Climate Change Mitigation & Adaptation Market – 2022-2030……………………………………………………. 72

2.4.1            Europe Market by Technology – 2022-2030……… 72

2.4.2            Europe Market by Sector – 2022-2030…………….. 74

2.4.3            Europe Market by Revenue Source – 2022-2030. 75

2.4.4            Europe Market by Country – 2022-2030…………… 76

3         COP26 & COVID-19 Implications……………………………… 77

3.1        COP26 Takeaway……………………………………………. 77

3.2        COVID-19 Implications………………………………………. 78

4         The Industry Value Chain……………………………………….. 80

5         Business Opportunities…………………………………………. 81

6         Market Drivers………………………………………………………. 92

7         Market Inhibitors…………………………………………………… 93

8         SWOT Analysis…………………………………………………….. 94

8.1        Strengths……………………………………………………….. 94

8.2        Weaknesses…………………………………………………… 95

8.3        Opportunities…………………………………………………… 96

8.4        Threats………………………………………………………….. 97

TECHNOLOGY, PRODUCT & SERVICE MARKETS…………….. 99

9         Europe Climate Change Mitigation & Adaptation Technologies, Products & Services Markets – 2020-2030 99

9.1        Technology, Products & Services Markets Size………. 99

9.2        Technology Products & Services Markets Dynamics. 100

9.3        Technology Products & Services Markets Share……. 102

10      Biological Carbon Capture & Sequestration Market – 2022-2030…………………………………………………………… 104

10.1     CEO Takeaway……………………………………………… 104

10.1.1          Summary………………………………………………… 104

10.1.2          Kelp Farms Products…………………………………. 106

10.1.3          Biological Carbon Sequestration…………………… 106

10.1.4          Microalgae Carbon Biological Capture & Utilization……………………………………………………………… 106

10.1.5          Oceans Carbon Sequestration……………………… 107

10.1.6          Soil Carbon Sequestration…………………………… 107

10.1.7          Forests Carbon Sequestration……………………… 107

10.1.8          Grasslands Carbon Sequestration………………… 108

10.1.9          Impacts of Carbon Sequestration………………….. 108

10.2     Europe Biological Carbon Capture & Sequestration Market – 2020-2030………………………………………… 108

10.2.1          Biological Carbon Capture & Sequestration Market Size……………………………………………………….. 108

10.2.2          Biological Carbon Capture & Sequestration Market Dynamics………………………………………………… 109

10.2.3          Biological Carbon Capture & Sequestration Market Share……………………………………………………… 109

11      Carbon Capture & Storage Market – 2022-2030………… 110

11.1     CEO Takeaway……………………………………………… 110

11.1.1          Summary………………………………………………… 110

11.1.2          Geological Carbon Sequestration…………………. 112

11.1.3          Technological Carbon Sequestration……………… 112

11.1.4          Graphene Production…………………………………. 112

11.1.5          Direct Air Capture (DAC)…………………………….. 112

11.1.6          Engineered Molecules………………………………… 112

11.1.7          CCS, DOE Investments………………………………. 113

11.2     Key Vendors………………………………………………….. 114

11.3     Europe Carbon Capture & Storage Market – 2020-2030                                                                               115

11.3.1          Carbon Capture & Storage Market Size…………. 115

11.3.2          Carbon Capture & Storage Market Dynamics….. 115

11.3.3          Carbon Capture & Storage Market Share……….. 116

12      Carbon Capture & Utilization Market – 2022-2030…….. 117

12.1     CEO Takeaway……………………………………………… 117

12.1.1          Summary………………………………………………… 117

12.1.2          CCU Proliferation………………………………………. 119

12.1.3          Carbon Capture and Utilization Applications……. 120

12.1.4          Algae Cultivation……………………………………….. 121

12.2     Key Vendors………………………………………………….. 123

12.3     Europe Carbon Capture & Utilization Market – 2020-2030……………………………………………………………. 123

12.3.1          Carbon Capture & Utilization Market Size……….. 123

12.3.2          Carbon Capture & Utilization Market Dynamics… 124

12.3.3          Carbon Capture & Utilization Market Share…….. 124

13      Methane Abatement Market – 2022-2030…………………. 125

13.1     CEO Takeaway……………………………………………… 125

13.1.1          Summary………………………………………………… 125

13.1.2          Methane Sources……………………………………… 127

13.1.3          COP26 Methane Pledge…………………………….. 128

13.1.4          Methane Mitigation……………………………………. 128

13.1.5          GHG Abatement Cost Forcast – 2030…………….. 130

13.2     Key Vendors………………………………………………….. 131

13.3     Europe Methane Abatement Market – 2020-2030….. 132

13.3.1          Methane Abatement Market Size………………….. 132

13.3.2          Methane Abatement Market Dynamics…………… 133

13.3.3          Methane Abatement Market Share……………….. 133

14      Geothermal Power Generation Market – 2022-2030…… 134

14.1     CEO Takeaway……………………………………………… 134

14.1.1          Summary………………………………………………… 134

14.1.2          Geothermal Electric Power Generation………….. 136

14.1.3          Geothermal Power Plants LCOE…………………… 137

14.1.4          Enhanced Geothermal Systems (EGS)………….. 137

14.1.5          The 2022-2030 Market Growth Drivers…………… 139

14.2     Key Vendors………………………………………………….. 140

14.3     Europe Geothermal Power Generation Market – 2020-2030……………………………………………………………. 141

14.3.1          Geothermal Power Generation Market Size…….. 141

14.3.2          Geothermal Power Generation Market Dynamics 141

14.3.3          Geothermal Power Generation Market Share….. 142

15      Direct Geothermal Heating & Cooling Market – 2022-2030 143

15.1     CEO Takeaway……………………………………………… 143

15.1.1          Summary………………………………………………… 143

15.1.2          Direct Geothermal Heating & Cooling Applications……………………………………………………………… 144

15.1.3          Geothermal Heat Pumps. Heating and Cooling… 144

15.1.4          Geothermal District Heating…………………………. 145

15.1.5          Geothermal Heating Pump Price Competitiveness……………………………………………………………… 146

15.2     Europe Direct Geothermal Heating & Cooling Market – 2020-2030…………………………………………………….. 147

15.2.1          Direct Geothermal Heating & Cooling Market Size……………………………………………………………… 147

15.2.2          Direct Geothermal Heating & Cooling Market Dynamics………………………………………………… 148

15.2.3          Direct Geothermal Heating & Cooling Market Share……………………………………………………………… 148

16      Marine Power Systems Market – 2022-2030…………….. 149

16.1     CEO Takeaway……………………………………………… 149

16.1.1          Summary………………………………………………… 149

16.1.2          Marine Tidal Power technologies………………….. 150

16.1.3          Marine Current Power Generation………………… 151

16.1.4          Marine Osmotic Power Generation……………….. 151

16.1.5          Ocean Thermal Energy………………………………. 152

16.1.6          Marine Wave Power…………………………………… 152

16.2     Key Vendors………………………………………………….. 153

16.3     Europe Marine Power Market – 2020-2030…………… 154

16.3.1          Marine Power Market Size………………………….. 154

16.3.2          Marine Power Market Dynamics…………………… 154

16.3.3          Marine Power Market Share………………………… 155

17      Solar PV (Utility Scale) Market – 2022-2030……………… 156

17.1     CEO Takeaway……………………………………………… 156

17.1.1          Summary………………………………………………… 156

17.1.2          Market Outlook…………………………………………. 160

17.2     Key Vendors………………………………………………….. 161

17.3     Europe Solar PV (Utility Scale) Market – 2020-2030. 162

17.3.1          Solar PV (Utility Scale) Market Size………………. 162

17.3.2          Solar PV (Utility Scale) Market Dynamics……….. 163

17.3.3          Solar PV (Utility Scale) Market Share…………….. 163

18      Rooftop Solar PV Market – 2022-2030…………………….. 164

18.1     CEO Takeaway……………………………………………… 164

18.1.1          Summary………………………………………………… 164

18.1.2          Solar Rooftop Technology…………………………… 165

18.1.3          Solar Rooftop System Economics……………….. 166

18.1.4          Adoption Of Rooftop PV……………………………. 166

18.2     Europe Rooftop Solar PV Market – 2020-2030……… 166

18.2.1          Rooftop Solar PV Market Size……………………… 166

18.2.2          Rooftop Solar PV Market Dynamics………………. 167

18.2.3          Rooftop Solar PV Market Share……………………. 167

19      Concentrating Solar Power (CSP) Market – 2022-2030. 168

19.1     CEO Takeaway……………………………………………… 168

19.1.1          Summary………………………………………………… 168

19.1.2          CSP Projects……………………………………………. 170

19.1.3          CSP vs. Solar PV……………………………………… 171

19.2     CSP Key Vendors…………………………………………… 171

19.3     Europe Concentrating Solar Power (CSP) Market – 2020-2030…………………………………………………….. 172

19.3.1          Concentrating Solar Power (CSP) Market Size… 172

19.3.2          Concentrating Solar Power (CSP) Market Dynamics……………………………………………………………… 173

19.3.3          Concentrating Solar Power (CSP) Market Share. 173

20      Hydroelectric Power Market – 2022-2030………………… 174

20.1     CEO Takeaway……………………………………………… 174

20.1.1          Summary………………………………………………… 174

20.1.2          Hydropower LCOE…………………………………….. 177

20.1.3          Hydropower Technology…………………………….. 177

20.1.4          Hydroelectric Power Project Construction Cost… 178

20.2     Key Vendors………………………………………………….. 179

20.3     Europe Hydroelectric Power Market – 2020-2030….. 179

20.3.1          Hydroelectric Power Market Size………………….. 179

20.3.2          Hydroelectric Power Market Dynamics…………… 179

20.3.3          Hydroelectric Power Market Share………………… 180

21      Small Nuclear Reactors Market – 2022-2030……………. 181

21.1     CEO Takeaway……………………………………………… 181

21.1.1          Summary………………………………………………… 181

21.1.2          Advantages of SMRs…………………………………. 182

21.1.3          SMR Challenges……………………………………….. 183

21.2     Key Vendors………………………………………………….. 183

21.3     Europe Small Nuclear Reactors Market – 2020-2030 184

21.3.1          Small Nuclear Reactors Market Size……………… 184

21.3.2          Small Nuclear Reactors Market Dynamics………. 184

21.3.3          Small Nuclear Reactors Market Share……………. 185

22      Nuclear Energy Plants (> 1 GW) Market – 2022-2030…. 186

22.1     CEO Takeaway……………………………………………… 186

22.1.1          Summary………………………………………………… 186

22.1.2          Facts and Figures……………………………………… 187

22.1.3          Installed Base of Power Reactors – 2021………… 188

22.2     Key Vendors………………………………………………….. 188

22.3     Europe Nuclear Energy Plants > 1 GW Market – 2020-2030……………………………………………………………. 189

22.3.1          Nuclear Energy Plants > 1 GW Market Size……. 189

22.3.2          Nuclear Energy Plants > 1 GW Market Dynamics 189

22.3.3          Nuclear Energy Plants > 1 GW Market Share….. 190

23      Waste to Energy Plants Market – 2022-2030…………….. 191

23.1     CEO Takeaway……………………………………………… 191

23.1.1          Summary………………………………………………… 191

23.1.2          Facts & Figures………………………………………… 192

23.1.3          Waste to Energy Economy………………………….. 193

23.2     Europe Waste to Energy Plants Market – 2020-2030 194

23.2.1          Waste to Energy Plants Market Size……………… 194

23.2.2          Waste to Energy Plants Market Dynamics………. 194

23.2.3          Waste to Energy Plants Market Share……………. 195

24      Offshore Wind Power Market – 2022-2030……………….. 196

24.1     CEO Takeaway……………………………………………… 196

24.1.1          Summary………………………………………………… 196

24.1.2          Floating offshore wind power market……………… 201

24.1.3          The Proliferation of Offshore Wind Power Farms by Geography………………………………………………. 202

24.1.4          Operational Cost……………………………………….. 203

24.1.5          Cost trends……………………………………………… 203

24.2     Key Vendors………………………………………………….. 204

24.3     Europe Offshore Wind Power Market – 2020-2030… 204

24.3.1          Offshore Wind Power Market Size………………… 204

24.3.2          Offshore Wind Power Market Dynamics…………. 205

24.3.3          Offshore Wind Power Market Share………………. 205

25      Onshore Wind Power Market – 2022-2030……………….. 206

25.1     CEO Takeaway……………………………………………… 206

25.1.1          Summary………………………………………………… 206

25.1.2          Onshore Wind LCOE Outlook………………………. 208

25.1.3          Onshore Wind Power Disadvantages…………….. 208

25.1.4          Key Vendors……………………………………………. 208

25.2     Europe Onshore Wind Power Market – 2020-2030… 210

25.2.1          Onshore Wind Power Market Size………………… 210

25.2.2          Onshore Wind Power Market Dynamics…………. 210

25.2.3          Onshore Wind Power Market Share………………. 211

26      Bioenergy Market – 2022-2030………………………………. 212

26.1     CEO Takeaway……………………………………………… 212

26.1.1          Summary………………………………………………… 212

26.1.2          Bioenergy for Electricity Generation………………. 215

26.1.3          Bioenergy in Industry…………………………………. 215

26.1.4          Thermo-Chemical Process………………………….. 216

26.1.5          Bio-Chemical Process………………………………… 217

26.1.6          Bioenergy Conversion Technologies……………… 217

26.1.7          Global Bioenergy Market…………………………….. 218

26.1.8          Global Bio-Heating Market………………………….. 218

26.1.9          Biomass Heating For Buildings…………………….. 219

26.1.10       Global Bio-Power Markets…………………………… 220

26.1.11       The Global Solid Biomass Industry……………….. 221

26.1.12       The Global Liquid Biofuels Industry……………….. 222

26.1.13       The Global Gaseous Biomass Industry………….. 222

26.1.14       Global Bioenergy CCS & CCU……………………… 222

26.1.15       Thermal Conversions…………………………………. 224

26.1.16       Chemical Conversion…………………………………. 224

26.1.17       Biochemical Conversion……………………………… 224

26.1.18       Electrochemical Conversions……………………….. 224

26.2     Key Vendors………………………………………………….. 225

26.3     Europe Bioenergy Market – 2020-2030……………….. 226

26.3.1          Bioenergy Market Size……………………………….. 226

26.3.2          Bioenergy Market Dynamics………………………… 226

26.3.3          Bioenergy Market Share……………………………… 226

27      Other Renewable Energy Market – 2022-2030………….. 227

27.1     Europe Other Renewable Energy Market – 2020-2030                                                                               227

27.1.1          Other Renewable Energy Market Size……………. 227

27.1.2          Other Renewable Energy Market Dynamics……. 227

27.1.3          Other Renewable Energy Market Share…………. 228

28      Grid-Scale Battery Storage Market – 2022-2030……….. 229

28.1     CEO Takeaway……………………………………………… 229

28.1.1          Summary………………………………………………… 229

28.1.2          The U.S.  Energy Storage Market…………………. 232

28.1.3          Grid-Scale Battery Storage Benefits………………. 232

28.1.4          EVs and Energy Storage…………………………….. 233

28.2     Key Vendors………………………………………………….. 235

28.3     Europe Grid-Scale Battery Storage Market – 2020-2030                                                                               235

28.3.1          Grid-Scale Battery Storage Market Size…………. 235

28.3.2          Grid-Scale Battery Storage Market Dynamics….. 236

28.3.3          Grid-Scale Battery Storage Market Share……….. 236

29      Thermal Energy Storage Market – 2022-2030…………… 237

29.1     CEO Takeaway……………………………………………… 237

29.1.1          Summary………………………………………………… 237

29.1.2          Thermal Energy Storage  Advantages……………. 240

29.1.3          Molten Salt Storage Technology…………………… 241

29.1.4          Key Vendors……………………………………………. 241

29.2     Europe Thermal Energy Storage Market – 2020-2030                                                                               242

29.2.1          Thermal Energy Storage Market Size…………….. 242

29.2.2          Thermal Energy Storage Market Dynamics…….. 242

29.2.3          Thermal Energy Storage Market Share………….. 243

30      Compressed-Air Storage Market – 2022-2030………….. 244

30.1     CEO Takeaway……………………………………………… 244

30.1.1          Summary………………………………………………… 244

30.1.2          Adiabatic Compressed-Air Energy Storage……… 246

30.1.3          Diabatic Compressed-Air Energy Storage………. 246

30.2     Key Vendors………………………………………………….. 247

30.3     Europe Compressed-Air Storage Market – 2020-2030                                                                               247

30.3.1          Compressed-Air Storage Market Size……………. 247

30.3.2          Compressed-Air Storage Market Dynamics…….. 248

30.3.3          Compressed-Air Storage Market Share………….. 248

31      Hydroelectric Energy Storage Market – 2022-2030……. 249

31.1     CEO Takeaway……………………………………………… 249

31.1.1          Summary………………………………………………… 249

31.1.2          Facts & Figures………………………………………… 252

31.1.3          Pumped Hydroelectric Storage Technologies….. 252

31.1.4          Variable-Speed Pump-Storage Technology…….. 253

31.1.5          Key Vendors……………………………………………. 253

31.2     Europe Hydroelectric Energy Storage Market – 2020-2030……………………………………………………………. 254

31.2.1          Hydroelectric Energy Storage Market Size……… 254

31.2.2          Hydroelectric Energy Storage Market Dynamics. 255

31.2.3          Hydroelectric Energy Storage Market Share……. 255

32      Other Energy Storage Modalities Market – 2022-2030.. 256

32.1     Europe Other Energy Storage Modalities Market – 2020-2030……………………………………………………………. 256

32.1.1          Other Energy Storage Modalities Market Size….. 256

32.1.2          Other Energy Storage Modalities Market Dynamics……………………………………………………………… 256

32.1.3          Other Energy Storage Modalities Market Share.. 257

33      Green Cement Market – 2022-2030…………………………. 258

33.1     CEO Takeaway……………………………………………… 258

33.1.1          Summary………………………………………………… 258

33.1.2          Cement Decarbonization Options…………………. 262

33.1.3          Cement Negative Emission Technologies……….. 262

33.2     Key Vendors………………………………………………….. 264

33.3     Europe Green Cement Market – 2020-2030…………. 264

33.3.1          Green Cement Market Size…………………………. 264

33.3.2          Green Cement Market Dynamics………………….. 264

33.3.3          Green Cement Market Share……………………….. 265

34      Green Steel Market – 2022-2030…………………………….. 266

34.1     CEO Takeaway……………………………………………… 266

34.1.1          Summary………………………………………………… 266

34.1.2          CHG Emissions & Decarbonized (Green) Steel.. 268

34.2     Europe Green Steel Market – 2020-2030…………….. 269

34.2.1          Green Steel Market Size…………………………….. 269

34.2.2          Green Steel Market Dynamics……………………… 270

34.2.3          Green Steel Market Share…………………………… 270

35      Low Carbon Fuels Manufacturing Plants Market – 2022-2030…………………………………………………………………… 271

35.1     CEO Takeaway……………………………………………… 271

35.1.1          Summary………………………………………………… 271

35.2     Europe Low Carbon Fuels Manufacturing Plants Market – 2020-2030………………………………………………….. 277

35.2.1          Low Carbon Fuels Manufacturing Plants Market Size……………………………………………………………… 277

35.2.2          Low Carbon Fuels Manufacturing Plants Market Dynamics………………………………………………… 278

35.2.3          Low Carbon Fuels Manufacturing Plants Market Share……………………………………………………… 278

36      Energy-Efficient Air Conditioning & Refrigeration (ACR) Market – 2022-2030………………………………………………. 279

36.1     CEO Takeaway……………………………………………… 279

36.1.1          Summary………………………………………………… 279

36.1.2          Example 1. Thermoelectric Effect…………………. 282

36.1.3          Example 2: Reciprocating Compressors…………. 283

36.1.4          Example 3: Energy Efficient HVAC Ducts……….. 284

36.2     Key Vendors………………………………………………….. 285

36.3     Europe Energy-Efficient Air Conditioning & Refrigeration (ACR) Market – 2020-2030……………………………….. 285

36.3.1          Energy-Efficient Air Conditioning & Refrigeration (ACR) Market Size…………………………………….. 285

36.3.2          Energy-Efficient Air Conditioning & Refrigeration (ACR) Market Dynamics……………………………… 285

36.3.3          Energy-Efficient Air Conditioning & Refrigeration (ACR) Market Share………………………………….. 286

37      Energy-Efficient Electric Appliances (w/o ACR) Market – 2022-2030…………………………………………………………… 287

37.1     CEO Takeaway……………………………………………… 287

37.1.1          Summary………………………………………………… 287

37.2     Key Vendors………………………………………………….. 291

37.3     Europe Energy-Efficient Electric Appliances (w/o ACR) Market – 2020-2030………………………………………… 291

37.3.1          Energy-Efficient Electric Appliances (w/o ACR) Market Size……………………………………………… 291

37.3.2          Energy-Efficient Electric Appliances (w/o ACR) Market Dynamics………………………………………. 292

37.3.3          Energy-Efficient Electric Appliances (w/o ACR) Market Share……………………………………………. 292

38      Air Sourced Heat Pumps Market – 2022-2030…………… 293

38.1     CEO Takeaway……………………………………………… 293

38.1.1          Summary………………………………………………… 293

38.1.2          Heat Pump Technologies……………………………. 299

38.1.3          Heat Pump Cost Performance……………………… 300

38.1.4          Legislation……………………………………………….. 300

38.2     Key Vendors………………………………………………….. 301

38.3     Europe Air Sourced Heat Pumps Market – 2020-2030                                                                               301

38.3.1          Air Sourced Heat Pumps Market Size……………. 301

38.3.2          Air Sourced Heat Pumps Market Dynamics…….. 302

38.3.3          Air Sourced Heat Pumps Market Share………….. 302

39      Direct Solar Water Heating Market – 2022-2030………… 303

39.1     CEO Takeaway……………………………………………… 303

39.1.1          Summary………………………………………………… 303

39.2     Key Vendors………………………………………………….. 307

39.3     Europe Direct Solar Water Heating Market – 2020-2030                                                                               307

39.3.1          Direct Solar Water Heating Market Size…………. 307

39.3.2          Direct Solar Water Heating Market Dynamics….. 308

39.3.3          Direct Solar Water Heating Market Share……….. 308

40      Passenger BEV Cars Market – 2022-2030………………… 309

40.1     CEO Takeaway……………………………………………… 309

40.1.1          Summary………………………………………………… 309

40.1.2          Electric Cars vs. ICE Car Materials……………….. 317

40.1.3          Phasing Out Of Passenger ICE Cars…………….. 318

40.1.4          COVID-19 Effects……………………………………… 318

40.2     Key Vendors………………………………………………….. 319

40.3     Europe Passenger BEV Cars Market – 2020-2030…. 319

40.3.1          Passenger BEV Cars Market Size………………… 319

40.3.2          Passenger BEV Cars Market Dynamics…………. 320

40.3.3          Passenger BEV Cars Market Share………………. 320

41      Two & Three-Wheeler BEVs Market – 2022-2030………. 321

41.1     CEO Takeaway……………………………………………… 321

41.1.1          Summary………………………………………………… 321

41.2     Europe Two & Three-Wheeler BEVs Market – 2020-2030……………………………………………………………. 322

41.2.1          Two & Three-Wheeler BEVs Market Size……….. 322

41.2.2          Two & Three-Wheeler BEVs Market Dynamics… 323

41.2.3          Two & Three-Wheeler BEVs Market Share……… 323

42      Freight BEVs Market – 2022-2030…………………………… 324

42.1     CEO Takeaway……………………………………………… 324

42.1.1          Summary………………………………………………… 324

42.1.2          COVID-19 Effects……………………………………… 325

42.2     Key Vendors………………………………………………….. 326

42.3     Europe Freight BEVs Market – 2020-2030……………. 326

42.3.1          Freight BEVs Market Size…………………………… 326

42.3.2          Freight BEVs Market Dynamics……………………. 327

42.3.3          Freight BEVs Market Share…………………………. 327

43      Electric Buses Market – 2022-2030…………………………. 328

43.1     CEO Takeaway……………………………………………… 328

43.1.1          Summary………………………………………………… 328

43.1.2          E-Bus Economy………………………………………… 330

43.1.3          COVID-19 Effects……………………………………… 332

43.2     Key Vendors………………………………………………….. 332

43.4     Europe Electric Buses Market – 2020-2030………….. 333

43.4.1          Electric Buses Market Size………………………….. 333

43.4.2          Electric Buses Market Dynamics…………………… 333

43.4.3          Electric Buses Market Share……………………….. 333

44      Other BEVs Market – 2022-2030…………………………….. 334

44.1     CEO Takeaway……………………………………………… 334

44.1.1          Summary………………………………………………… 334

44.2     Key Vendors………………………………………………….. 340

44.3     Europe Other BEVs Market – 2020-2030……………… 341

44.3.1          Other BEVs Market Size…………………………….. 341

44.3.2          Other BEVs Market Dynamics……………………… 342

44.3.3          Other BEVs Market Share…………………………… 342

45      EV Charging Systems Market – 2022-2030………………. 343

45.1     CEO Takeaway……………………………………………… 343

45.1.1          Summary………………………………………………… 343

45.1.2          Light-Duty Vehicle Chargers………………………… 346

45.1.3          Private Home And Workplace Chargers…………. 347

45.1.4          Charging Heavy-Duty Electric Trucks…………….. 348

45.1.5          Mega-High Power Charging Standarts…………… 348

45.1.6          EVs and Energy Storage…………………………….. 349

45.1.7          Wireless Charging…………………………………….. 350

45.2     Key Vendors………………………………………………….. 351

45.3     Europe EV Charging Systems Market – 2020-2030… 351

45.3.1          EV Charging Systems Market Size……………….. 351

45.3.2          EV Charging Systems Market Dynamics………… 352

45.3.3          EV Charging Systems Market Share……………… 352

46      Hydrogen Vehicles Market – 2022-2030…………………… 353

46.1     CEO Takeaway……………………………………………… 353

46.1.1          Summary………………………………………………… 353

46.1.2          Fuel Cell Passenger Vehicles………………………. 359

46.1.3          Fuel-cell Buses…………………………………………. 359

46.1.4          Fuel-cell Trams and Trains………………………….. 359

46.1.5          Hydrogen Vehicles Advantages……………………. 360

46.1.6          Hydrogen Vehicles Disadvantages………………… 360

46.1.7          Hydrogen Storage…………………………………….. 360

46.2     Key Vendors………………………………………………….. 361

46.3     Europe Hydrogen Vehicles Market – 2020-2030……. 361

46.3.1          Hydrogen Vehicles Market Size……………………. 361

46.3.2          Hydrogen Vehicles Market Dynamics…………….. 362

46.3.3          Hydrogen Vehicles Market Share………………….. 362

47      Hydrogen Electrolyzers Market – 2022-2030……………. 363

47.1     CEO Takeaway……………………………………………… 363

47.1.1          Summary………………………………………………… 363

47.2     Key Vendors………………………………………………….. 368

47.3     Europe Hydrogen Electrolyzers Market – 2020-2030. 368

47.3.1          Hydrogen Electrolyzers Market Size………………. 368

47.3.2          Hydrogen Electrolyzers Market Dynamics………. 368

47.3.3          Hydrogen Electrolyzers Market Share……………. 369

48      Hydrogen Fueling Infrastructure Market – 2022-2030… 370

48.1     CEO Takeaway……………………………………………… 370

48.1.1          Summary………………………………………………… 370

48.2     Key Vendors………………………………………………….. 374

48.3     Europe Hydrogen Fueling Infrastructure Market – 2020-2030……………………………………………………………. 374

48.3.1          Hydrogen Fueling Infrastructure Market Size…… 374

48.3.2          Hydrogen Fueling Infrastructure Market Dynamics……………………………………………………………… 374

48.3.3          Hydrogen Fueling Infrastructure Market Share…. 374

49      Green Hydrogen Production Market – 2022-2030……… 376

49.1     CEO Takeaway……………………………………………… 376

49.1.1          Summary………………………………………………… 376

49.1.2          Green Hydrogen……………………………………….. 380

49.1.3          The European Hydrogen  Market………………….. 381

49.1.4          The Asia-Pacific Hydrogen Market………………… 381

49.2     A Net-Zero“Hydrogen Economy” by 2050 Scenario… 382

49.3     Key Vendors………………………………………………….. 383

49.4     Europe Green Hydrogen Production Market – 2020-2030……………………………………………………………. 383

49.4.1          Green Hydrogen Production Market Size……….. 383

49.4.2          Green Hydrogen Production Market Dynamics… 384

49.4.3          Green Hydrogen Production Market Share……… 384

50      Precision Agriculture Market – 2022-2030……………….. 385

50.1     CEO Takeaway……………………………………………… 385

50.1.1          Summary………………………………………………… 385

50.2     Precision Agriculture Challenges……………………….. 388

50.3     Precision Agriculture Technologies…………………….. 389

50.3.1          Remote Sensing……………………………………….. 390

50.3.2          Genetic Engineering………………………………….. 390

50.3.3          Agricultural Robots……………………………………. 390

50.3.4          Drones……………………………………………………. 390

50.3.5          Vertical Cultivating…………………………………….. 391

50.3.6          Data……………………………………………………….. 391

50.3.7          Connected Water………………………………………. 391

50.3.8          Electric Fish…………………………………………….. 391

50.3.9          Connected Cows………………………………………. 391

50.3.10       Farm Management Systems………………………… 392

50.4     Key Vendors………………………………………………….. 392

50.5     Europe Precision Agriculture Market – 2020-2030….. 392

50.5.1          Precision Agriculture Market Size…………………. 392

50.5.2          Precision Agriculture Market Dynamics………….. 392

50.5.3          Precision Agriculture Market Share……………….. 392

51      Regenerative Agriculture Market – 2022-2030………….. 394

51.1     CEO Takeaway……………………………………………… 394

51.1.1          Summary………………………………………………… 394

51.2     Europe Regenerative Agriculture Market – 2020-2030                                                                               397

51.2.1          Regenerative Agriculture Market Size……………. 397

51.2.2          Regenerative Agriculture Market Dynamics…….. 398

51.2.3          Regenerative Agriculture Market Share………….. 398

52      Climate Adapted Agriculture Market – 2022-2030……… 399

52.1     CEO Takeaway……………………………………………… 399

52.1.1          Summary………………………………………………… 399

52.2     Agriculture GHG Emission………………………………… 403

52.3     Key Vendors………………………………………………….. 405

53.1     Europe Climate Adapted Agriculture Market – 2020-2030……………………………………………………………. 406

53.1.1          Climate Adapted Agriculture Market Size……….. 406

53.1.2          Climate Adapted Agriculture Market Dynamics… 406

53.1.3          Climate Adapted Agriculture Market Share……… 407

54      Reforestation Market – 2022-2030………………………….. 408

54.1     CEO Takeaway……………………………………………… 408

54.1.1          Summary………………………………………………… 408

54.1.2          Reforestation Management…………………………. 412

54.1.3          Reforestation for Climate Change Mitigation……. 413

54.1.4          Reforestation Strategies……………………………… 413

54.1.5          Empress Trees…………………………………………. 414

54.1.6          Finanancing Deforestation…………………………… 415

54.1.7          Megacities Forestation……………………………….. 415

54.1.8          Example: China Reforestation……………………… 416

54.2     Key Vendors………………………………………………….. 416

54.3     Europe Reforestation Market – 2020-2030…………… 417

54.3.1          Reforestation Market Size…………………………… 417

54.3.2          Reforestation Market Dynamics……………………. 418

54.3.3          Reforestation Market Share…………………………. 418

55      Bioremediation Market – 2022-2030……………………….. 419

55.1     CEO Takeaway……………………………………………… 419

55.1.1          Summary………………………………………………… 419

55.1.2          Bioremediation Cleanup Strategy………………….. 423

55.2     Key Vendors………………………………………………….. 426

55.3     Europe Bioremediation Market – 2020-2030…………. 427

55.3.1          Bioremediation Market Size…………………………. 427

55.3.2          Bioremediation Market Dynamics………………….. 427

55.3.3          Bioremediation Market Share………………………. 427

56      Climate Adapted Water Infrastructure Market – 2022-2030 428

56.1     CEO Takeaway……………………………………………… 428

56.1.1          Summary………………………………………………… 428

56.1.2          Digital Technologies…………………………………… 436

56.1.3          Water Management Strategy……………………….. 437

56.1.4          Agriculture Water Management……………………. 441

56.1.5          Urban Water Management………………………….. 442

56.1.6          Urban Decision Support System…………………… 443

56.2     Key Vendors………………………………………………….. 443

56.3     Europe Climate Adapted Water Infrastructure Market – 2020-2030…………………………………………………….. 444

56.3.1          Climate Adapted Water Infrastructure Market Size……………………………………………………………… 444

56.3.2          Climate Adapted Water Infrastructure Market Dynamics………………………………………………… 444

56.3.3          Climate Adapted Water Infrastructure Market Share……………………………………………………………… 445

57      Water Redeemable (Water Reclamation) Systems Market – 2022-2030………………………………………………………… 446

57.1     CEO Takeaway……………………………………………… 446

57.1.1          Summary………………………………………………… 446

57.1.2          Sewage Treatment Plants…………………………… 449

57.1.3          Example: Water Reclamation in  China………….. 450

57.2     Key Vendors………………………………………………….. 451

57.3     Europe Water Redeemable Systems Market – 2020-2030……………………………………………………………. 452

57.3.1          Water Redeemable Systems Market Size……….. 452

57.3.2          Water Redeemable Systems Market Dynamics.. 452

57.3.3          Water Redeemable Systems Market Share…….. 453

58      Desalination Plants Market – 2022-2030………………….. 454

58.1     CEO Takeaway……………………………………………… 454

58.2     Technologies…………………………………………………. 458

58.2.1          Solar Distillation………………………………………… 459

58.2.2          Natural Evaporation…………………………………… 459

58.2.3          Vacuum Distillation……………………………………. 459

58.2.4          Multi-Stage Flash Distillation……………………….. 459

58.2.5          Multiple-Effect Distillation……………………………. 459

58.2.6          Vapor-Compression Distillation…………………….. 460

58.2.7          Wave-Powered Desalination……………………….. 460

58.2.8          Membrane Distillation………………………………… 460

58.2.9          Reverse Osmosis……………………………………… 460

58.2.10       Forward Osmosis……………………………………… 461

58.2.11       Freeze–Thaw…………………………………………… 461

58.2.12       Electrodialysis Membrane…………………………… 462

58.2.13       Technical Challenges…………………………………. 462

58.3     Key Vendors………………………………………………….. 463

58.4     Europe Desalination Plants Market – 2020-2030……. 464

58.4.1          Desalination Plants Market Size…………………… 464

58.4.2          Desalination Plants Market Dynamics……………. 465

58.4.3          Desalination Plants Market Share…………………. 465

59      Precision Irrigation Market – 2022-2030………………….. 466

59.1     CEO Takeaway……………………………………………… 466

59.1.1          Summary………………………………………………… 466

59.1.2          Drip Irrigation……………………………………………. 466

59.1.3          Variable Rate Irrigation………………………………. 467

59.1.4          GPS Technology………………………………………. 467

59.1.5          Monitoring and Automation………………………….. 468

59.1.6          Challenges & Opportunities…………………………. 468

59.2     Key Vendors………………………………………………….. 469

59.3     Europe Precision Irrigation Market – 2020-2030…….. 469

59.3.1          Precision Irrigation Market Size……………………. 469

59.3.2          Precision Irrigation Market Dynamics…………….. 470

59.3.3          Precision Irrigation Market Share………………….. 470

60      Passive Green Buildings Market – 2022-2030………….. 471

60.1     CEO Takeaway……………………………………………… 471

60.1.1          Summary………………………………………………… 471

60.1.2          Buildings GHG Emission & Energy Consumption 474

60.2     Key Vendors………………………………………………….. 475

60.3     Europe Passive Green Buildings Market – 2020-2030                                                                               475

60.3.1          Passive Green Buildings Market Size…………….. 475

60.3.2          Passive Green Buildings Market Dynamics…….. 476

60.3.3          Passive Green Buildings Market Share………….. 476

61      Flood Control Market – 2022-2030………………………….. 477

61.1     CEO Takeaway……………………………………………… 477

61.1.1          Summary………………………………………………… 477

61.1.2          Structural Forms of Mitigation………………………. 480

61.1.3          Nonstructural Measures……………………………… 481

61.1.4          Floodwater Diversion and Storage………………… 481

61.1.5          Floodplain and Stream Restoration……………….. 481

61.2     Key Vendors………………………………………………….. 481

61.3     Europe Floods Control Market – 2020-2030…………. 482

61.3.1          Floods Control Market Size…………………………. 482

61.3.2          Floods Control Market Dynamics………………….. 483

61.3.3          Floods Control Market Share……………………….. 483

62      Wildfire Mitigation Market – 2022-2030……………………. 484

62.1     CEO Takeaway……………………………………………… 484

62.1.1          Summary………………………………………………… 484

62.1.2          Carbon Emissions…………………………………….. 485

62.2     Key Vendors………………………………………………….. 486

62.3     Europe Wildfire Mitigation Market – 2020-2030……… 486

62.3.1          Wildfire Mitigation Market Size……………………… 486

62.3.2          Wildfire Mitigation Market Dynamics………………. 487

62.3.3          Wildfire Mitigation Market Share…………………… 487

63      Weather Monitoring, Modeling & Forecasting Market – 2022-2030…………………………………………………………… 488

63.1     CEO Takeaway……………………………………………… 488

63.1.1          Summary………………………………………………… 488

63.1.2          AI and Machine Learning To Predict Weather Events……………………………………………………. 489

63.2     Key Vendors………………………………………………….. 491

63.3     Europe Weather Monitoring, Modeling & Forecasting Market – 2020-2030………………………………………… 491

63.3.1          Weather Monitoring, Modeling & Forecasting Market Size……………………………………………………….. 491

63.3.2          Weather Monitoring, Modeling & Forecasting Market Dynamics………………………………………………… 492

63.3.3          Weather Monitoring, Modeling & Forecasting Market Share……………………………………………………… 492

64      Extreme Weather Public Warning Systems Market – 2022-2030…………………………………………………………………… 493

64.1     CEO Takeaway……………………………………………… 493

64.1.1          Summary………………………………………………… 493

64.1.2          Cell Baed Broadcast………………………………….. 497

64.1.3          Location Based Alert SMS…………………………… 499

64.2     Europe Extreme Weather Public Warning Systems Market – 2020-2030………………………………………… 501

64.2.1          Extreme Weather Public Warning Systems Market Size……………………………………………………….. 501

64.2.2          Extreme Weather Public Warning Systems Market Dynamics………………………………………………… 502

64.2.3          Extreme Weather Public Warning Systems Market Share……………………………………………………… 502

65      Big Data & AI Market – 2022-2030…………………………… 503

65.1     CEO Takeaway……………………………………………… 503

65.1.1          Summary………………………………………………… 503

65.1.2          Application of Artificial Intelligence (AI) in the Global Warming Mitigation Industry………………………… 505

65.2     Key Vendors………………………………………………….. 506

65.3     Europe Big Data & AI Market – 2020-2030…………… 506

65.3.1          Big Data & AI Market Size…………………………… 506

65.3.2          Big Data & AI Market Dynamics……………………. 507

65.3.3          Big Data & AI Market Share…………………………. 507

66      Cybersecurity Market – 2022-2030…………………………. 508

66.1     CEO Takeaway……………………………………………… 508

66.1.1          Summary………………………………………………… 508

66.1.2          Cybersecurity in the Global Warming Mitigation Industry…………………………………………………… 510

66.1.3          Cybercrime in the Electric Power Industry………. 510

66.2     Key Vendors………………………………………………….. 511

66.3     Europe Cybersecurity Market – 2020-2030…………… 512

66.3.1          Cybersecurity Market Size…………………………… 512

66.3.2          Cybersecurity Market Dynamics…………………… 512

66.3.3          Cybersecurity Market Share………………………… 512

67      ICT (w/o Cyber, AI, Big Data) Market – 2022-2030……… 513

67.1     CEO Takeaway……………………………………………… 513

67.1.1          Summary………………………………………………… 513

67.1.2          Distributed Energy Resources ICT………………… 514

67.2     Key Vendors………………………………………………….. 514

67.3     Europe ICT (w/o Cyber, AI, Big Data) Market – 2020-2030……………………………………………………………. 515

67.3.1          ICT (w/o Cyber, AI, Big Data) Market Size………. 515

67.3.2          ICT (w/o Cyber, AI, Big Data) Market Dynamics.. 516

67.3.3          ICT (w/o Cyber, AI, Big Data) Market Share……. 516

68      GHG Emission Tracking Market – 2022-2030…………… 517

68.1     CEO Takeaway……………………………………………… 517

68.1.1          Summary………………………………………………… 517

68.1.2          Methane Emission Tracking Technologies………. 521

68.2     Key Vendors………………………………………………….. 523

68.3     Europe GHG Emission Tracking Market – 2020-2030 523

68.3.1          GHG Emission Tracking Market Size…………….. 523

68.3.2          GHG Emission Tracking Market Dynamics……… 525

68.3.3          GHG Emission Tracking Market Share…………… 525

69      Grid Modernization Market – 2022-2030………………….. 526

69.1     CEO Takeaway……………………………………………… 526

69.1.1          Summary………………………………………………… 526

69.1.2          Smart Grid………………………………………………. 528

69.1.3          Transmission Lines Modernization………………… 529

69.1.4          Demand Response……………………………………. 530

69.1.5          Hardening the Grid……………………………………. 530

69.1.6          Advanced Distribution Management Systems….. 531

69.1.7          Smart Inverters…………………………………………. 531

69.1.8          Smart Meters……………………………………………. 531

69.1.9          Microgrids……………………………………………….. 531

69.2     Europe Grid Modernization Market – 2020-2030……. 533

69.2.1          Grid Modernization Market Size……………………. 533

69.2.2          Grid Modernization Market Dynamics…………….. 534

69.2.3          Grid Modernization Market Share…………………. 534

70      Other Global Warming Mitigation Markets – 2022-2030 535

70.1     Other Europe Warming Mitigation Markets – 2020-2030                                                                               535

70.1.1          Other Global Warming Mitigation Markets Size… 535

70.1.2          Other Global Warming Mitigation Markets Dynamics……………………………………………………………… 536

70.1.3          Other Global Warming Mitigation Markets Share 536

MARKET BY SECTOR…………………………………………………. 537

71      Climate Change Mitigation & Adaptation Market by Sector – 2022-2030………………………………………………. 537

71.1     Sectors’ Structure…………………………………………… 537

71.2     Market Size…………………………………………………… 539

71.3     Market Share…………………………………………………. 542

REVENUE SOURCE MARKETS…………………………………….. 543

72      Europe Climate Change Mitigation & Adaptation Market by Revenue Source – 2020-2030……………………………. 543

72.1     Europe Market – 2020-2030……………………………… 543

72.2     Europe Climate Change Mitigation & Adaptation Market Dynamics – 2020-2030……………………………………. 544

72.3     Europe Climate Change Mitigation & Adaptation Market Share – 2020-2030…………………………………………. 545

NATIONAL MARKETS…………………………………………………. 546

73      Europe Climate Change Mitigation & Adaptation Market by Country – 2020-2030………………………………………… 546

73.1     National Markets Size – 2020-2030…………………….. 546

73.2     National Markets Dynamics – 2020-2030…………….. 547

73.3     National Markets Shares – 2020-2030………………… 549

73.4     National Markets by Revenue Source – 2020-2030… 552

73.4.1          Infrastructure Markets………………………………… 552

73.4.2          Product Sales…………………………………………… 554

73.4.3          Maintenance Markets…………………………………. 555

73.4.4          Upgrades Markets…………………………………….. 557

73.4.5          Other* Revenue Sources……………………………. 559

74      Austria Climate Change Mitigation & Adaptation Market – 2020-2030…………………………………………………………… 561

74.1     Austria Market CEO Takeaway………………………….. 561

74.2     Austria Climate Change Mitigation & Adaptation Market – 2020-2030………………………………………………….. 562

74.3     Austria Market Dynamics – 2020-2030………………… 562

74.4     Austria Market Share – 2020-2030……………………… 562

75      Belarus Climate Change Mitigation & Adaptation Market – 2020-2030…………………………………………………………… 563

75.1     Belarus Market CEO Takeaway…………………………. 563

75.2     Belarus Climate Change Mitigation & Adaptation Market – 2020-2030………………………………………………….. 564

75.3     Belarus Market Dynamics – 2020-2030……………….. 564

75.4     Belarus Market Share – 2020-2030…………………….. 565

76      Belgium Climate Change Mitigation & Adaptation Market – 2020-2030………………………………………………………… 565

76.1     Belgium Market CEO Takeaway………………………… 565

76.2     Belgium Climate Change Mitigation & Adaptation Market – 2020-2030………………………………………………….. 566

76.3     Belgium Market Dynamics – 2020-2030………………. 567

76.4     Belgium Market Share – 2020-2030……………………. 567

77      Bulgaria Climate Change Mitigation & Adaptation Market – 2020-2030………………………………………………………… 568

77.1     Bulgaria Market CEO Takeaway………………………… 568

77.2     Bulgaria Climate Change Mitigation & Adaptation Market – 2020-2030………………………………………………….. 569

77.3     Bulgaria Market Dynamics – 2020-2030………………. 570

77.4     Bulgaria Market Share – 2020-2030……………………. 570

78      Czech Republic Climate Change Mitigation & Adaptation Market – 2020-2030………………………………………………. 571

78.1     Czech Republic Market CEO Takeaway………………. 571

78.2     Czech Republic Climate Change Mitigation & Adaptation Market – 2020-2030………………………………………… 572

78.3     Czech Republic Market Dynamics – 2020-2030…….. 572

78.4     Czech Republic Market Share – 2020-2030………….. 573

79      Denmark Climate Change Mitigation & Adaptation Market – 2020-2030………………………………………………………… 573

79.1     Denmark Market CEO Takeaway……………………….. 573

79.2     Denmark Climate Change Mitigation & Adaptation Market – 2020-2030………………………………………… 575

79.3     Denmark Market Dynamics – 2020-2030……………… 576

79.4     Denmark Market Share – 2020-2030………………….. 576

80      Finland Climate Change Mitigation & Adaptation Market – 2020-2030…………………………………………………………… 577

80.1     Finland Market CEO Takeaway…………………………. 577

80.2     Finland Climate Change Mitigation & Adaptation Market – 2020-2030………………………………………………….. 578

80.3     Finland Market Dynamics – 2020-2030……………….. 578

80.4     Finland Market Share – 2020-2030…………………….. 579

81      France Climate Change Mitigation & Adaptation Market – 2020-2030…………………………………………………………… 580

81.1     France Market CEO Takeaway………………………….. 580

81.2     France Climate Change Mitigation & Adaptation Market – 2020-2030………………………………………………….. 581

81.3     France Market Dynamics – 2020-2030………………… 582

81.4     France Market Share – 2020-2030……………………… 582

82      Germany Climate Change Mitigation & Adaptation Market – 2020-2030………………………………………………………… 583

82.1     Germany Climate Change Mitigation & Adaptation Market – 2020-2030………………………………………… 587

82.2     Germany Market Dynamics – 2020-2030……………… 587

82.3     Germany Market Share – 2020-2030………………….. 587

83      Greece Climate Change Mitigation & Adaptation Market – 2020-2030…………………………………………………………… 588

83.1     Greece Market CEO Takeaway…………………………. 588

83.2     Greece Climate Change Mitigation & Adaptation Market – 2020-2030………………………………………………….. 589

83.3     Greece Market Dynamics – 2020-2030……………….. 589

83.4     Greece Market Share – 2020-2030…………………….. 589

84      Hungary Climate Change Mitigation & Adaptation Market – 2020-2030………………………………………………………… 590

84.1     Hungary Market CEO Takeaway………………………… 590

84.2     Hungary Climate Change Mitigation & Adaptation Market – 2020-2030………………………………………………….. 591

84.3     Hungary Market Dynamics – 2020-2030………………. 591

84.4     Hungary Market Share – 2020-2030…………………… 591

85      Italy Climate Change Mitigation & Adaptation Market – 2020-2030…………………………………………………………… 592

85.1     Italy Market CEO Takeaway……………………………… 592

85.2     Italy Climate Change Mitigation & Adaptation Market – 2020-2030…………………………………………………….. 594

85.3     Italy Market Dynamics – 2020-2030……………………. 594

85.4     Italy Market Share – 2020-2030…………………………. 594

86      Netherlands Climate Change Mitigation & Adaptation Market – 2020-2030………………………………………………. 595

86.1     Netherlands Market CEO Takeaway…………………… 595

86.2     Netherlands Climate Change Mitigation & Adaptation Market – 2020-2030………………………………………… 596

86.3     Netherlands Market Dynamics – 2020-2030…………. 596

86.4     Netherlands Market Share – 2020-2030………………. 597

87      Norway Climate Change Mitigation & Adaptation Market – 2020-2030…………………………………………………………… 598

87.1     Norway Market CEO Takeaway…………………………. 598

87.2     Norway Climate Change Mitigation & Adaptation Market – 2020-2030………………………………………………….. 599

87.3     Norway Market Dynamics – 2020-2030……………….. 599

87.4     Norway Market Share – 2020-2030…………………….. 600

88      Poland Climate Change Mitigation & Adaptation Market – 2020-2030…………………………………………………………… 601

88.1     Poland Market CEO Takeaway………………………….. 601

88.2     Poland Climate Change Mitigation & Adaptation Market – 2020-2030………………………………………………….. 602

88.3     Poland Market Dynamics – 2020-2030………………… 602

88.4     Poland Market Share – 2020-2030……………………… 603

89      Portugal Climate Change Mitigation & Adaptation Market – 2020-2030………………………………………………………… 604

89.1     Portugal Market CEO Takeaway………………………… 604

89.2     Portugal Climate Change Mitigation & Adaptation Market – 2020-2030………………………………………………….. 605

89.3     Portugal Market Dynamics – 2020-2030………………. 605

89.4     Portugal Market Share – 2020-2030……………………. 605

90      Romania Climate Change Mitigation & Adaptation Market – 2020-2030………………………………………………………… 606

90.1     Romania Market CEO Takeaway……………………….. 606

90.2     Romania Climate Change Mitigation & Adaptation Market – 2020-2030………………………………………… 607

90.3     Romania Market Dynamics – 2020-2030……………… 607

90.4     Romania Market Share – 2020-2030…………………… 607

91      Russia Climate Change Mitigation & Adaptation Market – 2020-2030…………………………………………………………… 608

91.1     Russia Market CEO Takeaway………………………….. 608

91.2     Russia Climate Change Mitigation & Adaptation Market – 2020-2030………………………………………………….. 610

91.3     Russia Market Dynamics – 2020-2030………………… 610

91.4     Russia Market Share – 2020-2030……………………… 610

92      Serbia Climate Change Mitigation & Adaptation Market – 2020-2030…………………………………………………………… 611

92.1     Serbia Market CEO Takeaway…………………………… 611

92.2     Serbia Climate Change Mitigation & Adaptation Market – 2020-2030…………………………………………………….. 612

92.3     Serbia Market Dynamics – 2020-2030…………………. 612

92.4     Serbia Market Share – 2020-2030……………………… 612

93      Slovakia Climate Change Mitigation & Adaptation Market – 2020-2030………………………………………………………… 613

93.1     Slovakia Market CEO Takeaway………………………… 613

93.2     Slovakia Climate Change Mitigation & Adaptation Market – 2020-2030………………………………………………….. 614

93.3     Slovakia Market Dynamics – 2020-2030………………. 614

93.4     Slovakia Market Share – 2020-2030…………………… 614

94      Spain Climate Change Mitigation & Adaptation Market – 2020-2030…………………………………………………………… 615

94.1     Spain Market CEO Takeaway……………………………. 615

94.2     Spain Climate Change Mitigation & Adaptation Market – 2020-2030…………………………………………………….. 616

94.3     Spain Market Dynamics – 2020-2030………………….. 616

94.4     Spain Market Share – 2020-2030………………………. 617

95      Sweden Climate Change Mitigation & Adaptation Market – 2020-2030………………………………………………………… 618

95.1     Sweden Market CEO Takeaway………………………… 618

95.2     Sweden Climate Change Mitigation & Adaptation Market – 2020-2030………………………………………………….. 620

95.3     Sweden Market Dynamics – 2020-2030………………. 620

95.4     Sweden Market Share – 2020-2030……………………. 620

96      Switzerland Climate Change Mitigation & Adaptation Market – 2020-2030………………………………………………. 621

96.1     Switzerland Market CEO Takeaway……………………. 621

96.2     Switzerland Climate Change Mitigation & Adaptation Market – 2020-2030………………………………………… 622

96.3     Switzerland Market Dynamics – 2020-2030………….. 622

96.4     Switzerland Market Share – 2020-2030……………….. 622

97      UK Climate Change Mitigation & Adaptation Market – 2020-2030…………………………………………………………… 623

97.1     UK Market CEO Takeaway……………………………….. 623

97.2     UK Climate Change Mitigation & Adaptation Market – 2020-2030…………………………………………………….. 625

97.3     UK Market Dynamics – 2020-2030……………………… 625

97.4     UK Market Share – 2020-2030………………………….. 625

98      Ukraine Climate Change Mitigation & Adaptation Market – 2020-2030…………………………………………………………… 626

98.1     Ukraine Market CEO Takeaway…………………………. 626

98.2     Ukraine Climate Change Mitigation & Adaptation Market – 2020-2030………………………………………………….. 627

98.3     Ukraine Market Dynamics – 2020-2030……………….. 627

98.4     Ukraine Market Share – 2020-2030…………………….. 627

99      Rest of Europe Climate Change Mitigation & Adaptation Market – 2020-2030………………………………………………. 628

99.1     Rest of Europe Climate Change Mitigation & Adaptation Market – 2020-2030………………………………………… 628

99.2     Rest of Europe Market Dynamics – 2020-2030……… 628

99.3     Rest of Europe Market Share – 2020-2030…………… 628

APPENDICES…………………………………………………………….. 635

100    Appendix A: Glossary………………………………………….. 635

101    Appendix B: Abbreviations…………………………………… 653

102    Research Methodology………………………………………… 658

102.1  Report Structure…………………………………………….. 658

102.2  Methodology………………………………………………….. 658

102.3  For Whom is this Report?…………………………………. 659

103    Disclaimer and Copyright……………………………………… 660


Tables

Table 1 – Electricity Production by Country – 2020……………………….. 58

Table 2 – Energy & Electricity and Per Capita Consumption by Country / Region……………………………………………………………… 59

Table 3 – Renewable vs. Fossil Fuels Heating Efficiency Cost [$ Cent / KWh] – 2020 & 2030 F…………………………………………. 67

Table 4 – Europe Climate Change Mitigation & Adaptation Market by Technology [$B] – 2022-2030………………………………… 72

Table 5 – Europe Climate Change Mitigation & Adaptation Market by Sector [$B] – 2022-2030………………………………………. 74

Table 6 – Europe Climate Change Mitigation & Adaptation Market by Revenue [$B] – 2020-2030……………………………………. 75

Table 7 – Europe Climate Change Mitigation & Adaptation Market by Country [$B] – 2020-2030…………………………………….. 76

Table 8 – Europe Climate Change Mitigation & Adaptation Technology Products & Services [$B] Markets – 2022-2030…………. 99

Table 9 – Europe Climate Change Mitigation & Adaptation Markets Annual Growth Rates [%] – 2022-2030…………………… 100

Table 10 – Europe Climate Change Mitigation & Adaptation Products & Services Markets Shares [%] – 2022-2030……………… 102

Table 11 – Europe Biological Carbon Capture & Sequestration Market Size [$B] – 2022-2030………………………………………… 108

Table 12 – Europe Biological Carbon Capture & Sequestration Market Dynamics [%] – 2022-2030………………………………….. 109

Table 13 – Europe Warming Mitigation Market, Biological Carbon Capture & Sequestration Market Share [%] – 2022-2030                                                                                  109

Table 14 – Europe Carbon Capture & Storage Market Size [$B] – 2022-2030………………………………………………………………. 115

Table 15 – Europe Carbon Capture & Storage Market Dynamics [%] – 2022-2030……………………………………………………….. 115

Table 16 – Europe Warming Mitigation Market, Carbon Capture & Storage Market Share [%] – 2022-2030………………….. 116

Table 17 – Europe Carbon Capture & Utilization Market Size [$B] – 2022-2030……………………………………………………….. 123

Table 18 – Europe Carbon Capture & Utilization Market Dynamics [%] – 2022-2030……………………………………………………….. 124

Table 19 – Europe Warming Mitigation Market, Carbon Capture & Utilization Market Share [%] – 2022-2030………………… 124

Table 20 – Europe Methane Abatement Market Size [$B] – 2022-2030                                                                                  132

Table 21 – Europe Methane Abatement Market Dynamics [%] – 2022-2030………………………………………………………………. 133

Table 22 – Europe Warming Mitigation Market, Methane Abatement Market Share [%] – 2022-2030……………………………… 133

Table 23 – Europe Geothermal Power Generation Market Size [$B] – 2022-2030……………………………………………………….. 141

Table 24 – Europe Geothermal Power Generation Market Dynamics [%] – 2022-2030……………………………………………………… 141

Table 25 – Europe Warming Mitigation Market, Geothermal Power Generation Market Share [%] – 2022-2030……………… 142

Table 26 – Cost (Euro/MWh) of Domestic Heating in France………… 146

Table 27 – Cost (Euro/MW) of District Heating in France……………… 147

Table 28 – Europe Direct Geothermal Heating & Cooling Market Size [$B] – 2022-2030……………………………………………….. 147

Table 29 – Europe Direct Geothermal Heating & Cooling Market Dynamics [%] – 2022-2030………………………………….. 148

Table 30 – Europe Warming Mitigation Market, Direct Geothermal Heating & Cooling Market Share [%] – 2022-2030…….. 148

Table 31 – Europe Marine Power Market Size [$B] – 2022-2030……. 154

Table 32 – Europe Marine Power Market Dynamics [%] – 2022-2030 154

Table 33 – Europe Warming Mitigation Market, Marine Power Market Share [%] – 2022-2030……………………………………….. 155

Table 34 – Europe Solar PV (Utility Scale) Market Size [$B] – 2022-2030                                                                                  162

Table 35 – Europe Solar PV (Utility Scale) Market Dynamics [%] – 2022-2030………………………………………………………………. 163

Table 36 – Europe Warming Mitigation Market, Solar PV (Utility Scale) Market Share [%] – 2022-2030……………………………… 163

Table 37 – Europe Rooftop Solar PV Market Size [$B] – 2022-2030.. 166

Table 38 – Europe Rooftop Solar PV Market Dynamics [%] – 2022-2030                                                                                  167

Table 39 – Europe Warming Mitigation Market, Rooftop Solar PV Market Share [%] – 2022-2030……………………………………….. 167

Table 40 – Europe Concentrating Solar Power (CSP) Market Size [$B] – 2022-2030……………………………………………………….. 172

Table 41 – Europe Concentrating Solar Power (CSP) Market Dynamics [%] – 2022-2030………………………………………………… 173

Table 42 – Europe Warming Mitigation Market, Concentrating Solar Power (CSP) Market Share [%] – 2022-2030……………. 173

Table 43 – Europe Hydroelectric Power Market Size [$B] – 2022-2030                                                                                  179

Table 44 – Europe Hydroelectric Power Market Dynamics [%] – 2022-2030………………………………………………………………. 179

Table 45 – Europe Warming Mitigation Market, Hydroelectric Power Market Share [%] – 2022-2030……………………………… 180

Table 46 – Europe Small Nuclear Reactors Market Size [$B] – 2022-2030………………………………………………………………. 184

Table 47 – Europe Small Nuclear Reactors Market Dynamics [%] – 2022-2030……………………………………………………….. 184

Table 48 – Europe Warming Mitigation Market, Small Nuclear Reactors Market Share [%] – 2022-2030……………………………… 185

Table 49 – Europe Nuclear Energy Plants > 1 GW Market Size [$B] – 2022-2030……………………………………………………….. 189

Table 50 – Europe Nuclear Energy Plants > 1 GW Market Dynamics [%] – 2022-2030……………………………………………………… 189

Table 51 – Europe Warming Mitigation Market, Nuclear Energy Plants > 1 GW Market Share [%] – 2022-2030…………………….. 190

Table 52 – Europe Waste to Energy Plants Market Size [$B] – 2022-2030………………………………………………………………. 194

Table 53 – Europe Waste to Energy Plants Market Dynamics [%] – 2022-2030……………………………………………………….. 194

Table 54 – Europe Warming Mitigation Market, Waste to Energy Plants Market Share [%] – 2022-2030……………………………… 195

Table 55 – Europe Offshore Wind Power Market Size [$B] – 2022-2030                                                                                  204

Table 56 – Europe Offshore Wind Power Market Dynamics [%] – 2022-2030………………………………………………………………. 205

Table 57 – Europe Warming Mitigation Market, Offshore Wind Power Market Share [%] – 2022-2030……………………………… 205

Table 58 – Europe Onshore Wind Power Market Size [$B] – 2022-2030                                                                                  210

Table 59 – Europe Onshore Wind Power Market Dynamics [%] – 2022-2030………………………………………………………………. 210

Table 60 – Europe Warming Mitigation Market, Onshore Wind Power Market Share [%] – 2022-2030……………………………… 211

Table 61 – Energy Production from Solid Biofuels and Renewable Waste (MW) by Ten Leading Countries………………….. 214

Table 62 – Europe Bioenergy Market Size [$B] – 2022-2030…………. 226

Table 63 – Europe Bioenergy Market Dynamics [%] – 2022-2030….. 226

Table 64 – Europe Warming Mitigation Market, Bioenergy Market Share [%] – 2022-2030………………………………………………… 226

Table 65 – Europe Other Renewable Energy Market Size [$B] – 2022-2030………………………………………………………………. 227

Table 66 – Europe Other Renewable Energy Market Dynamics [%] – 2022-2030……………………………………………………….. 227

Table 67 – Europe Warming Mitigation Market, Other Renewable Energy Market Share [%] – 2022-2030…………………… 228

Table 68 – Europe Grid-Scale Battery Storage Market Size [$B] – 2022-2030………………………………………………………………. 235

Table 69 – Europe Grid-Scale Battery Storage Market Dynamics [%] – 2022-2030……………………………………………………….. 236

Table 70 – Europe Warming Mitigation Market, Grid-Scale Battery Storage Market Share [%] – 2022-2030………………….. 236

Table 71 – Europe Thermal Energy Storage Market Size [$B] – 2022-2030………………………………………………………………. 242

Table 72 – Europe Thermal Energy Storage Market Dynamics [%] – 2022-2030……………………………………………………….. 242

Table 73 – Europe Warming Mitigation Market, Thermal Energy Storage Market Share [%] – 2022-2030……………………………… 243

Table 74 – Europe Compressed-Air Storage Market Size [$B] – 2022-2030………………………………………………………………. 247

Table 75 – Europe Compressed-Air Storage Market Dynamics [%] – 2022-2030……………………………………………………….. 248

Table 76 – Europe Warming Mitigation Market, Compressed-Air Storage Market Share [%] – 2022-2030……………………………… 248

Table 77 – Europe Hydroelectric Energy Storage Market Size [$B] – 2022-2030……………………………………………………….. 254

Table 78 – Europe Hydroelectric Energy Storage Market Dynamics [%] – 2022-2030……………………………………………………….. 255

Table 79 – Europe Warming Mitigation Market, Hydroelectric Energy Storage Market Share [%] – 2022-2030………………….. 255

Table 80 – Europe Other Energy Storage Modalities Market Size [$B] – 2022-2030……………………………………………………….. 256

Table 81 – Europe Other Energy Storage Modalities Market Dynamics [%] – 2022-2030………………………………………………… 256

Table 82 – Europe Warming Mitigation Market, Other Energy Storage Modalities Market Share [%] – 2022-2030……………….. 257

Table 83 – Europe Green Cement Market Size [$B] – 2022-2030…… 264

Table 84 – Europe Green Cement Market Dynamics [%] – 2022-2030                                                                                  264

Table 85 – Europe Warming Mitigation Market, Green Cement Market Share [%] – 2022-2030……………………………………….. 265

Table 86 – Europe Green Steel Market Size [$B] – 2022-2030………. 269

Table 87 – Europe Green Steel Market Dynamics [%] – 2022-2030… 270

Table 88 – Europe Warming Mitigation Market, Green Steel Market Share [%] – 2022-2030……………………………………….. 270

Table 89 – Cost Assumptions Under 2 Innovation Scenarios…………. 272

Table 90 – Europe Low Carbon Fuels Manufacturing Plants Market Size [$B] – 2022-2030……………………………………………….. 277

Table 91 – Europe Low Carbon Fuels Manufacturing Plants Market Dynamics [%] – 2022-2030………………………………….. 278

Table 92 – Europe Warming Mitigation Market, Low Carbon Fuels Manufacturing Plants Market Share [%] – 2022-2030…. 278

Table 93 – Europe Energy-Efficient Air Conditioning & Refrigeration (ACR) Market Size [$B] – 2022-2030……………………… 285

Table 94 – Europe Energy-Efficient Air Conditioning & Refrigeration (ACR) Market Dynamics [%] – 2022-2030……………….. 285

Table 95 – Europe Warming Mitigation Market, Energy-Efficient Air Conditioning & Refrigeration (ACR) Market Share [%] – 2022-2030……………………………………………………….. 286

Table 96 – Europe Energy-Efficient Electric Appliances (w/o ACR) Market Size [$B] – 2022-2030………………………………. 291

Table 97 – Europe Energy-Efficient Electric Appliances (w/o ACR) Market Dynamics [%] – 2022-2030………………………… 292

Table 98 – Europe Warming Mitigation Market, Energy-Efficient Electric Appliances (w/o ACR) Market Share [%] – 2022-2030.. 292

Table 99 – Europe Air Sourced Heat Pumps Market Size [$B] – 2022-2030………………………………………………………………. 302

Table 100 – Europe Air Sourced Heat Pumps Market Dynamics [%] – 2022-2030……………………………………………………….. 302

Table 101 – Europe Warming Mitigation Market, Air Sourced Heat Pumps Market Share [%] – 2022-2030……………………. 302

Table 102 – Europe Direct Solar Water Heating Market Size [$B] – 2022-2030……………………………………………………….. 307

Table 103 – Europe Direct Solar Water Heating Market Dynamics [%] – 2022-2030……………………………………………………….. 308

Table 104 – Europe Warming Mitigation Market, Direct Solar Water Heating Market Share [%] – 2022-2030…………………… 308

Table 105 – Europe Passenger BEV Cars Market Size [$B] – 2022-2030                                                                                  319

Table 106 – Europe Passenger BEV Cars Market Dynamics [%] – 2022-2030………………………………………………………………. 320

Table 107 – Europe Warming Mitigation Market, Passenger BEV Cars Market Share [%] – 2022-2030……………………………… 320

Table 108 – Europe Two & Three-Wheeler BEVs Market Size [$B] – 2022-2030……………………………………………………….. 322

Table 109 – Europe Two & Three-Wheeler BEVs Market Dynamics [%] – 2022-2030……………………………………………………….. 323

Table 110 – Europe Warming Mitigation Market, Two & Three-Wheeler BEVs Market Share [%] – 2022-2030……………………… 323

Table 111 – Europe Freight BEVs Market Size [$B] – 2022-2030…… 326

Table 112 – Europe Freight BEVs Market Dynamics [%] – 2022-2030                                                                                  327

Table 113 – Europe Warming Mitigation Market, Freight BEVs Market Share [%] – 2022-2030……………………………………….. 327

Table 114 – Europe Electric Buses Market Size [$B] – 2022-2030….. 333

Table 115 – Europe Electric Buses Market Dynamics [%] – 2022-2030                                                                                  333

Table 116 – Europe Warming Mitigation Market, Electric Buses Market Share [%] – 2022-2030……………………………………….. 333

Table 117 – Europe Other BEVs Market Size [$B] – 2022-2030…….. 341

Table 118 – Europe Other BEVs Market Dynamics [%] – 2022-2030. 342

Table 119 – Europe Warming Mitigation Market, Other BEVs Market Share [%] – 2022-2030……………………………………….. 342

Table 120 – Europe EV Charging Systems Market Size [$B] – 2022-2030………………………………………………………………. 351

Table 121 – Europe EV Charging Systems Market Dynamics [%] – 2022-2030……………………………………………………….. 352

Table 122 – Europe Warming Mitigation Market, EV Charging Systems Market Share [%] – 2022-2030……………………………… 352

Table 123 – Europe Hydrogen Vehicles Market Size [$B] – 2022-2030                                                                                  361

Table 124 – Europe Hydrogen Vehicles Market Dynamics [%] – 2022-2030………………………………………………………………. 362

Table 125 – Europe Warming Mitigation Market, Hydrogen Vehicles Market Share [%] – 2022-2030……………………………… 362

Table 126 – Electrolyzer Technologies Comparison……………………. 363

Table 127 – Hydrogen Color Codes of Hydrogen Manufacturing……. 366

Table 128 – Types of Electrolysers………………………………………….. 367

Table 129 – Europe Hydrogen Electrolyzers Market Size [$B] – 2022-2030………………………………………………………………. 368

Table 130 – Europe Hydrogen Electrolyzers Market Dynamics [%] – 2022-2030……………………………………………………….. 368

Table 131 – Europe Warming Mitigation Market, Hydrogen Electrolyzers Market Share [%] – 2022-2030……………………………… 369

Table 132 – Europe Hydrogen Fueling Infrastructure Market Size [$B] – 2022-2030……………………………………………………….. 374

Table 133 – Europe Hydrogen Fueling Infrastructure Market Dynamics [%] – 2022-2030………………………………………………… 374

Table 134 – Europe Warming Mitigation Market, Hydrogen Fueling Infrastructure Market Share [%] – 2022-2030…………… 375

Table 135 – Color Codes by Hydrogen Manufacturing Process……… 378

Table 136 – Comparative Table for Fossil Derived Hydrogen Production Pathways………………………………………………………… 380

Table 137 – Europe Green Hydrogen Production Market Size [$B] – 2022-2030……………………………………………………….. 383

Table 138 – Europe Green Hydrogen Production Market Dynamics [%] – 2022-2030……………………………………………………….. 384

Table 139 – Europe Warming Mitigation Market, Green Hydrogen Production Market Share [%] – 2022-2030………………. 384

Table 140 – Europe Precision Agriculture Market Size [$B] – 2022-2030                                                                                  392

Table 141 – Europe Precision Agriculture Market Dynamics [%] – 2022-2030………………………………………………………………. 392

Table 142 – Europe Warming Mitigation Market, Precision Agriculture Market Share [%] – 2022-2030……………………………… 393

Table 143 – Europe Regenerative Agriculture Market Size [$B] – 2022-2030………………………………………………………………. 397

Table 144 – Europe Regenerative Agriculture Market Dynamics [%] – 2022-2030……………………………………………………….. 398

Table 145 – Europe Warming Mitigation Market, Regenerative Agriculture Market Share [%] – 2022-2030………………. 398

Table 146 – Europe Climate Adapted Agriculture Market Size [$B] – 2022-2030……………………………………………………….. 406

Table 147 – Europe Climate Adapted Agriculture Market Dynamics [%] – 2022-2030……………………………………………………….. 406

Table 148 – Europe Warming Mitigation Market, Climate Adapted Agriculture Market Share [%] – 2022-2030………………. 407

Table 149 – Europe Reforestation Market Size [$B] – 2022-2030…… 417

Table 150 – Europe Reforestation Market Dynamics [%] – 2022-2030                                                                                  418

Table 151 – Europe Warming Mitigation Market, Reforestation Market Share [%] – 2022-2030……………………………………….. 418

Table 152 – Europe Bioremediation Market Size [$B] – 2022-2030… 427

Table 153 – Europe Bioremediation Market Dynamics [%] – 2022-2030                                                                                  427

Table 154 – Europe Warming Mitigation Market, Bioremediation Market Share [%] – 2022-2030……………………………………….. 427

Table 155 – Europe Climate Adapted Water Infrastructure Market Size [$B] – 2022-2030……………………………………………….. 444

Table 156 – Europe Climate Adapted Water Infrastructure Market Dynamics [%] – 2022-2030………………………………….. 444

Table 157 – Europe Warming Mitigation Market, Climate Adapted Water Infrastructure Market Share [%] – 2022-2030…………… 445

Table 158 – Europe Water Redeemable Systems Market Size [$B] – 2022-2030……………………………………………………….. 452

Table 159 – Europe Water Redeemable Systems Market Dynamics [%] – 2022-2030……………………………………………………… 452

Table 160 – Europe Warming Mitigation Market, Water Redeemable Systems Market Share [%] – 2022-2030…………………. 453

Table 161 – Europe Desalination Plants Market Size [$B] – 2022-2030                                                                                  464

Table 162 – Europe Desalination Plants Market Dynamics [%] – 2022-2030………………………………………………………………. 465

Table 163 – Europe Warming Mitigation Market, Desalination Plants Market Share [%] – 2022-2030……………………………… 465

Table 164 – Europe Precision Irrigation Market Size [$B] – 2022-2030                                                                                  469

Table 165 – Europe Precision Irrigation Market Dynamics [%] – 2022-2030………………………………………………………………. 470

Table 166 – Europe Warming Mitigation Market, Precision Irrigation Market Share [%] – 2022-2030……………………………… 470

Table 167 – Europe Passive Green Buildings Market Size [$B] – 2022-2030………………………………………………………………. 475

Table 168 – Europe Passive Green Buildings Market Dynamics [%] – 2022-2030……………………………………………………….. 476

Table 169 – Europe Warming Mitigation Market, Passive Green Buildings Market Share [%] – 2022-2030………………… 476

Table 170 – Europe Floods Control Market Size [$B] – 2022-2030…. 482

Table 171 – Europe Floods Control Market Dynamics [%] – 2022-2030                                                                                  483

Table 172 – Europe Warming Mitigation Market, Floods Control Market Share [%] – 2022-2030……………………………………….. 483

Table 173 – Europe Wildfire Mitigation Market Size [$B] – 2022-2030 486

Table 174 – Europe Wildfire Mitigation Market Dynamics [%] – 2022-2030………………………………………………………………. 487

Table 175 – Europe Warming Mitigation Market, Wildfire Mitigation Market Share [%] – 2022-2030……………………………… 487

Table 176 – Europe Weather Monitoring, Modeling & Forecasting Market Size [$B] – 2022-2030………………………………. 491

Table 177 – Europe Weather Monitoring, Modeling & Forecasting Market Dynamics [%] – 2022-2030………………………… 492

Table 178 – Europe Warming Mitigation Market, Weather Monitoring, Modeling & Forecasting Market Share [%] – 2022-2030 492

Table 179 – Europe Extreme Weather Public Warning Systems Market Size [$B] – 2022-2030………………………………………… 501

Table 180 – Europe Extreme Weather Public Warning Systems Market Dynamics [%] – 2022-2030………………………………….. 502

Table 181 – Europe Warming Mitigation Market, Extreme Weather Public Warning Systems Market Share [%] – 2022-2030                                                                                  502

Table 182 – Europe Big Data & AI Market Size [$B] – 2022-2030…… 506

Table 183 – Europe Big Data & AI Market Dynamics [%] – 2022-2030                                                                                  507

Table 184 – Europe Warming Mitigation Market, Big Data & AI Market Share [%] – 2022-2030……………………………………….. 507

Table 185 – Europe Cybersecurity Market Size [$B] – 2022-2030….. 512

Table 186 – Europe Cybersecurity Market Dynamics [%] – 2022-2030                                                                                  512

Table 187 – Europe Warming Mitigation Market, Cybersecurity Market Share [%] – 2022-2030……………………………………….. 512

Table 188 – Europe ICT (w/o Cyber, AI, Big Data) Market Size [$B] – 2022-2030……………………………………………………….. 515

Table 189 – Europe ICT (w/o Cyber, AI, Big Data) Market Dynamics [%] – 2022-2030……………………………………………………… 516

Table 190 – Europe Warming Mitigation Market, ICT (w/o Cyber, AI, Big Data) Market Share [%] – 2022-2030……………………… 516

Table 191 – Europe GHG Emission Tracking Market Size [$B] – 2022-2030………………………………………………………………. 523

Table 192 – Europe GHG Emission Tracking Market Dynamics [%] – 2022-2030……………………………………………………….. 525

Table 193 – Europe Warming Mitigation Market, GHG Emission Tracking Market Share [%] – 2022-2030…………………. 525

Table 194 – Europe Grid Modernization Market Size [$B] – 2022-2030                                                                                  533

Table 195 – Europe Grid Modernization Market Dynamics [%] – 2022-2030………………………………………………………………. 534

Table 196 – Europe Warming Mitigation Market, Grid Modernization Market Share [%] – 2022-2030……………………………… 534

Table 197 –Other Europe Warming Mitigation Markets Size [$B] – 2022-2030………………………………………………………………. 535

Table 198 – Europe Other Europe Warming Mitigation Markets Market Dynamics [%] – 2022-2030………………………………….. 536

Table 199 – Europe Warming Mitigation Market, Other Europe Warming Mitigation Markets Market Share [%] – 2022-2030…….. 536

Table 200 – Climate Change Mitigation & Adaptation Market by Sector [$B] – 2022-2030………………………………………………. 539

Table 201 – Europe Climate Change Mitigation & Adaptation Market Size [$M] by Revenue Source – 2020-2030…………….. 543

Table 202 – Europe Climate Change Mitigation & Adaptation Market AGRs [%] by Revenue Source – 2020-2030……………. 544

Table 203 – Europe Climate Change Mitigation & Adaptation Technologies Market Size [$B] By Country – 2020-2030                                                                                  546

Table 204 – Europe Climate Change Mitigation & Adaptation Market AGRs [%] By Country – 2020-2030……………………….. 547

Table 205 – National Market Shares of the Europe Climate Change Mitigation & Adaptation Market [%] – 2020-2030………. 549

Table 206 – Europe Climate Change Mitigation & Adaptation Infrastructure Markets Size [$B] By Country – 2020-2030                                                                                  552

Table 207 – Europe Climate Change Mitigation & Adaptation Products Sales [$B] By Country – 2020-2030………………………. 554

Table 208 – Europe Climate Change Mitigation & Adaptation Maintenance Markets Size [$B] By Country – 2020-2030                                                                                  555

Table 209 – Europe Climate Change Mitigation & Adaptation Upgrades Markets Size [$B] By Country – 2020-2030…………….. 557

Table 210 – Europe Climate Change Mitigation & Adaptation Other* Revenue Sources [$B] By Country – 2020-2030………. 559

Figures

Figure 1 – COP26 Pledges & Targets Based GHG Emission [GTn] Forecast to 2030………………………………………………… 56

Figure 2 – Europe Warming 2010-2020 by GHG Source………………… 57

Figure 3 – Renewable Energy Generation By Technology & By User.. 59

Figure 4 – Greenhouse Gas Emissions [%] by Sector……………………. 60

Figure 5 – Climate Change Causes and Effects…………………………… 61

Figure 6- Europe Energy demand (left) & GHS Emission (Right) By Sector – 2020…………………………………………………….. 62

Figure 7 – GHG Emission per GWh of Energy Production – 2020…….. 63

Figure 8 – Average USA Levelized cost [$/MWh] of Electricity By Energy Technology – 2020……………………………………. 63

Figure 9 – Renewable Electricity Generation by Technology and Region                                                                                    64

Figure 10 – Europe Electricity Consumption by Energy Source – 1985-2020………………………………………………………………… 64

Figure 11 – Levelized Cost [$/MWh] of Energy, by Source – 2008-2020                                                                                    64

Figure 12 – Renewable, Nuclear & Fossil Energy Prices [$/MWh] & Installed Capacity – 2010-2019……………………………… 65

Figure 13 – Europe Warming vs. Number of Climate-Related Disasters – 1970-2032…………………………………………………………. 67

Figure 14 – Energy Storage: Duration Time and Rated Power by Modality……………………………………………………………. 67

Figure 15 – Renewable Generation Capacity By Region………………… 68

Figure 16- Leading Renewable Energy Capacity [GW] by Country – 2020………………………………………………………………… 68

Figure 17 – Negative Emissions Role in Achieving NetZero……………. 68

Figure 18 – Europe GHG Emission Reduction [%] by Technology – 2030                                                                                    73

Figure 19 – Europe Electricity Generation [000 TWh] by Source – 2010- 2040………………………………………………………………… 75

Figure 20 – Bioenergy with Carbon Capture & Sequestration………… 112

Figure 21 – Microalgae Based Biological Carbon Capture……………. 112

Figure 22- Marine Bacteria Carbon Sequestration……………………… 113

Figure 23 – Microalgae Carbon Biological Capture & Utilization Footprint                                                                                  114

Figure 24 – Europe Biological Carbon Capture & Sequestration Market Size [$B] – 2022-2030………………………………………… 117

Figure 25 – The CCS Process………………………………………………… 118

Figure 26 – Carbon Capture and Storage Value Chain………………… 118

Figure 27 – Europe Carbon Capture & Storage Market Size [$B] – 2022-2030………………………………………………………………. 123

Figure 28 – CCU Applications Roadmap…………………………………… 125

Figure 29 – Carbon Capture & Utilization and Removal Cycle………. 126

Figure 30 – Carbon Capture & Utilization Removal Pathways……….. 126

Figure 31 – CCU Potential and Cost Of Various Sub-Pathways Outlook – 2050………………………………………………………………. 128

Figure 32 – Europe Carbon Capture & Utilization Market Size [$B] – 2022-2030……………………………………………………….. 132

Figure 33 – Ultra Emitting Methane Events 2019-2020………………… 133

Figure 34 – Methane Emission Sources (Left) & 1990-2050 Emissions (Right)…………………………………………………………….. 134

Figure 35 – 2020-2030 Human Caused Methane Emissions and Identified Mitigation Potential by Sectors………………… 135

Figure 36 – Emissions Abatement and Negative Emissions Infrastructure……………………………………………………. 138

Figure 37 – Europe GHG Abatement Cost Beyond BAU- 2030………. 139

Figure 38 – Europe Methane Abatement Market Size [$B] – 2022-2030                                                                                  140

Figure 39 – Europe Average Levelized Cost of Energy Generation [$/MWh] Geothermal vs. Other Electric Power Sources – Q-4 2021…………………………………………………………. 142

Figure 40 – Geothermal Electricity Generation Technologies……… 143

Figure 41 – Europe LCOEs From Newly Commissioned, Utility-Scale Renewable Power Generation Technologies, 2010-2020                                                                                  143

Figure 42 – Enhanced Geothermal Systems……………………………… 144

Figure 43 – Geothermal Power Generation……………………………….. 145

Figure 44 – Map of 64 EGS Projects Around the World – 2020………. 147

Figure 45 – Europe Geothermal Power Generation Market Size [$B] – 2022-2030……………………………………………………….. 149

Figure 46 – Applications of Direct Utilization of Geothermal Energy… 152

Figure 47 – Closed (Left) & Open (Right) loop Geothermal Heat Pumps                                                                                  153

Figure 48 – EU Areas Suitable for Geothermal Networks & Actual Geothermal Installed Capacity……………………………… 154

Figure 49 – Europe Direct Geothermal Heating & Cooling Market Size [$B] – 2022-2030……………………………………………….. 155

Figure 50 – Europe LCOEs From Newly Commissioned, Utility-Scale Renewable Power Generation Technologies, 2010-2020                                                                                  157

Figure 51 – Ocean thermal energy Conversion System (Right) and Oscillating Water Column System (Left)…………………. 158

Figure 52 – Wave Power System……………………………………………. 161

Figure 53 – Europe Marine Power Market Size [$B] – 2022-2030…… 162

Figure 54 – Installed Base of Solar PV by Country……………………… 164

Figure 55 – Europe Average Levelized Cost of Energy Generation [$/MWh] Solar PV vs. Other Electric Power Sources – Q-4 2021………………………………………………………………. 165

Figure 56 – Europe LCOEs From Newly Commissioned, Utility-Scale Renewable Power Generation Technologies, 2010-2020                                                                                  166

Figure 57 – Ground Mounted Solar PV System………………………….. 167

Figure 58 -The DOE Solar PV Deployment [GW] Outlook 2020-2050 168

Figure 59 – Europe Solar PV (Utility Scale) Market Size [$B] – 2022-2030………………………………………………………………. 170

Figure 60 – Europe Average Levelized Cost of Energy Generation [$/MWh] Rooftop Solar vs. Other Electric Power Sources – Q-4 2021…………………………………………………………. 172

Figure 61 – Europe Rooftop Solar PV Market Size [$B] – 2022-2030. 175

Figure 62 – Europe Average Levelized Cost of Energy Generation [$/MWh] Concentrating Solar Power vs. Other Electric Power Sources – Q-4 2021………………………………….. 176

Figure 63 – Concentrating Solar Power System Layout and Costs…. 177

Figure 64 – Europe LCOEs From Newly Commissioned, Utility-Scale Renewable Power Generation Technologies, 2010-2020                                                                                  178

Figure 65 – Europe Concentrating Solar Power (CSP) Market Size [$B] – 2022-2030……………………………………………………… 180

Figure 66 – Hydropower Installed Capacity by Country………………… 182

Figure 67 – Europe Average Levelized Cost of Energy Generation [$/MWh] Hydropower vs. Other Electric Power Sources – Q-4 2021…………………………………………………………. 183

Figure 68 – Europe LCOEs From Newly Commissioned, Utility-Scale Renewable Power Generation Technologies, 2010-2020                                                                                  183

Figure 69 – Hydropower Generation [TW h] by Region -1965-2020… 184

Figure 70- A Hydropower Plant………………………………………………. 186

Figure 71 – Europe Hydroelectric Power Market Size [$B] – 2022-2030                                                                                  187

Figure 72 – Europe Average Levelized Cost of Energy Generation [$/MWh] Small Nuclear Reactors vs. Other Electric Power Sources – Q-4 2021……………………………………………. 189

Figure 73 – Europe LCOEs From Newly Commissioned, Utility-Scale Renewable Power Generation Technologies, 2010-2020                                                                                  190

Figure 74 – Europe Small Nuclear Reactors Market Size [$B] – 2022-2030………………………………………………………………. 192

Figure 75 – Europe Average Levelized Cost of Energy Generation [$/MWh] Nuclear Energy Plants vs. Other Electric Power Sources – Q-4 2021……………………………………………. 194

Figure 76 – Europe LCOEs From Newly Commissioned, Utility-Scale Renewable Power Generation Technologies, 2010-2020                                                                                  195

Figure 77 – Europe Nuclear Energy Plants > 1 GW Market Size [$B] – 2022-2030……………………………………………………….. 197

Figure 78 – Waste Management Process…………………………………. 199

Figure 79 – UN Projection of the Europe Waste [M Ton/Annum] Quantity – 1950-2050…………………………………………………….. 200

Figure 80 – Europe Waste to Energy Plants Market Size [$B] – 2022-2030………………………………………………………………. 202

Figure 81 – Europe Average Levelized Cost of Energy Generation [$/MWh] Offshore Wind vs. Other Electric Power Sources – Q-4 2021…………………………………………………………. 204

Figure 82 – Wind Turbine Power and Size 1985-2030…………………. 205

Figure 83 – Europe LCOEs from Newly Commissioned, Utility-Scale Renewable Power Generation Technologies, 2010-2020                                                                                  205

Figure 84 – U.S. DOE Offshore Wind Energy 2030 Goals…………….. 208

Figure 85- Europe Installed Base Power [MW] of Offshore Wind Power to 2020……………………………………………………………. 208

Figure 86 – Annual 2001-2021 Additional Offshore Wind Installed Capacity [GW] China vs. the Rest of World……………… 209

Figure 87 – Europe Offshore Wind Power Market Size [$B] – 2022-2030                                                                                  213

Figure 88 – Onshore Wind Turbines LCOE, Size, Capacity & Impacts – 2030………………………………………………………………. 214

Figure 89 – Europe Average Levelized Cost of Energy Generation [$/MWh] Onshore Wind Power vs. Other Electric Power Sources – Q-4 2021……………………………………………. 215

Figure 90 – Europe LCOEs From Newly Commissioned, Utility-Scale Renewable Power Generation Technologies, 2010-2020                                                                                  215

Figure 91 – Europe Onshore Wind Power Market Size [$B] – 2022-2030                                                                                  218

Figure 92 – Europe LCOEs From Newly Commissioned, Utility-Scale Renewable Power Generation Technologies, 2010-2020                                                                                  221

Figure 93 – Bioenergy Thermo-Chemical Process………………………. 224

Figure 94 – Bioenergy Bio-Chemical Process…………………………….. 225

Figure 95 – Europe Bioenergy Market Size [$B] – 2022-2030……….. 234

Figure 96 – Europe Other Renewable Energy Market Size [$B] – 2022-2030………………………………………………………………. 235

Figure 97 – System Power Rating and Discharge Times of Energy Storage Technologies………………………………………… 237

Figure 98 – Grid Battery Storage Infrastructure………………………….. 238

Figure 99 – Next Generation Battery Storage Goals…………………… 239

Figure 100 – Grid-Scale Battery Storage System……………………….. 239

Figure 101 – Europe Grid-Scale Battery Storage Market Size [$B] – 2022-2030……………………………………………………….. 244

Figure 102 – System Power Rating and Discharge Times Of Energy Storage Technologies………………………………………… 245

Figure 103 – Thermal Energy Storage (TES) System Layout………… 246

Figure 104 – Residential Thermal Energy Storage……………………… 247

Figure 105 – Europe Thermal Energy Storage Market Size [$B] – 2022-2030………………………………………………………………. 250

Figure 106 – System Power Rating and Discharge Times of Energy Storage Technologies………………………………………… 252

Figure 107 – Compressed-Air Energy Storage System………………… 253

Figure 108 – A Small Scale Compressed Air Storage System……….. 253

Figure 109 – Europe Compressed-Air Storage Market Size [$B] – 2022-2030………………………………………………………………. 255

Figure 110 – Pumped Storage Hydropower Site…………………………. 257

Figure 111 – Pumped Hydro Energy Storage, Power Rating and Discharge Times Vs. Other Energy Storage Technologies                                                                                  258

Figure 112 – Pumped Hydro Energy Storage System Layout………… 259

Figure 113 – Europe Hydroelectric Energy Storage Market Size [$B] – 2022-2030……………………………………………………….. 262

Figure 114 – Europe Other Energy Storage Modalities Market Size [$B] – 2022-2030……………………………………………………… 264

Figure 115 – Cement Manufacturing Energy Use and GHG Emissions                                                                                  266

Figure 116 – Cement Production Outlook by Region – 2020-2050….. 267

Figure 117 – Decarbonization Actions to Net-Zero Cement & Concrete Industry…………………………………………………………… 268

Figure 118 – Cement Demand Forecast per Region – 2020-2060…… 269

Figure 119 – Low Carbon Levels Across the Lifecycle of Cement…… 271

Figure 120 – Europe Green Cement Market Size [$B] – 2022-2030… 272

Figure 121 – Green Steel Production Using CCS & CCU……………… 274

Figure 122 – Crude Steel Production Market Share [%] by country 2020                                                                                  274

Figure 123 – Green Steel Manufacturing Process……………………….. 275

Figure 124 – Means and Methods to Reduce Carbon in the Steel Industry…………………………………………………………… 276

Figure 125 – Europe Green Steel Market Size [$B] – 2022-2030……. 277

Figure 126 – Distribution of Synthetic Fuels and Advanced Biofuels Costs……………………………………………………………… 279

Figure 127 – Impact of Innovation on the Energy System……………… 282

Figure 128 – Simplified Value Chain for Low Carbon Fuels…………… 283

Figure 129 – GVA and Jobs in the Low Carbon Fuels Industry to 2050                                                                                  284

Figure 130 – Europe Low Carbon Fuels Manufacturing Plants Market Size [$B] – 2022-2030………………………………………… 285

Figure 131 – Performance Standards For residential AC and Heat Pumps……………………………………………………………. 289

Figure 132 – Thermoelectric Effect………………………………………….. 290

Figure 133 – Magtor Linear Motor Oscillator Drive………………………. 292

Figure 134 – Europe Energy-Efficient Air Conditioning & Refrigeration (ACR) Market Size [$B] – 2022-2030……………………… 293

Figure 135 – Energy Consumption By End-Use (Excludes Transport, Energy Losses in Production or Transmission And Non-Motive Power Industrial Energy Uses)……………………. 297

Figure 136 – Europe Energy-Efficient Electric Appliances (w/o ACR) Market Size [$B] – 2022-2030………………………………. 299

Figure 137 – Air Source Heat Pump: Winter & Summer Operation…. 301

Figure 138 – Air Source Heat Pump, Heating Cycle…………………….. 302

Figure 139 – Air to Air Heat Pump…………………………………………… 303

Figure 140 – Air to Water Heat Pump………………………………………. 304

Figure 141 – Performance Standards For residential AC and Heat Pumps……………………………………………………………. 309

Figure 142 – Europe Air Sourced Heat Pumps Market Size [$B] – 2022-2030………………………………………………………………. 310

Figure 143 – Residential Direct Solar Water Heating System………… 311

Figure 144 – Total Installed Solar Heating Area by Region – 2020….. 312

Figure 145 – Direct Solar Water Heating System Elements…………… 312

Figure 146 – Direct Solar Heating Capacity [KW/1000 citizens] in 10 Leading Countries – 2020……………………………………. 313

Figure 147 – Europe Solar Thermal Capacity [TWh] and Energy [TWh] – 2000-2022……………………………………………………….. 314

Figure 148 – Distribution of Solar Thermal Systems for Newly Installed Water Collector by Region – 2020…………………………. 314

Figure 149 – Europe Direct Solar Water Heating Market Size [$B] – 2022-2030……………………………………………………….. 315

Figure 150 – Europe Passenger Cars Sales [Million/ Annum] by Technology – 2018-2035…………………………………….. 317

Figure 151 – 100% Phase Out of ICE Countries…………………………. 319

Figure 152 – EVs vs. Renewables vs. Electrification Timeline – 2020-2050………………………………………………………………. 320

Figure 153 – EPA Rang [Mile] for 2020-Model Battery Passenger EV 322

Figure 154 – US Passengers BEV & Plug-in Sales [Units] – 2015-2025                                                                                  323

Figure 155 – Electric Cars vs. ICE Car Materials by % of the Total Weight …………………………………………………………… 325

Figure 156 – Europe Passenger BEV Cars Market Size [$B] – 2022-2030………………………………………………………………. 327

Figure 157 – Three E-Wheelers……………………………………………… 329

Figure 158 – Europe Two & Three-Wheeler BEVs Market Size [$B] – 2022-2030……………………………………………………….. 330

Figure 159 – Europe Freight BEVs Market Size [$B] – 2022-2030….. 334

Figure 160 – E-Bus Charging Technologies………………………………. 336

Figure 161 – Enabling E-Bus Adoption Factors………………………….. 339

Figure 162 – Europe Electric Buses Market Size [$B] – 2022-2030… 341

Figure 163 – BNSF Battery-Electric Locomotive…………………………. 342

Figure 164 – Airbus’ E-Fan Electric Plane…………………………………. 345

Figure 165 – A Cut Away View of the HE HMMWV……………………… 346

Figure 166 – A cut-away view of the HEMITT…………………………….. 347

Figure 167 – Europe Other BEVs Market Size [$B] – 2022-2030……. 349

Figure 168 – Electric Passengers vs. Plug in Chargers………………… 352

Figure 169 – Charging Times to Provide 100 km of Passenger EV Vehicle Driving…………………………………………………. 353

Figure 170 – US Passengers EV Charging Infrastructure – 2015-2040                                                                                  354

Figure 171 – Europe EV Charging Systems Market Size [$B] – 2022-2030………………………………………………………………. 359

Figure 172 – Fuel Cell Passenger Vehicle Elements……………………. 361

Figure 173 – Hydrogen Pickup Truck……………………………………….. 361

Figure 174 – Hydrogen Truck Layout……………………………………….. 362

Figure 175 – Toyota Hydrogen Truck……………………………………….. 362

Figure 176 – EV Truck vs. Hydrogen Long Haul Truck Performance Outlook 2025 & 2030…………………………………………. 363

Figure 177 – Yamaha Motor Hydrogen Engine Prototype – 2021……. 364

Figure 178 – Yamaha Hydrogen Engine…………………………………… 365

Figure 179 – Total Cost of Ownership of SUVs in the US, 2030…….. 367

Figure 180 – Europe Hydrogen Vehicles Market Size [$B] – 2022-2030                                                                                  369

Figure 181 – Hydrogen Electrolyzer Electro-Chemistry………………… 372

Figure 182 – Description of Several Electrolysers Source: K. Malladi Et.Al…………………………………………………….. 372

Figure 183 – Electrolyzer Manufacturing [GW] Capacity 2021-2024… 374

Figure 184 – Future Hydrogen Economy Infrastructure………………… 375

Figure 185 – Europe Hydrogen Electrolyzers Market Size [$B] – 2022-2030………………………………………………………………. 376

Figure 186 – Honda Home Filling Station………………………………….. 378

Figure 187 -Transport Fuel Hydrogen Production Routes…………….. 379

Figure 188 – Hydrogen Fueling System Architecture…………………… 380

Figure 189 – Hydrogen Fueling Station…………………………………….. 380

Figure 190 – Hydrogen Fueling HySTAT…………………………………… 381

Figure 191 – Europe Hydrogen Fueling Infrastructure Market Size [$B] – 2022-2030……………………………………………………….. 382

Figure 192 – Hydrogen Consumption [M. Ton/Annum] by Country – 2020                                                                                  384

Figure 193 – Green Hydrogen Value Chain………………………………. 385

Figure 194 – Future “Hydrogen Economy” Infrastructure………………. 390

Figure 195 – Europe Green Hydrogen Production Market Size [$B] – 2022-2030……………………………………………………….. 391

Figure 196 – Components of a Precision Agriculture System………… 393

Figure 197 – Precision Agriculture Technologies……………………….. 394

Figure 198 – Precision Agriculture Stakeholders………………………… 395

Figure 199 – Europe Precision Agriculture Market Size [$B] – 2022-2030                                                                                  400

Figure 200 – Europe Regenerative Agriculture Market Size [$B] – 2022-2030………………………………………………………………. 405

Figure 201 – Greenhouse Gas Emissions from Agriculture ………….. 407

Figure 202 – Agriculture GHG Emissions………………………………….. 408

Figure 203 – The EU 2030 Targets for Substantial Food Production.. 409

Figure 204 – The Main Greenhouse Gas Emission Sources, Removals and Processes In Managed Ecosystems………………… 410

Figure 205 – Europe Climate Adapted Agriculture Market Size [$B] – 2022-2030……………………………………………………….. 414

Figure 206 – Annual Loss of Forest Cover – 2000-2020………………. 417

Figure 207 – Forest Transition Model………………………………………. 418

Figure 208 – Europe Reforestation Market Size [$B] – 2022-2030….. 425

Figure 209 – Bioremediation Strategies……………………………………. 427

Figure 210 – Operation of Bio Slurping…………………………………….. 428

Figure 211 – Permeable Reactive Barriers………………………………… 429

Figure 212 – Bioventing System……………………………………………… 429

Figure 213 – Typical Biosparging System…………………………………. 430

Figure 214 – Europe Bioremediation Market Size [$B] – 2022-2030.. 435

Figure 215 – Europe Water Stress Map……………………………………. 437

Figure 216 – Global Water Extraction and Consumption by End User– 1900-2025……………………………………………………….. 439

Figure 217 – Water Supply Adaptation Strategy…………………………. 440

Figure 218 – Potential Drought Adaptation Measures………………….. 442

Figure 219 –Europe Urban Population Facing Water Scarcity 2019-2050………………………………………………………………. 443

Figure 220 – Climate Change Impact on Water Supply………………… 444

Figure 221 – Adapting Water Management to Climate Change……… 445

Figure 222 – Metrices for Decision Making  ………………………………. 446

Figure 223 – Europe Climate Adapted Water Infrastructure Market Size [$B] – 2022-2030……………………………………………….. 452

Figure 224 – Recycled Water Infrastructure………………………………. 454

Figure 225 – Overview of Integrated Regional Water Management Planning and Climate Change……………………………… 455

Figure 226 – Sewage Treatment Infrastructure Elements……………… 456

Figure 227 – A Sewage Treatment Plant…………………………………… 458

Figure 228 – Europe Water Redeemable Systems Market Size [$B] – 2022-2030……………………………………………………….. 460

Figure 229 – Desalination Capacity By [%] by Region – 2020………… 463

Figure 230 – Reverse Osmosis Process…………………………………… 464

Figure 231 – Reverse Osmosis Desalination Process………………….. 465

Figure 232 – Europe Desalination Plants Market Size [$B] – 2022-2030                                                                                  472

Figure 233 – Precision Irrigation System…………………………………… 474

Figure 234 – Europe Precision Irrigation Market Size [$B] – 2022-2030                                                                                  477

Figure 235 – Passive House Design………………………………………… 479

Figure 236 – GHG Abatement for The Building Sector…………………. 483

Figure 237 – Europe Passive Green Buildings Market Size [$B] – 2022-2030………………………………………………………………. 483

Figure 238 – An Integrated Flood Protection……………………………… 485

Figure 239 – Storm Surge Flooding…………………………………………. 486

Figure 240 – Provisional Flood Barriers……………………………………. 487

Figure 241 – Tidal Flood Barrier……………………………………………… 488

Figure 242 – Europe Floods Control Market Size [$B] – 2022-2030… 490

Figure 243 – The U.S. Wildfires Facts……………………………………… 493

Figure 244 – Europe Wildfire Mitigation Market Size [$B] – 2022-2030                                                                                  494

Figure 245 – Europe Weather Monitoring, Modeling & Forecasting Market Size [$B] – 2022-2030………………………………. 499

Figure 246 – Sweden Public Alarm Infrastructure Evolution………….. 501

Figure 247 – The UN Risk Based Public Warning Evolution -1960-2020                                                                                  502

Figure 248 – Public Warning System Architecture………………………. 503

Figure 249 – The Israeli Public (Location Based) Alarm System Poster                                                                                  504

Figure 250 – Mobile Alarm System………………………………………….. 506

Figure 251 – Cell Broadcast…………………………………………………… 507

Figure 252 – Geo Fenced Alarm System………………………………….. 508

Figure 253 – Fixed WIFI Alarm System…………………………………….. 509

Figure 254 – Europe Extreme Weather Public Warning Systems Market Size [$B] – 2022-2030………………………………………… 509

Figure 255 – Tackling Climate Change with Machine Learning………. 511

Figure 256 – Types of Big Data Analytics………………………………….. 512

Figure 257 – Data Mining Process…………………………………………… 512

Figure 258 – Europe Big Data & AI Market Size [$B] – 2022-2030….. 514

Figure 259 – Electricity Distribution Infrastructure……………………….. 516

Figure 260 – Power Grids Cybersecurity Infrastructure………………… 517

Figure 261 – Europe Cybersecurity Market Size [$B] – 2022-2030…. 520

Figure 262 – Europe ICT (w/o Cyber, AI, Big Data) Market Size [$B] – 2022-2030……………………………………………………….. 523

Figure 263 – Greenhouse Gas Emissions [%] By Sector……………… 525

Figure 264 – GHG Emission Tracking Technologies……………………. 526

Figure 265 – CO2 Emissions [GTn] by Geography – 1960-2020…….. 528

Figure 266 – MethaneSAT Performance………………………………….. 530

Figure 267 – Methane Surveillance Technologies. Frequency-Range vs. Resolution……………………………………………………….. 531

Figure 268 – Europe GHG Emission Tracking Market Size [$B] – 2022-2030………………………………………………………………. 532

Figure 269 – Diagram of a Conventional Electric Power System…….. 534

Figure 270 – Modern Grid Architecture ……………………………………. 535

Figure 271 – Climate Change Effects on the Electricity Grid………….. 536

Figure 272 – Smart Grid Architecture……………………………………….. 537

Figure 273 -Smart Grid Priorities……………………………………………. 540

Figure 274 – Europe Grid Modernization Market Size [$B] – 2022-2030                                                                                  541

Figure 275 – Other Europe Warming Mitigation Markets Size [$B] – 2022-2030……………………………………………………….. 543

Figure 276 – Cumulative 2022-2030 Europe Climate Change Mitigation & Adaptation Market by Sector [$T]……………………….. 549

Figure 277 – Europe Climate Change Mitigation & Adaptation Market Share by Sector [%] – 2022-2030…………………………. 550

Figure 278 – Europe Climate Change Mitigation & Adaptation Market Size [$M] by Revenue Source – 2020-2030…………….. 552

Figure 279 – Europe Climate Change Mitigation & Adaptation Market Share [%] by Revenue Source – 2020-2030……………. 553

Figure 280 – Europe Climate Change Mitigation & Adaptation Market Share by Country – 2030…………………………………….. 559

Figure 281 – Total Energy Supply (TES) by Source, Austria 1990-2020                                                                                  569

Figure 282 – Consumption Trends by Energy Source in Belarus (Mtoe)                                                                                  571

Figure 283 – Total Energy Supply (TES) by Source, Belgium 1990-2019                                                                                  574

Figure 284 – Bulgaria Installed Energy Capacity………………………… 576

Figure 285 – Total Energy Supply (TES) by Source, Czech Republic 1990-2019……………………………………………………….. 579

Figure 286 – Total Energy Supply (TES) by Source, Denmark 1990-2019………………………………………………………………. 581

Figure 287 – Electricity Generation by Energy Source, Finland, 2000-2019………………………………………………………………. 585

Figure 288 – France Total Energy Supply (TES) by Source 1990-2019                                                                                  588

Figure 289 -The German Renewable Energy Use & Reduced Energy Consumption Scenario – 2005-2050………………………. 592

Figure 290 – Germany Electricity Generation per Week 22 – 2021 by Energy Generation Mode……………………………………. 593

Figure 291 – Sources of Large-Scale Energy Capacity [MW] Installed in Greece as of June 2020……………………………………… 596

Figure 292 – Total Energy Supply (TES) by Source, Hungary 1990-2019                                                                                  598

Figure 293 – Total Energy Supply (TES) by Source, Italy 1990-2019. 600

Figure 294 – Distribution of Electricity Generation in the Netherlands in 2020, By Source……………………………………………….. 603

Figure 295 – National Electricity Generation by Energy Source, Norway, in 2019……………………………………………………………. 606

Figure 296 – Total Energy Supply (TES) by Source, Poland 1990-2019                                                                                  609

Figure 297 – Total Energy Supply (TES) by Source, Portugal 1990-2019                                                                                  612

Figure 298 – Romania Consumption Trends by Energy Source (Mtoe)                                                                                  614

Figure 299 – Russia Consumption Trends by Energy Source (Mtoe). 616

Figure 300- Serbian Energy Distribution, 2019………………………….. 619

Figure 301 – Total Energy Supply (TES) by Source, Slovak Republic 1990-2020……………………………………………………….. 621

Figure 302 – Total Energy Supply (TES) by Source, Spain 1990-2020                                                                                  623

Figure 303 – Sweden Energy Consumption, 1800-2020………………. 626

Figure 304 – Total Energy Supply (TES) by Source, Switzerland 1990-2020………………………………………………………………. 629

Figure 305 – The UK Inland Energy Consumption, 1990 and 2020 by Energy Source………………………………………………….. 631

Figure 306 – The UK Electricity Generation, 1990 and 2020 by Energy Source……………………………………………………………. 632

Figure 307 – Solar PV Installed by Quarter in UK……………………….. 632

Figure 308 – Consumption Trends by Energy Source in Ukraine (Mtoe)                                                                                  634

Questions about this report?

Contact Sales: 1-571-527-1010 or Analysts: 1-202-455-0966

  • Have a question about Europe Climate Change Mitigation & Adaptation Market & Technologies - 2022-2030 – With Corona & COP26 Impacts
    Please fill out all fields in the form below and click "Submit" to send your question.
    Our representative will review your question and contact you with an answer as soon as possible.
  • 2+2=
  • This field is for validation purposes and should be left unchanged.
1
Interested in this report? Need more information?

You may also like…

X
Powered By