Download TOC as PDF1 Executive Summary………………………………………………. 10
1.1 Key Findings & Conclusions……………………………….. 10
1.2 Global Non-Lethal Weapons Market Research Vectors 21
1.3 Global Non-Lethal Weapons Market – 2019-2026……. 21
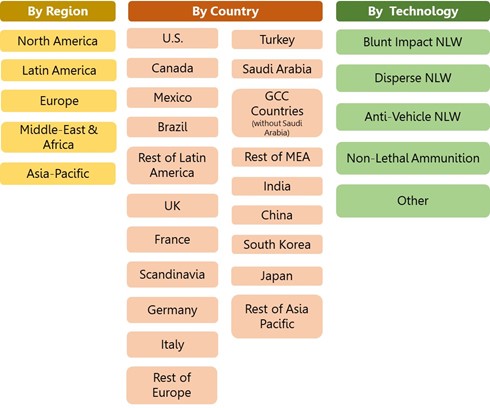
1.3.1 Non-Lethal Weapons Markets by Technology……. 21
1.3.2 Regional Non-Lethal Weapons Markets…………… 22
1.3.3 National Non-Lethal Weapons Markets……………. 24
2 COVID-19 Impact on the Non-Lethal Weapons Market… 26
2.1 Summary……………………………………………………….. 26
2.2 Example: COVID-19 Impact on the Global Air Passenger Traffic……………………………………………………………. 27
3 Non-Lethal Weapons Market Drivers………………………… 29
4 Non-Lethal Weapons Market Inhibitors…………………….. 30
5 Non-Lethal Weapons Market SWOT Analysis……………. 32
5.1 Strengths……………………………………………………….. 32
5.2 Weaknesses…………………………………………………… 33
5.3 Opportunities…………………………………………………… 34
5.4 Threats………………………………………………………….. 35
6 Competitive Analysis: Market Barriers to New Entry, Supplier Power, Buyer Power, Barriers to Substitution and Competitive Rivalry…………………………………………. 38
7 Non-Lethal Weapons Industry Value Chain……………….. 40
7.1 Background…………………………………………………….. 40
7.2 The Non-Lethal Weapons Industry Primary Activities.. 41
7.3 Support Activities……………………………………………… 41
TECHNOLOGY MARKETS……………………………………………… 42
8 Global Non-Lethal Weapons Markets……………………….. 42
8.1 Non-Lethal Weapons Market Size by Technology– 2019-2026……………………………………………………………… 42
8.2 Non-Lethal Weapons Market Dynamics – 2019-2026.. 43
8.3 Global Market Breakdown – 2019-2026………………… 43
9 Blunt Impact NLW Market – 2019-2026……………………… 45
9.1 Blunt Impact NLW Market Size – 2019-2026………….. 45
9.2 Blunt Impact NLW Market Dynamics – 2019-2026…… 45
9.3 Blunt Impact NLW Market Share – 2019-2026………… 46
10 Disperse NLW Market – 2019-2026…………………………… 47
10.1 Disperse NLW Market Size – 2019-2026……………….. 47
10.2 Disperse NLW Market Dynamics – 2019-2026………… 47
10.3 Disperse NLW Market Share – 2019-2026…………….. 48
11 Anti-Vehicle NLW Market – 2019-2026………………………. 49
11.1 Anti-Vehicle NLW Market Size – 2019-2026…………… 49
11.2 Anti-Vehicle NLW Market Dynamics – 2019-2026……. 49
11.3 Anti-Vehicle NLW Market Share – 2019-2026…………. 50
12 Non-Lethal Ammunition Market – 2019-2026……………… 51
12.1 Non-Lethal Ammunition Market Size – 2019-2026…… 51
12.2 Non-Lethal Ammunition Market Dynamics – 2019-2026 51
12.3 Non-Lethal Ammunition Market Share – 2019-2026…. 52
13 Other Non-Lethal Weapons Markets – 2019-2026……….. 53
13.1 Other Markets Size – 2019-2026…………………………. 53
13.2 Other Non-Lethal Weapons Markets Dynamics – 2019-2026……………………………………………………………… 53
13.3 Other Markets Share – 2019-2026……………………….. 54
REGIONAL MARKETS…………………………………………………… 55
14 Regional Non-Lethal Weapons Markets……………………. 55
14.1 Regional Markets – 2019-2026……………………………. 55
14.2 Regional Non-Lethal Weapons Markets Dynamics – 2019-2026………………………………………………………. 56
14.3 Global Market Share by Region – 2019-2026…………. 56
15 North America Non-Lethal Weapons Market……………… 57
15.1 North America Market – 2019-2026……………………… 57
15.2 North America Non-Lethal Weapons Market Dynamics – 2019-2026………………………………………………………. 57
15.3 North America Market Share – 2019-2026……………… 58
16 Latin America Non-Lethal Weapons Market………………. 59
16.1 Latin America Market – 2019-2026………………………. 59
16.2 Latin America Non-Lethal Weapons Market Dynamics – 2019-2026………………………………………………………. 59
16.3 Latin America Market Share – 2019-2026……………… 60
17 Europe Non-Lethal Weapons Market………………………… 61
17.1 Europe Market – 2019-2026……………………………….. 61
17.2 Europe Non-Lethal Weapons Market Dynamics – 2019-2026……………………………………………………………… 61
17.3 Europe Market Share – 2019-2026………………………. 62
18 Middle East & Africa Non-Lethal Weapons Market……… 63
18.1 Middle East & Africa Market – 2019-2026………………. 63
18.2 Middle East & Africa Non-Lethal Weapons Market Dynamics – 2019-2026……………………………………… 63
18.3 Middle East & Africa Market Share – 2019-2026……… 64
19 Asia Pacific Non-Lethal Weapons Market…………………. 65
19.1 Asia Pacific Market – 2019-2026…………………………. 65
19.2 Asia Pacific Non-Lethal Weapons Market Dynamics – 2019-2026………………………………………………………. 65
19.3 Asia Pacific Market Share – 2019-2026…………………. 66
Volume2
NATIONAL MARKETS…………………………………………………… 10
1 Global Non-Lethal Weapons Market by Country………… 10
1.1 Non-Lethal Weapons Market Size by Country– 2019-2026……………………………………………………………… 10
1.2 National Non-Lethal Weapons Markets Dynamics – 2019-2026………………………………………………………. 11
1.3 Global Market Breakdown by Country – 2019-2026…. 12
2 U.S. Non-Lethal Weapons Market – 2019-2026…………… 14
2.1 U.S. Market Background……………………………………. 14
2.2 U.S. Market Size – 2019-2026…………………………….. 14
2.3 U.S. Non-Lethal Weapons Market Dynamics – 2019-2026……………………………………………………………… 14
2.4 U.S. Market Share – 2019-2026………………………….. 15
3 Canada Non-Lethal Weapons Market – 2019-2026……… 16
3.1 Canada Market Background……………………………….. 16
3.2 Canada Market Size – 2019-2026………………………… 16
3.3 Canada Non-Lethal Weapons Market Dynamics – 2019-2026……………………………………………………………… 16
3.4 Canada Market Share – 2019-2026……………………… 17
4 Mexico Non-Lethal Weapons Market – 2019-2026………. 18
4.1 Mexico Market Background………………………………… 18
4.2 Mexico Market Size – 2019-2026…………………………. 18
4.3 Mexico Non-Lethal Weapons Market Dynamics – 2019-2026……………………………………………………………… 18
4.4 Mexico Market Share – 2019-2026………………………. 19
5 Brazil Non-Lethal Weapons Market – 2019-2026………… 20
5.1 Brazil Market Background………………………………….. 20
5.2 Brazil Market Size – 2019-2026…………………………… 20
5.3 Brazil Non-Lethal Weapons Market Dynamics – 2019-2026……………………………………………………………… 20
5.4 Brazil Market Share – 2019-2026…………………………. 21
6 Rest of Latin America Non-Lethal Weapons Market – 2019-2026…………………………………………………………….. 22
6.1 Rest of Latin America Market Background……………… 22
6.2 Rest of Latin America Market Size – 2019-2026……… 22
6.3 Rest of Latin America Non-Lethal Weapons Market Dynamics – 2019-2026……………………………………… 22
6.4 Rest of Latin America Market Share – 2019-2026……. 23
7 UK Non-Lethal Weapons Market – 2019-2026…………….. 24
7.1 UK Market Background……………………………………… 24
7.2 UK Market Size – 2019-2026………………………………. 24
7.3 UK Non-Lethal Weapons Market Dynamics – 2019-2026 24
7.4 UK Market Share – 2019-2026……………………………. 25
8 France Non-Lethal Weapons Market – 2019-2026………. 26
8.1 France Market Background………………………………… 26
8.2 France Market Size – 2019-2026…………………………. 26
8.3 France Non-Lethal Weapons Market Dynamics – 2019-2026……………………………………………………………… 26
8.4 France Market Share – 2019-2026………………………. 27
9 Scandinavian Countries Non-Lethal Weapons Market – 2019-2026…………………………………………………………….. 28
9.1 Scandinavian Countries Market Background………….. 28
9.2 Scandinavian Countries Market Size – 2019-2026…… 28
9.3 Scandinavian Countries Non-Lethal Weapons Market Dynamics – 2019-2026……………………………………… 28
9.4 Scandinavian Countries Market Share – 2019-2026…. 29
10 Germany Non-Lethal Weapons Market – 2019-2026……. 30
10.1 Germany Market Background……………………………… 30
10.2 Germany Market Size – 2019-2026………………………. 30
10.3 Germany Non-Lethal Weapons Market Dynamics – 2019-2026………………………………………………………. 30
10.4 Germany Market Share – 2019-2026……………………. 31
11 Italy Non-Lethal Weapons Market – 2019-2026…………… 32
11.1 Italy Market Background…………………………………….. 32
11.2 Italy Market Size – 2019-2026…………………………….. 32
11.3 Italy Non-Lethal Weapons Market Dynamics – 2019-2026……………………………………………………………… 32
11.4 Italy Market Share – 2019-2026…………………………… 33
12 Rest of Europe Non-Lethal Weapons Market – 2019-2026 34
12.1 Rest of Europe Market Background……………………… 34
12.2 Rest of Europe Market Size – 2019-2026………………. 34
12.3 Rest of Europe Non-Lethal Weapons Market Dynamics – 2019-2026……………………………………………………. 34
12.4 Rest of Europe Market Share – 2019-2026…………….. 35
13 Turkey Non-Lethal Weapons Market – 2019-2026………. 36
13.1 Turkey Market Background………………………………… 36
13.2 Turkey Market Size – 2019-2026…………………………. 36
13.3 Turkey Non-Lethal Weapons Market Dynamics – 2019-2026……………………………………………………………… 36
13.4 Turkey Market Share – 2019-2026……………………….. 37
14 Saudi Arabia Non-Lethal Weapons Market – 2019-2026. 38
14.1 Saudi Arabia Market Background…………………………. 38
14.2 Saudi Arabia Market Size – 2019-2026…………………. 38
14.3 Saudi Arabia Non-Lethal Weapons Market Dynamics – 2019-2026………………………………………………………. 38
14.4 Saudi Arabia Market Share – 2019-2026……………….. 39
15 GCC Countries* Non-Lethal Weapons Market – 2019-2026 40
15.1 GCC Countries* Market Background…………………….. 40
15.2 GCC Countries* Market Size – 2019-2026…………….. 40
15.3 GCC Countries* Non-Lethal Weapons Market Dynamics – 2019-2026……………………………………………………. 40
15.4 GCC Countries* Market Share – 2019-2026…………… 41
16 Rest of MEA Non-Lethal Weapons Market – 2019-2026.. 42
16.1 Rest of MEA Market Background…………………………. 42
16.2 Rest of MEA Market Size – 2019-2026………………….. 42
16.3 Rest of MEA Non-Lethal Weapons Market Dynamics – 2019-2026………………………………………………………. 42
16.4 Rest of MEA Market Share – 2019-2026……………….. 43
17 India Non-Lethal Weapons Market – 2019-2026………….. 44
17.1 India Market Background…………………………………… 44
17.2 India Market Size – 2019-2026……………………………. 44
17.3 India Non-Lethal Weapons Market Dynamics – 2019-2026……………………………………………………………… 44
17.4 India Market Share – 2019-2026………………………….. 45
18 China Non-Lethal Weapons Market – 2019-2026………… 46
18.1 China Market Background………………………………….. 46
18.2 China Market Size – 2019-2026…………………………… 46
18.3 China Non-Lethal Weapons Market Dynamics – 2019-2026……………………………………………………………… 46
18.4 China Market Share – 2019-2026………………………… 47
19 South Korea Non-Lethal Weapons Market – 2019-2026. 48
19.1 South Korea Market Background…………………………. 48
19.2 South Korea Market Size – 2019-2026………………….. 48
19.3 South Korea Non-Lethal Weapons Market Dynamics – 2019-2026………………………………………………………. 48
19.4 South Korea Market Share – 2019-2026……………….. 49
20 Japan Non-Lethal Weapons Market – 2019-2026………… 50
20.1 Japan Market Background………………………………….. 50
20.2 Japan Market Size – 2019-2026………………………….. 50
20.3 Japan Non-Lethal Weapons Market Dynamics – 2019-2026……………………………………………………………… 50
20.4 Japan Market Share – 2019-2026………………………… 51
21 Rest of Asia Pacific Non-Lethal Weapons Market – 2019-2026……………………………………………………………………. 52
21.1 Rest of Asia Pacific Market Background………………… 52
21.2 Rest of Asia Pacific Market Size – 2019-2026…………. 52
21.3 Rest of Asia Pacific Non-Lethal Weapons Market Dynamics – 2019-2026……………………………………… 52
21.4 Rest of Asia Pacific Market Share – 2019-2026………. 53
Volume 3
VENDORS…………………………………………………………………… 16
1.1 Alliant Techsystems………………………………………….. 16
1.2 AMTEC………………………………………………………….. 17
1.3 BAE Systems plc……………………………………………… 18
1.4 Boeing…………………………………………………………… 19
1.5 Centech…………………………………………………………. 20
1.6 Chemring Defense……………………………………………. 20
1.7 Combined Tactical Systems, Inc………………………….. 21
1.8 Defense Technology Corp………………………………….. 21
1.9 Fiocchi…………………………………………………………… 22
1.10 Goodrich Corporation………………………………………… 22
1.11 General Dynamics Corporation……………………………. 23
1.12 Kratos Defense & Security Solutions, Inc………………. 25
1.13 L-3 Communications…………………………………………. 26
1.14 Lamperd Less Lethal Inc……………………………………. 27
1.15 NonLethal Technologies, Inc………………………………. 27
1.16 Penn Arms, Inc………………………………………………… 28
1.17 PepperBall Technologies…………………………………… 29
1.18 Raytheon……………………………………………………….. 30
1.19 Remington Arms Company………………………………… 31
1.20 Royal Ordnance………………………………………………. 32
1.21 SEA Technology………………………………………………. 32
1.22 Security Devices International Inc………………………… 33
1.23 SNPE…………………………………………………………….. 34
1.24 Taser International……………………………………………. 35
1.25 TFM………………………………………………………………. 36
1.26 Universal Propulsion…………………………………………. 37
APPENDICES………………………………………………………………. 38
Appendix A: National Markets Background……………………… 38
North America……………………………………………………………… 38
2 U.S. Market…………………………………………………………… 38
2.1 U.S. Market Background……………………………………. 38
2.1.1 Facts & Figures 2020…………………………………… 38
2.1.2 U.S. Public Safety & Homeland Security: Introduction……………………………………………….. 38
2.2 U.S. Federal Homeland Security Related Organizations 41
2.2.1 Department of Homeland Security (DHS)…………. 42
2.2.2 Department of Homeland Security: Agencies and Units………………………………………………………… 43
2.2.3 DHS – Transportation Security Administration (TSA)………………………………………………………………. 46
2.2.4 DHS – U.S. Customs & Border Protection (CBP).. 48
2.2.5 DHS – Federal Emergency Management Agency (FEMA)…………………………………………………….. 48
2.2.6 DHS – U.S. Immigration & Customs Enforcement (ICE)………………………………………………………… 49
2.2.7 DHS – U.S. Coast Guard (USCG)…………………… 49
2.2.8 U.S. Secret Service (USSS)………………………….. 50
2.2.9 DHS – Science & Technology Directorate (S&T)… 50
2.2.10 DHS – Domestic Nuclear Detection Office (DNDO)………………………………………………………………. 51
2.2.11 DHS – U.S. Citizenship & Immigration Services (USCIS)……………………………………………………. 52
2.2.12 DHS – National Protection and Programs Directorate (NPPD)……………………………………… 53
2.2.13 Department of Defense (DOD)………………………. 54
2.2.14 Department of Justice (DOJ)…………………………. 54
2.2.15 Federal Bureau of Investigation (FBI)………………. 56
2.3 U.S. Police Forces……………………………………………. 58
2.4 U.S. Airports Security Statistics…………………………… 58
2.4.1 Air Passengers Checkpoint CCTV Support Program………………………………………………………………. 65
2.4.2 CCTV Assisted Secure Flight Program……………. 66
2.5 U.S. Land Border Security………………………………….. 67
2.5.1 Introduction……………………………………………….. 67
2.5.2 U.S. Land Border Security Components…………… 68
2.6 U.S. Critical Infrastructure Security………………………. 69
2.6.1 Major Findings……………………………………………. 69
2.6.2 Critical Infrastructure Security Tactics……………… 72
2.6.3 Critical Infrastructure Vulnerabilities………………… 73
2.6.4 Planning of Infrastructure Security………………….. 74
2.7 U.S. Maritime Security………………………………………. 74
2.7.1 Major Findings & Conclusions……………………….. 74
2.7.2 Maritime Security Infrastructure……………………… 76
2.7.3 Port Critical Infrastructure Operations……………… 78
2.7.4 The Container Security Initiative (CSI)…………….. 79
2.8 U.S. Land Transportation Security……………………….. 80
2.8.1 Scope………………………………………………………. 80
2.8.2 Land Transportation Security: Background……….. 81
2.8.3 Mass Transit Security………………………………….. 82
2.9 U.S. Energy Sector Security……………………………….. 83
2.9.1 Scope………………………………………………………. 83
2.9.2 U.S. Energy Sector Security: Background………… 83
2.10 U.S. Public Events Security………………………………… 85
2.10.1 Scope………………………………………………………. 85
2.10.2 U.S. Natural & Manmade Disaster Mitigation…….. 85
3 Canada Market……………………………………………………… 88
3.1 Canada Market Background……………………………….. 88
3.1.1 Facts & Figures 2020…………………………………… 88
3.1.2 Canada Geopolitical Overview………………………. 88
3.1.3 Crime in Canada………………………………………… 89
3.1.4 Canada’s Counter Terror & Law Enforcement Legislation………………………………………………… 89
3.1.5 Canada’s Homeland Security & Public Safety Agencies…………………………………………………… 90
3.1.6 Canada’s Police Forces……………………………….. 91
3.1.7 Canada’s Security Intelligence Services…………… 91
3.1.8 Canada’s Defense Forces…………………………….. 92
3.1.9 Canada: Airport Security Statistics………………….. 92
3.1.10 Canada Border Security……………………………….. 94
Latin America………………………………………………………………. 95
4 Mexico Market………………………………………………………. 95
4.1 Mexico Market Background………………………………… 95
4.1.1 Facts & Figures 2020…………………………………… 95
4.1.2 Mexico Geopolitical Overview………………………… 95
4.1.3 Mexico Homeland Security & Public Safety Industry………………………………………………………………. 96
4.1.4 Crime in Mexico…………………………………………. 99
4.1.5 Mexico’s Counter Terror Legislation & Law Enforcement…………………………………………….. 100
4.1.6 Mexico’s Homeland Security & Public Safety Agencies…………………………………………………. 102
4.1.7 Mexico’s Police Forces………………………………. 102
4.1.8 Mexico’s Intelligence Services……………………… 104
4.1.8.1 Center for Research and National Security…… 104
4.1.8.2 Secretariat of National Defense………………….. 104
4.1.9 Mexico’s Defense Forces……………………………. 104
4.1.10 Mexico: Safe City Projects…………………………… 105
4.1.10.1 Mexico’s Urban Crime and Insurgency………… 105
4.1.10.2 Security Policy……………………………………….. 106
4.1.11 Mexico: Airport Security Statistics…………………. 106
5 Brazil Market………………………………………………………. 109
5.1 Brazil Market Background…………………………………. 109
5.1.1 Facts & Figures 2020…………………………………. 109
5.1.2 Brazil Geopolitical Overview………………………… 109
5.1.3 Brazil Homeland Security & Public Safety Industry……………………………………………………………… 111
5.1.4 Crime in Brazil………………………………………….. 112
5.1.5 Terror in Brazil………………………………………….. 113
5.1.6 Brazil’s Counter Terror Legislation & Law Enforcement…………………………………………….. 114
5.1.7 Brazil’s Homeland Security & Public Safety Agencies…………………………………………………. 114
5.1.8 Brazil’s Police Forces…………………………………. 115
5.1.9 Brazil’s Intelligence Services……………………….. 115
5.1.9.1 ABIN……………………………………………………. 115
5.1.10 Brazil’s Defense Forces……………………………… 116
5.1.11 Brazil: Safe City Projects…………………………….. 116
5.1.12 Brazil: Airport Security Statistics…………………… 117
5.1.13 Brazil Border Security………………………………… 119
Europe……………………………………………………………………… 121
6 UK Market…………………………………………………………… 121
6.1 UK Market Background……………………………………. 121
6.1.1 Facts & Figures 2020…………………………………. 121
6.1.2 UK Geopolitical Overview……………………………. 121
6.1.3 The Brexit Effects……………………………………… 122
6.1.4 UK Homeland Security & Public Safety: Market Background……………………………………………… 123
6.1.5 UK National Security Risk Assessment………….. 125
6.1.6 Crime in the UK………………………………………… 126
6.1.7 Terror in the UK………………………………………… 126
6.1.7.1 UK Homeland Security and Public Safety Strategy…………………………………………………………… 128
6.1.7.2 Countering Terrorism Financing…………………. 128
6.1.7.3 UK Intelligence Agencies Funding………………. 129
6.1.8 The UK Homeland Security & Public Safety Agencies…………………………………………………. 130
6.1.9 The UK Police Forces………………………………… 130
6.1.10 UK Intelligence Services…………………………….. 132
6.1.10.1 Security Service – MI5……………………………… 132
6.1.10.2 National Domestic Extremism & Disorder Intelligence Unit (NDEDIU)……………………….. 133
6.1.10.3 National Crime Agency (NCA)……………………. 133
6.1.10.4 National Ballistics Intelligence Service (NABIS) 133
6.1.10.5 National Fraud Intelligence Bureau (NFIB)……. 133
6.1.10.6 MI6, Secret Intelligence Service…………………. 134
6.1.10.7 Defense Intelligence (DI)………………………….. 134
6.1.10.8 Government Communications Headquarters (GCHQ)………………………………………………… 134
6.1.10.9 The Joint Intelligence Organization……………… 135
6.1.10.10 The Parliament Intelligence and Security Committee…………………………………………….. 136
6.1.10.11 National Security Secretariat (NSS)…………….. 136
6.1.10.12 Office for Security and Counter-Terrorism (OSCT)…………………………………………………………… 136
6.1.10.13 UK Intelligence Agencies Budgets………………. 136
6.1.11 UK Defense Forces…………………………………… 136
6.1.12 UK: Safe City Projects………………………………… 137
6.1.12.1 Urban Security……………………………………….. 137
6.1.12.2 UK Security Policy…………………………………… 138
6.1.12.3 Urban Crime Data…………………………………… 138
6.1.12.4 UK Safe City Projects: Introduction……………… 139
6.1.13 UK: Airport Security Statistics………………………. 139
6.1.14 UK Border Security……………………………………. 140
6.1.14.1 Overview………………………………………………. 140
6.1.14.2 UK Home Office Border Force……………………. 141
6.1.14.3 The UK Immigration Legislation…………………. 142
7 Germany Market………………………………………………….. 143
7.1 Germany Market Background……………………………. 143
7.1.1 Facts & Figures 2020…………………………………. 143
7.1.2 Germany Geopolitical Overview……………………. 143
7.1.3 Germany: Economy, Immigration & Terror………. 143
7.1.4 Germany Homeland Security & Public Safety Industry…………………………………………………… 146
7.1.5 Crime in Germany…………………………………….. 147
7.1.6 Terror in Germany…………………………………….. 147
7.1.7 Germany’s Counter Terror Legislation & Law Enforcement…………………………………………….. 148
7.1.7.1 Germany Approach to Homeland Security and Public Safety………………………………………….. 149
7.1.8 Germany’s Homeland Security & Public Safety Agencies…………………………………………………. 151
7.1.9 Germany’s Police Forces……………………………. 151
7.1.9.1 BPOL – Federal Police……………………………… 151
7.1.9.2 GSG 9 – Special Operations & Counterterrorism Unit……………………………………………………… 152
7.1.9.3 ASSIK – Special Task Force Protection in Crisis Areas…………………………………………………… 153
7.1.9.4 ZKA – Customs Investigation Bureau…………… 153
7.1.9.5 ZUZ – Customs SWAT Unit……………………….. 153
7.1.9.6 Military Police…………………………………………. 153
7.1.9.7 State Police Forces…………………………………. 154
7.1.9.8 SEK – State Special Operations Command Part of Uniformed Police…………………………………….. 154
7.1.9.9 MEK – Mobile Task Force units, Part of Criminal Police…………………………………………………… 155
7.1.10 Germany’s Intelligence Services…………………… 155
7.1.10.1 Federal Intelligence Service (BND)……………… 155
7.1.10.2 Federal Office for the Protection of the Constitution (BfV)……………………………………. 156
7.1.10.3 Military Counterintelligence Service (MAD)…… 156
7.1.10.4 The State Office for the Protection of the Constitution…………………………………………… 157
7.1.11 Germany’s Defense Forces…………………………. 157
7.1.12 Germany’s Safe City………………………………….. 157
7.1.12.1 Urban Crime in Germany………………………….. 157
7.1.12.2 Germany: Safe City Projects……………………… 158
7.1.12.3 Safe City Project in Stuttgart……………………… 159
7.1.12.4 German Safe City Market Eco-System………… 159
7.1.13 Germany: Airport Security Statistics………………. 161
7.1.14 Germany Border Security……………………………. 162
7.1.14.1 German E-Passport…………………………………. 163
7.1.14.2 Automated Border Control (ABC) Gates………. 163
8 France Market…………………………………………………….. 166
8.1 France Market Background………………………………. 166
8.1.1 Facts & Figures 2020…………………………………. 166
8.1.2 France Geopolitical Overview………………………. 166
8.1.3 France Homeland Security & Public Safety Industry……………………………………………………………… 166
8.1.4 Crime in France………………………………………… 167
8.1.5 Terror in France………………………………………… 167
8.1.6 France’s Terror Threats & Counter Terror Strategy……………………………………………………………… 172
8.1.6.1 The New Realities of Terror………………………. 172
8.1.6.2 2015-2018 Counter Terror Policy Transformation…………………………………………………………… 173
8.1.6.3 Threat Levels…………………………………………. 174
8.1.7 French Anti-Terror Legislation……………………… 174
8.1.8 France’s Homeland Security & Public Safety Agencies…………………………………………………. 178
8.1.9 France’s Police Forces……………………………….. 178
8.1.9.1 The National Police…………………………………. 179
8.1.9.2 Research, Assistance, Intervention, Deterrence (RAID)………………………………………………….. 180
8.1.9.3 National Police Intervention Groups (GIPN)….. 180
8.1.9.4 Paris Police Prefecture…………………………….. 180
8.1.9.5 The Municipal Police……………………………….. 181
8.1.9.6 The National Gendarmerie………………………… 181
8.1.9.7 National Gendarmerie Intervention Group…….. 181
8.1.9.8 Police Forces Statistics…………………………….. 182
8.1.10 France’s Intelligence Services……………………… 183
8.1.10.1 Domestic Counter-terrorism & Counter-espionage Intelligence (DGSI)………………………………….. 183
8.1.10.2 Central Directorate of the Judicial Police (DCPJ)…………………………………………………………… 183
8.1.10.3 General Directorate for External Security (DGSE)…………………………………………………………… 184
8.1.10.4 Directorate of Protection and Defense Security (DPSD)…………………………………………………. 184
8.1.10.5 Directorate of Military Intelligence (DRM)……… 185
8.1.10.6 Anti-Terrorist Bureau (BLAT)……………………… 185
8.1.10.7 Inter-Departmental Coordination on Terrorism Matters…………………………………………………. 185
8.1.11 France’s Defense Forces……………………………. 186
8.1.12 France: Safe City Projects…………………………… 187
8.1.13 France: Airport Security Statistics…………………. 188
8.1.14 France Border Security………………………………. 189
8.1.14.1 France Immigration Data………………………….. 192
8.1.14.2 France Visa Policy………………………………….. 193
8.1.14.3 France E-Passport………………………………….. 193
8.1.14.4 France Immigration Legislation………………….. 194
9 Italy Market…………………………………………………………. 195
9.1 Italy Market Background…………………………………… 195
9.1.1 Facts & Figures 2020…………………………………. 195
9.1.2 Italy Geopolitical Overview………………………….. 195
9.1.3 Italy Security & Safety Industry…………………….. 196
9.1.4 Crime in Italy……………………………………………. 198
9.1.5 Terror in Italy……………………………………………. 199
9.1.6 Italy’s Counter Terror Legislation & Law Enforcement…………………………………………….. 200
9.1.7 Italy’s Homeland Security & Public Safety Agencies……………………………………………………………… 201
9.1.8 Italy’s Police Forces…………………………………… 202
9.1.9 Italy’s Intelligence Services…………………………. 204
9.1.9.1 Internal Information and Security Agency (AISI) 204
9.1.9.2 External Intelligence and Security Agency (AISE)…………………………………………………………… 204
9.1.9.3 Department of Information for Security (DIS)…. 205
9.1.9.4 Interministerial Committee for the Security of the Republic (CISR)……………………………………… 205
9.1.10 Italy: Airport Security Statistics…………………….. 206
9.1.11 Italy Border Security…………………………………… 207
10 Sweden Market……………………………………………………. 209
10.1 Sweden Market Background……………………………… 209
10.1.1 Facts & Figures 2020…………………………………. 209
10.1.2 Sweden Geopolitical Overview…………………….. 209
10.1.3 Sweden Homeland Security & Public Safety Industry……………………………………………………………… 209
10.1.4 Crime in Sweden………………………………………. 210
10.1.5 Terror in Sweden………………………………………. 210
10.1.6 Sweden’s Counter Terror Legislation & Law Enforcement…………………………………………….. 211
10.1.7 Sweden’s Homeland Security & Public Safety Agencies…………………………………………………. 212
10.1.8 Sweden’s Police Forces……………………………… 212
10.1.9 Sweden’s Defense Forces…………………………… 213
10.1.10 Sweden’s Intelligence Services…………………….. 213
10.1.11 Sweden: Safe City Projects…………………………. 213
10.1.12 Sweden: Airport Security Statistics………………… 214
11 Denmark Market………………………………………………….. 215
11.1 Denmark Market Background……………………………. 215
11.1.1 Facts & Figures 2020…………………………………. 215
11.1.2 Denmark Geopolitical Overview……………………. 215
11.1.3 Denmark Security & Public Safety Industry……… 215
11.1.4 Crime in Denmark……………………………………… 216
11.1.5 Terror in Denmark…………………………………….. 217
11.1.6 Denmark’s Counter Terror Legislation & Law Enforcement…………………………………………….. 217
11.1.7 Denmark’s Police Forces……………………………. 218
11.1.8 Denmark’s Intelligence Services…………………… 219
11.1.9 Denmark’s Defense Forces…………………………. 219
11.1.10 Denmark: Airport Security Statistics………………. 220
Middle East & Africa……………………………………………………. 221
12 Turkey Market…………………………………………………….. 221
12.1 Turkey Public Safety & Homeland Security Market Background…………………………………………………… 221
12.1.1 Facts & Figures 2020…………………………………. 221
12.1.2 Turkey Homeland Security & Public Safety Market……………………………………………………………… 221
12.1.3 Turkey COVID-19 Pandemic……………………….. 223
12.1.4 Crime in Turkey………………………………………… 224
12.1.5 Terror in Turkey………………………………………… 224
12.1.6 Turkey’s Counter Terror Legislation & Law Enforcement…………………………………………….. 225
12.1.7 Turkey’s Homeland Security & Public Safety Agencies…………………………………………………. 225
12.1.8 Turkey’s Police Forces……………………………….. 226
12.1.9 Turkey’s Intelligence Services……………………… 227
12.1.9.1 The National Intelligence Organization (MIT)…. 227
12.1.10 Turkey’s Defense Forces……………………………. 228
12.1.11 Turkey: Airport Security Statistics…………………. 229
12.1.12 Turkey Border Security………………………………. 230
13 Saudi Arabia Market…………………………………………….. 232
13.1 Saudi Arabia Market Background……………………….. 232
13.1.1 Facts & Figures 2020…………………………………. 232
13.1.2 Saudi Arabia Homeland Security & Public Safety Market……………………………………………………. 232
13.1.3 Saudi Arabia COVID-19 Pandemic……………….. 232
13.1.4 Crime in Saudi Arabia………………………………… 233
13.1.5 Saudi Arabia’s Counter Terror Legislation & Law Enforcement…………………………………………….. 233
13.1.6 Saudi Arabia’s Homeland Security & Public Safety Agencies…………………………………………………. 234
13.1.6.1 Ministry of Interior……………………………………. 237
13.1.6.2 Saudi National Guard………………………………. 238
13.1.6.3 Paramilitary Security Forces……………………… 239
13.1.7 Saudi Arabia’s Police Forces……………………….. 239
13.1.8 Saudi Arabia’s Intelligence Services……………… 240
13.1.8.1 General Intelligence Presidency (GIP)…………. 240
13.1.8.2 General Investigation Directorate (GID or Mabahith)……………………………………………… 240
13.1.9 Saudi Arabia’s Defense Forces…………………….. 241
13.1.9.1 Armed Services………………………………………. 241
13.1.9.2 Independent Forces………………………………… 242
13.1.10 Saudi Arabia’s Safe City Projects………………….. 242
13.1.10.1 Saudi Arabia – 34 Ongoing and Future Safe Cities Projects………………………………………………… 246
13.1.10.2 The Hajj Safe City Strategy……………………….. 246
13.1.11 Saudi Arabia: Airport Security Statistics…………. 247
13.1.12 Saudi Arabia Border Security……………………….. 247
14 UAE Market………………………………………………………… 248
14.1 UAE Market Background………………………………….. 248
14.1.1 Facts & Figures 2020…………………………………. 248
14.1.2 UAE Homeland Security & Public Safety Market. 248
14.1.3 UAE COVID-19 Pandemic…………………………… 253
14.1.4 Crime in the UAE………………………………………. 253
14.1.5 Terror in the UAE………………………………………. 254
14.1.6 UAE’s Counter Terror Legislation & Law Enforcement…………………………………………….. 254
14.1.7 UAE’s Homeland Security & Public Safety Agencies……………………………………………………………… 256
14.1.8 UAE Police Forces…………………………………….. 258
14.1.9 UAE’s Intelligence Services…………………………. 260
14.1.10 UAE’s Defense Forces……………………………….. 260
14.1.10.1 Military Contribution Abroad………………………. 260
14.1.11 UAE’s Safe City Projects…………………………….. 261
14.1.12 UAE: Airport Security Statistics…………………….. 263
14.1.13 UAE Border Security………………………………….. 263
15 Qatar Market……………………………………………………….. 264
15.1 Qatar Market Background………………………………… 264
15.1.1 Facts & Figures 2020…………………………………. 264
15.1.2 Qatar Homeland Security & Public Safety Market 264
15.1.3 Qatar COVID-19 Pandemic…………………………. 266
15.1.4 Crime in Qatar………………………………………….. 266
15.1.5 Terror in Qatar………………………………………….. 268
15.1.6 Qatar’s Counter Terror Legislation & Law Enforcement…………………………………………….. 268
15.1.7 Qatar’s Police Forces…………………………………. 270
15.1.8 Qatar’s Intelligence Services……………………….. 271
15.1.9 Qatar’s Defense Forces……………………………… 271
15.1.10 Qatar’s Safe City Projects…………………………… 272
15.1.11 Qatar: Airport Security Statistics…………………… 273
15.1.12 Qatar Border Security………………………………… 273
16 Kuwait Market…………………………………………………….. 275
16.1 Kuwait Market Background……………………………….. 275
16.1.1 Facts & Figures 2020…………………………………. 275
16.1.2 Kuwait Homeland Security & Public Safety Market……………………………………………………………… 275
16.1.3 COVID-19 pandemic in Kuwait…………………….. 276
16.1.4 Crime in Kuwait………………………………………… 276
16.1.5 Kuwait’s Counter Terror Legislation & Law Enforcement…………………………………………….. 277
16.1.6 Kuwait’s Homeland Security & Public Safety Agencies…………………………………………………. 277
16.1.7 Kuwait’s Police Forces……………………………….. 278
16.1.8 Kuwait’s Intelligence Services………………………. 279
16.1.9 Kuwait’s Defense Forces…………………………….. 279
16.1.10 Kuwait’s Safe City Projects………………………….. 280
16.1.11 Kuwait: Airport Security Statistics………………….. 281
16.1.12 Kuwait Border Security……………………………….. 281
Asia Pacific……………………………………………………………….. 282
17 India Market………………………………………………………… 282
17.1 India Market Background………………………………….. 282
17.1.1 Facts & Figures 2020…………………………………. 282
17.1.2 India Homeland Security & Public Safety Market 282
17.1.3 COVID-19 Pandemic in India……………………….. 284
17.1.4 Crime in India…………………………………………… 287
17.1.4.1 Crime in New Delhi………………………………….. 287
17.1.4.2 Crime in Mumbai…………………………………….. 287
17.1.4.3 Crime in Hyderabad………………………………… 288
17.1.5 Terror in India…………………………………………… 288
17.1.6 India’s Counter Terror Legislation & Law Enforcement…………………………………………….. 288
17.1.7 India’s Homeland Security & Public Safety Agencies……………………………………………………………… 289
17.1.8 India’s Police Forces………………………………….. 290
17.1.9 India’s Defense Market………………………………. 291
17.1.10 India’s Intelligence Services………………………… 294
17.1.10.1 Intelligence Bureau (IB)……………………………. 294
17.1.10.2 Research and Analysis Wing (RAW)…………… 295
17.1.11 India’s Defense Forces………………………………. 295
17.1.12 India’s Safe City Projects……………………………. 296
17.1.13 India: Airport Security Statistics……………………. 297
17.1.14 India Border Security…………………………………. 299
18 China Market………………………………………………………. 301
18.1 China Market Background………………………………… 301
18.1.1 Facts & Figures 2020…………………………………. 301
18.1.2 China Geopolitical Overview………………………… 302
18.1.3 China Economy………………………………………… 303
18.1.4 China: Security Threat Assessment………………. 306
18.1.5 China’s Security Industry…………………………….. 307
18.1.6 China Homeland Security & Public Safety Market……………………………………………………………… 310
18.1.7 Crime in China………………………………………….. 310
18.1.8 Terror in China…………………………………………. 312
18.1.9 China’s Counter Terror Legislation & Law Enforcement…………………………………………….. 313
18.1.10 China’s Homeland Security & Public Safety Agencies…………………………………………………. 315
18.2 National Security Commission of the Communist Party of China (CNSC)…………………………………………….. 316
18.3 The 610 Office……………………………………………….. 316
18.3.1 China’s Police Forces………………………………… 320
18.3.2 China’s Intelligence Services……………………….. 320
18.3.3 China’s Ministry of Public Security………………… 321
18.3.4 China’s Public Security Bureau…………………….. 322
18.3.5 China’s Ministry of State Security………………….. 322
18.3.6 China’s Defense Forces……………………………… 323
18.3.7 Natural Disasters in China…………………………… 327
18.3.8 China’s Safe City Projects…………………………… 328
18.3.8.1 China Public Security………………………………. 328
18.3.8.2 China Urbanization Plan…………………………… 329
18.3.8.3 China Safe Cities Market………………………….. 329
18.3.8.4 China’s 200 Largest Safe City Projects………… 331
18.3.9 China: Airport Security Statistics…………………… 332
18.3.10 China Border Security………………………………… 338
19 South Korea Market……………………………………………… 340
19.1 South Korea Market Background……………………….. 340
19.1.1 Facts & Figures 2020…………………………………. 340
19.1.2 South Korea Homeland Security & Public Safety Market……………………………………………………. 340
19.1.3 Crime in South Korea…………………………………. 341
19.1.4 Terror in South Korea………………………………… 342
19.1.5 South Korea’s Homeland Security & Public Safety Agencies…………………………………………………. 342
19.1.6 South Korea’s Police Forces……………………….. 343
19.1.7 South Korea’s Intelligence Services………………. 345
19.1.7.1 National Intelligence Service (NIS)……………… 345
19.1.8 South Korea’s Defense Forces…………………….. 345
19.1.9 South Korea’s Safe City Projects………………….. 346
19.1.10 South Korea: Airport Security Statistics………….. 347
19.1.11 South Korea Border Security……………………….. 348
20 Japan Market………………………………………………………. 349
20.1 Japan Market Background………………………………… 349
20.1.1 Facts & Figures 2020…………………………………. 349
20.1.2 Japan Homeland Security & Public Safety Market……………………………………………………………… 349
20.1.3 Crime in Japan…………………………………………. 350
20.1.4 Terror in Japan…………………………………………. 350
20.1.5 Japan’s Homeland Security & Public Safety Agencies…………………………………………………. 351
20.1.6 Japan’s Police Forces………………………………… 352
20.1.7 Japan’s Intelligence Services……………………….. 352
20.1.7.1 Public Security Intelligence Agency (PSIA)…… 352
20.1.7.2 Intelligence and Analysis Service……………….. 353
20.1.8 Japan’s Defense Forces……………………………… 353
20.1.9 Japan’s Safe City Projects…………………………… 354
20.1.10 Natural Disasters in Japan………………………….. 354
20.1.11 Japan: Airport Security Statistics…………………… 356
20.1.12 Japan Border Security………………………………… 358
21 Appendix B: Post Coronavirus Pandemic Global Security Concerns……………………………………………………………. 360
22 Appendix C: Global Risks 2020: A Regional Perceptive 364
23 Appendix D: Global Geopolitical Scenario: 2026 Outlook 368
24 Appendix E: Global Terror Threats………………………… 370
25 Appendix F: The Industry……………………………………… 375
25.1 Mergers & Acquisitions (M&A)…………………………… 375
25.2 Business Models & Strategies…………………………… 375
25.2.1 Variable Economic Conditions……………………… 375
25.2.2 Market Tiers…………………………………………….. 376
25.2.3 Defense Primes & Mega Corporations’ Inroads into the Market……………………………………………….. 376
25.2.4 Market Entry Strategies………………………………. 377
25.2.5 Market Entry Challenges…………………………….. 377
25.2.6 The Industry: Supply-Side & Demand-Side Analysis……………………………………………………………… 378
25.2.7 Price Elasticity………………………………………….. 381
25.2.8 Vendor – Government Relationship………………. 383
26 Appendix G: Non-Lethal Weapons Industry Supply-Side & Demand-Side Analysis………………………………………. 387
26.1 Non-Lethal Weapons Development and Procurement Process………………………………………………………… 388
26.1.1 Non-Lethal Weapons Technology Development, Testing & Evaluation Process………………………. 388
26.2 Spiral Development, Procurement & Deployment of Non-Lethal Weapons Systems…………………………………. 391
27 Appendix H: Security & Safety Product Standards…… 392
28 Appendix I: Abbreviations…………………………………….. 416
29 Research Methodology………………………………………… 428
29.1 Report Structure…………………………………………….. 428
29.2 Research Methodology……………………………………. 428
29.3 For Whom is this Report?…………………………………. 429
30 Disclaimer and Copyright……………………………………… 430