Download TOC as PDF3 Volumes:
Safe City Market and Technologies – 2020-2024 – Volume 1
Safe City Market and Technologies – 2020-2024 – Volume 2
Safe City Market and Technologies – 2020-2024 – Volume 3
Safe City Market and Technologies – 2020-2024 – Volume 1
1 Executive Summary………………………………………………………………………………. 13
1.1 Major Findings………………………………………………………………………………. 13
1.2 Major Conclusions………………………………………………………………………… 17
1.3 Global Safe City Market – 2017-2024…………………………………………… 22
2 Introduction……………………………………………………………………………………………. 26
2.1 Urbanization Trends……………………………………………………………………… 26
2.2 Public Safety in Cities……………………………………………………………………. 29
2.2.1 Crime and Violence…………………………………………………………….. 29
2.2.2 Terrorism……………………………………………………………………………. 29
2.2.3 Public Safety in Major Cities……………………………………………….. 30
2.2.4 Common Safety Issues in City……………………………………………. 31
2.3 The Safe City Concept………………………………………………………………….. 32
2.3.1 Addressing Safety & Security Challenges…………………………… 32
2.3.2 Economic Benefits……………………………………………………………… 34
2.3.3 Planning & Implementation…………………………………………………. 35
2.3.4 Safe City vs. Smart City……………………………………………………… 37
INDUSTRY & MARKET ANALYSIS………………………………………………………………… 42
3 Market Drivers………………………………………………………………………………………… 42
4 Market Inhibitors……………………………………………………………………………………. 43
5 Safe Cities: Business Opportunities & Challenges…………………………….. 44
6 Sample of Recent Safe City Projects……………………………………………………. 45
7 Safe Cities Industry: SWOT Analysis…………………………………………………… 51
7.1 Strengths………………………………………………………………………………………. 51
7.2 Weaknesses…………………………………………………………………………………. 52
7.3 Opportunities…………………………………………………………………………………. 53
7.4 Threats………………………………………………………………………………………….. 54
8 Safe Cities Market: Barriers to Entry, Supplier Power, Buyer Power & Barriers to Substitution……………………………………………………………………………………….. 55
8.1 Safe City Market Tiers…………………………………………………………………… 56
8.2 Safe City Defense Primes & Mega Corporations…………………………… 56
8.3 Entry Strategies toward the Safe City Arena…………………………………. 57
8.4 Safe City Project Price Elasticity…………………………………………………… 58
8.5 Mergers and Acquisitions (M&A)…………………………………………………… 59
THE MARKET…………………………………………………………………………………………………. 60
9 Global Safe City Market – 2017-2024……………………………………………………. 60
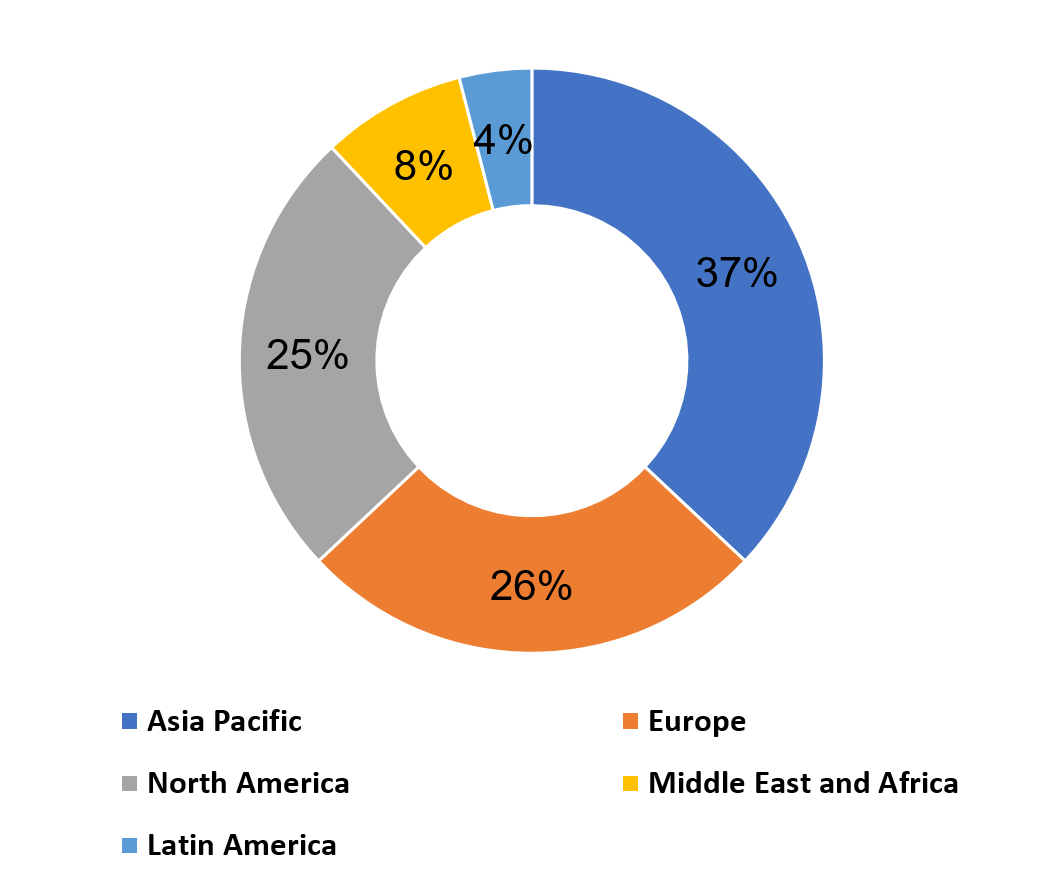
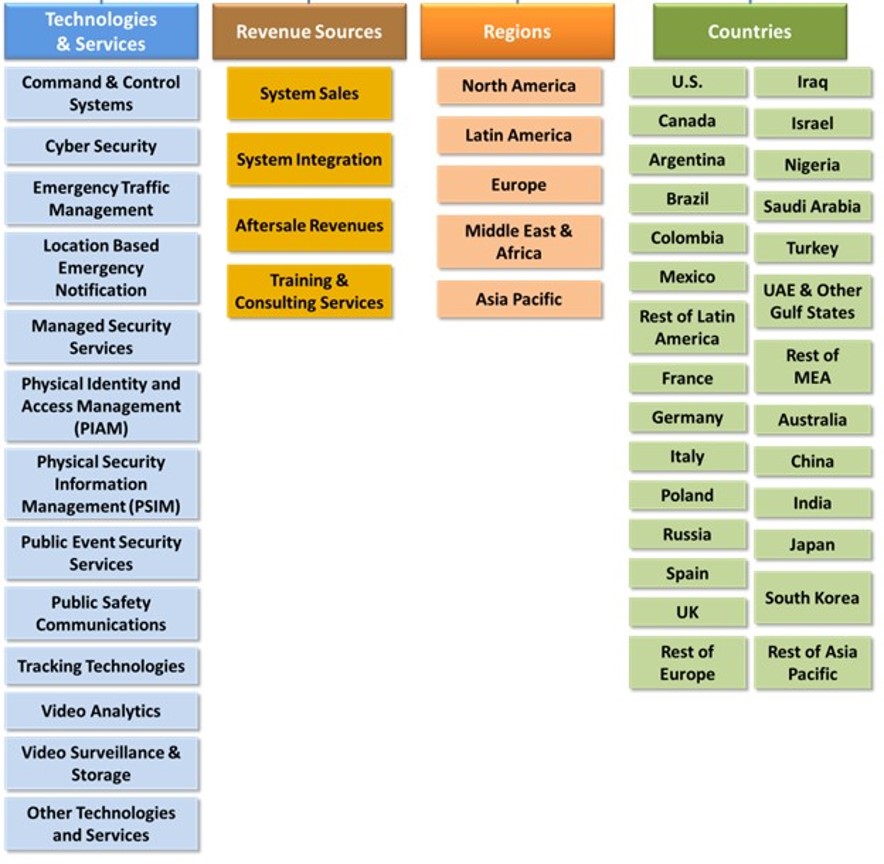
9.1 Global Safe City Market by Region……………………………………………….. 60
9.1.1 Global Market – 2017-2024………………………………………………… 60
9.1.2 Market Dynamics – 2017-2024…………………………………………… 62
9.1.3 Market Breakdown – 2017-2024…………………………………………. 63
9.2 Global Safe City Market by Technology & Service Market……………. 64
9.2.1 Global Market – 2017-2024………………………………………………… 64
9.2.2 Global Market Breakdown – 2017-2024……………………………… 67
9.3 Global Safe City Market by Revenue Source………………………………… 69
9.3.1 Global Market – 2017-2024………………………………………………… 69
9.3.2 Market Breakdown – 2017-2024…………………………………………. 70
10 North America Safe City Market – 2017-2024………………………………………. 71
10.1 Regional Market Drivers……………………………………………………………….. 71
10.2 North America Safe City Market by Technology & Service Market.. 71
10.2.1 North America Market – 2017-2024……………………………………. 71
10.2.2 North America Market Breakdown – 2017-2024…………………. 74
10.3 North America Safe City Market by Revenue Source……………………. 76
10.3.1 North America Market – 2017-2024……………………………………. 76
10.3.2 Market Breakdown – 2017-2024…………………………………………. 77
11 Latin America Safe City Market – 2017-2024……………………………………….. 78
11.1 Regional Market Drivers……………………………………………………………….. 78
11.2 Latin America Safe City Market by Technology & Service Market… 78
11.2.1 Latin America Market – 2017-2024…………………………………….. 78
11.2.2 Latin America Market Breakdown – 2017-2024………………….. 81
11.3 Latin America Safe City Market by Revenue Source…………………….. 83
11.3.1 Latin America Market – 2017-2024…………………………………….. 83
11.3.2 Market Breakdown – 2017-2024…………………………………………. 84
12 Europe Safe City Market – 2017-2024…………………………………………………… 85
12.1 Regional Market Drivers……………………………………………………………….. 85
12.2 Europe Safe City Market by Technology & Service Market…………… 85
12.2.1 Europe Market – 2017-2024……………………………………………….. 85
12.2.2 Europe Market Breakdown – 2017-2024……………………………. 88
12.3 Europe Safe City Market by Revenue Source………………………………. 90
12.3.1 Europe Market – 2017-2024……………………………………………….. 90
12.3.2 Market Breakdown – 2017-2024…………………………………………. 91
13 Middle East and Africa Safe City Market – 2017-2024………………………… 92
13.1 Regional Market Drivers……………………………………………………………….. 92
13.2 Middle East and Africa Safe City Market by Technology & Service Market 92
13.2.1 Middle East and Africa Market – 2017-2024………………………. 92
13.2.2 Middle East and Africa Market Breakdown – 2017-2024……. 95
13.3 Middle East and Africa Safe City Market by Revenue Source………. 97
13.3.1 Middle East and Africa Market – 2017-2024………………………. 97
13.3.2 Market Breakdown – 2017-2024…………………………………………. 98
14 Asia-Pacific Safe City Market – 2017-2024…………………………………………… 99
14.1 Regional Market Drivers……………………………………………………………….. 99
14.2 Asia-Pacific Safe City Market by Technology & Service Market……. 99
14.2.1 Asia-Pacific Market – 2017-2024………………………………………… 99
14.2.2 Asia-Pacific Market Breakdown – 2017-2024…………………… 102
14.3 Asia-Pacific Safe City Market by Revenue Source……………………… 104
14.3.1 Asia-Pacific Market – 2017-2024……………………………………… 104
14.3.2 Market Breakdown – 2017-2024………………………………………. 105
TECHNOLOGY & SERVICE MARKETS……………………………………………………….. 106
15 Safe City Command & Control Systems Market……………………………….. 106
15.1 Global Command & Control Systems Market – 2017-2024…………. 106
15.2 Market Dynamics – 2017-2024……………………………………………………. 107
15.3 Market Breakdown – 2017-2024…………………………………………………. 108
16 Safe City Systems Cybersecurity Market………………………………………….. 110
16.1 Safe Cities Systems Cybersecurity Global Market – 2017-2024…. 110
16.2 Market Dynamics – 2017-2024……………………………………………………. 111
16.3 Market Breakdown – 2017-2024…………………………………………………. 112
17 Safe City Emergency Traffic Management Market……………………………. 113
17.1 Global Emergency Traffic Management Market – 2017-2024…….. 113
17.2 Market Dynamics – 2017-2024……………………………………………………. 114
17.3 Market Breakdown – 2017-2024…………………………………………………. 115
18 Safe City Location Based Emergency Notification Market………………. 117
18.1 Global Location Based Emergency Notification Market – 2017-2024 117
18.2 Market Dynamics – 2017-2024……………………………………………………. 118
18.3 Market Breakdown – 2017-2024…………………………………………………. 119
19 Safe City Managed Security Services Market……………………………………. 121
19.1 Global Managed Security Services Market – 2017-2024…………….. 121
19.2 Market Dynamics – 2017-2024……………………………………………………. 122
19.3 Market Breakdown – 2017-2024…………………………………………………. 123
20 Safe City Physical Identity and Access Management (PIAM) Market 125
20.1 Global Physical Identity and Access Management (PIAM) Market – 2017-2024 125
20.2 Market Dynamics – 2017-2024……………………………………………………. 126
20.3 Market Breakdown – 2017-2024…………………………………………………. 127
21 Safe City Physical Security Information Management (PSIM) Market 129
21.1 Global Physical Security Information Management (PSIM) Market – 2017-2024……………………………………………………………………………………………. 129
21.2 Market Dynamics – 2017-2024……………………………………………………. 130
21.3 Market Breakdown – 2017-2024…………………………………………………. 131
22 Safe City Public Event Security Market……………………………………………… 133
22.1 Global Safe City Public Event Security Market – 2017-2024………. 133
22.2 Market Dynamics – 2017-2024……………………………………………………. 134
22.3 Market Breakdown – 2017-2024…………………………………………………. 135
23 Safe City Public Safety Communications Market……………………………… 136
23.1 Global Public Safety Communications Market – 2017-2024……….. 136
23.2 Market Dynamics – 2017-2024……………………………………………………. 137
23.3 Market Breakdown – 2017-2024…………………………………………………. 138
24 Safe City Tracking Technologies Market…………………………………………… 140
24.1 Global Safe City Tracking Technologies Market – 2017-2024…….. 140
24.2 Market Dynamics – 2017-2024……………………………………………………. 141
24.3 Market Breakdown – 2017-2024…………………………………………………. 142
25 Safe City Video Analytics Market……………………………………………………….. 144
25.1 Global Video Analytics Market – 2017-2024……………………………….. 144
25.2 Market Dynamics – 2017-2024……………………………………………………. 145
25.3 Market Breakdown – 2017-2024…………………………………………………. 146
26 Safe City Video Surveillance & Storage Market………………………………… 147
26.1 Global Video Surveillance & Storage Market – 2017-2024…………. 147
26.2 Market Dynamics – 2017-2024……………………………………………………. 148
26.3 Market Breakdown – 2017-2024…………………………………………………. 149
27 Other Safe City Technologies and Services Market…………………………. 151
27.1 Global Other Technologies and Services Market – 2017-2024…… 151
27.2 Market Dynamics – 2017-2024……………………………………………………. 152
27.3 Market Breakdown – 2017-2024…………………………………………………. 153
[Back to top]
Safe City Market and Technologies – 2020-2024 – Volume 2
NATIONAL MARKETS.. 18
1 Global Safe City Market by Country – 2017-2024. 18
1.1 Market Analysis. 18
1.2 Market Dynamics – 2017-2024. 20
1.3 Market Breakdown – 2017-2024. 21
2 United States Safe City Market – 2017-2024. 23
2.1 U.S. Safe City Market Background. 23
2.1.1 Facts & Figures. 23
2.1.2 Crime in the U.S. Cities. 23
2.1.3 Terror in the U.S. 24
2.1.4 U.S. Federal Homeland Security Related Organizations. 25
2.1.5 U.S. Police Forces. 27
2.1.6 Safe City Background. 28
2.1.6.1 Urban Area Security (Federal) Initiative. 28
2.1.6.2 Metropolitan Medical Response System.. 29
2.1.6.3 Safe City Interoperable Communication. 29
2.1.6.4 Next-Generation 911 System.. 29
2.1.6.5 NG911 Deployment Cost Estimation.. 30
2.1.6.6 First Responder Network Authority (FirstNet) 30
2.1.6.7 Federal Safe City IED Detection Program.. 31
2.1.6.8 Federal Safe City Bomb Squad Robotic Enhancements. 31
2.1.6.9 Chicago Safe City. 31
2.1.6.10 Atlanta Safe City Project 33
2.1.6.11 Cincinnati Safe City Project 33
2.2 United States Safe City Market – 2017-2024. 34
2.2.1 U.S. Market by Revenue Source – 2017-2024. 34
2.2.2 Market Dynamics – 2017-2024. 34
2.2.3 Market Breakdown – 2017-2024. 35
3 Canada Safe City Market – 2017-2024. 36
3.1 Canada Safe City Market Background. 36
3.1.1 Facts & Figures. 36
3.1.2 Urban Crime in Canada. 36
3.1.3 Terror in Canada Cities. 36
3.1.4 Canada’s Law Enforcement Agencies. 37
3.1.5 Canada’s Police Forces. 37
3.1.6 Canada Safe Cities. 38
3.2 Canada Safe City Market 38
3.2.1 Canada Market by Revenue Source – 2017-2024. 38
3.2.2 Market Dynamics – 2017-2024. 39
3.2.3 Market Breakdown – 2017-2024. 39
4 Argentina Safe City Market – 2017-2024. 41
4.1 Argentina Safe City Market Background. 41
4.1.1 Facts & Figures. 41
4.1.2 Urban Crime in Argentina. 41
4.1.3 Terror in Argentina. 42
4.1.4 Argentina’s Police Forces. 43
4.1.5 Buenos Aires Safe City Project 43
4.2 Argentina Safe City Market 44
4.2.1 Argentina Market by Revenue Source – 2017-2024. 44
4.2.2 Market Dynamics – 2017-2024. 46
4.2.3 Market Breakdown – 2017-2024. 46
5 Brazil Safe City Market – 2017-2024. 48
5.1 Brazil Safe City Market Background. 48
5.1.1 Facts & Figures. 48
5.1.2 Urban Crime in Brazil 48
5.1.3 Terror in Brazil Cities. 49
5.1.4 Brazil’s Law Enforcement Agencies. 50
5.1.5 Brazil’s Police Forces. 50
5.1.6 Brazil: Safe City Projects. 51
5.2 Brazil Safe City Market 52
5.2.1 Brazil Market by Revenue Source – 2017-2024. 52
5.2.2 Market Dynamics – 2017-2024. 53
5.2.3 Market Breakdown – 2017-2024. 54
6 Colombia Safe City Market – 2017-2024. 55
6.1 Colombia Safe City Market Background. 55
6.1.1 Facts & Figures. 55
6.1.2 Urban Crime in Colombia. 55
6.1.3 Terror in Colombia Cities. 56
6.1.4 Colombia’s Homeland Security & Public Safety Agencies. 56
6.1.5 Colombia’s Police Forces. 56
6.2 Colombia Safe City Market 57
6.2.1 Colombia Market by Revenue Source – 2017-2024. 57
6.2.2 Market Dynamics – 2017-2024. 57
6.2.3 Market Breakdown – 2017-2024. 58
7 Mexico Safe City Market – 2017-2024. 59
7.1 Mexico Safe City Market Background. 59
7.1.1 Facts & Figures. 59
7.1.2 Urban Crime in Mexico. 59
7.1.3 Terror in Mexico Cities. 61
7.1.4 Mexico’s Homeland Security & Public Safety Agencies. 61
7.1.5 Mexico’s Police Forces. 61
7.1.6 Mexico: Safe City Projects. 62
7.1.6.1 Mexico Urban Crime and Insurgency. 62
7.1.6.2 Mexico-City: Safe City. 63
7.2 Mexico Safe City Market – 2017-2024. 66
7.2.1 Mexico Market by Revenue Source – 2017-2024. 67
7.2.2 Market Dynamics – 2017-2024. 67
7.2.3 Market Breakdown – 2017-2024. 68
8 Rest of Latin America Safe City Market – 2017-2024. 69
8.1 Rest of Latin America Safe City Market 69
8.1.1 Rest of Latin America Market by Revenue Source – 2017-2024. 69
8.1.2 Market Dynamics – 2017-2024. 70
8.1.3 Market Breakdown – 2017-2024. 70
9 France Safe City Market – 2017-2024. 72
9.1 France Safe City Market Background. 72
9.1.1 Facts & Figures. 72
9.1.2 Urban Terror in France. 72
9.1.3 France’s Law Enforcement Agencies. 76
9.1.4 France’s Police Forces. 76
9.1.4.1 The National Police. 77
9.1.4.2 Research, Assistance, Intervention, Deterrence (RAID) 78
9.1.4.3 National Police Intervention Groups (GIPN) 78
9.1.4.4 Paris Police Prefecture. 78
9.1.4.5 The Municipal Police. 79
9.1.4.6 The National Gendarmerie. 79
9.1.4.7 National Gendarmerie Intervention Group. 79
9.1.4.8 Police Forces Statistics. 80
9.1.5 France Safe City Projects. 80
9.2 France Safe City Market – 2017-2024. 82
9.2.1 France Market by Revenue Source – 2017-2024. 82
9.2.2 Market Dynamics – 2017-2024. 83
9.2.3 Market Breakdown – 2017-2024. 83
10 Germany Safe City Market – 2017-2024. 84
10.1 Germany Safe City Market Background. 84
10.1.1 Facts & Figures. 84
10.1.2 Crime in Germany. 84
10.1.3 Terror in Germany. 84
10.1.4 Germany’s Law Enforcement Agencies. 86
10.1.5 Germany’s Police Forces. 86
10.1.5.1 BPOL – Federal Police. 86
10.1.5.2 GSG 9 – Special Operations & Counterterrorism Unit 87
10.1.5.3 BFE/BFHu Units – Special Anti-Terrorist Unit of Federal Anti-Riot Police 87
10.1.5.4 ASSIK – Special Task Force Protection in Crisis Areas. 88
10.1.5.5 State Police Forces. 88
10.1.6 Germany Safe City. 88
10.1.6.1 Urban Crime in Germany. 88
10.1.6.2 Germany: Safe City Projects. 89
10.1.6.3 Stuttgart Safe City Project 90
10.1.6.4 Friedrichshafen Safe City Project 90
10.1.6.5 Frankfurt Safe City. 90
10.1.6.6 Berlin and Other Safe City Projects. 91
10.2 Germany Safe City Market – 2017-2024. 91
10.2.1 Germany Market by Revenue Source – 2017-2024. 91
10.2.2 Market Dynamics – 2017-2024. 92
10.2.3 Market Breakdown – 2017-2024. 93
11 Italy Safe City Market – 2017-2024. 94
11.1 Italy Safe City Market Background. 94
11.1.1 Facts & Figures. 94
11.1.2 Crime in Italy. 94
11.1.3 Terror in Italy. 95
11.1.4 Italy’s Homeland Security & Public Safety Agencies. 96
11.1.5 Italy’s Police Forces. 97
11.1.6 Italy: Safe City Projects. 97
11.2 Italy Safe City Market – 2017-2024. 99
11.2.1 Italy Market by Revenue Source – 2017-2024. 99
11.2.2 Market Dynamics – 2017-2024. 100
11.2.3 Market Breakdown – 2017-2024. 101
12 Poland Safe City Market – 2017-2024. 102
12.1 Poland Safe City Market Background. 102
12.1.1 Facts & Figures. 102
12.1.2 Urban Crime in Poland. 102
12.1.3 Terror in Poland. 102
12.1.4 Poland’s Homeland & Public Safety Agencies. 102
12.1.5 Poland’s Police Forces. 103
12.1.6 Poland: Safe City Projects. 103
12.2 Poland Safe City Market – 2017-2024. 103
12.2.1 Poland Market by Revenue Source – 2017-2024. 104
12.2.2 Market Dynamics – 2017-2024. 104
12.2.3 Market Breakdown – 2017-2024. 105
13 Russia Safe City Market – 2017-2024. 106
13.1 Russia Safe City Market Background. 106
13.1.1 Facts & Figures. 106
13.1.2 Crime in Russia. 106
13.1.3 Terror in Russia. 107
13.1.4 Russia’s Homeland Security & Public Safety Agencies. 107
13.1.5 Russia’s Police Forces. 108
13.1.6 Russia: Safe City. 108
13.2 Russia Safe City Market 110
13.2.1 Russia Market by Revenue Source – 2017-2024. 110
13.2.2 Market Dynamics – 2017-2024. 111
13.2.3 Market Breakdown – 2017-2024. 111
14 Spain Safe City Market – 2017-2024. 112
14.1 Spain Safe City Market Background. 112
14.1.1 Facts & Figures. 112
14.1.2 Crime in Spain.. 112
14.1.3 Terror in Spain.. 112
14.1.4 Spain’s Homeland Security & Public Safety Agencies. 113
14.1.5 Spain’s Police Forces. 113
14.1.5.1 The Spanish National Police. 114
14.1.5.2 The Spanish Civil Guard. 115
14.1.6 Spain: Safe City Projects. 116
14.2 Spain Safe City Market – 2017-2024. 119
14.2.1 Spain Market by Revenue Source – 2017-2024. 119
14.2.2 Market Dynamics – 2017-2024. 120
14.2.3 Market Breakdown – 2017-2024. 121
15 UK Safe City Market – 2017-2024. 122
15.1 UK Safe City Market Background. 122
15.1.1 Facts & Figures. 122
15.1.2 Crime in the UK.. 122
15.1.3 Terror in the UK.. 122
15.1.4 2018 Counter Terror Policy Transformation.. 123
15.1.5 UK’s Homeland Security & Public Safety Agencies. 124
15.1.6 UK Police Forces. 124
15.1.7 UK Safe City Projects. 126
15.1.7.1 Urban Security. 126
15.1.7.2 Urban Crime Data. 127
15.1.7.3 UK Safe City Projects: Introduction.. 127
15.1.7.4 Case 1: London – A Safe City. 128
15.1.7.5 Case 2: Glasgow – A Safe City. 129
15.2 U.K. Safe City Market 130
15.2.1 U.K. Market by Revenue Source – 2017-2024. 130
15.2.2 Market Dynamics – 2017-2024. 131
15.2.3 Market Breakdown – 2017-2024. 131
16 Rest of Europe Safe City Market – 2017-2024. 132
16.1 Rest of Europe Safe City Market 132
16.1.1 Rest of Europe Market by Revenue Source – 2017-2024. 132
16.1.2 Market Dynamics – 2017-2024. 132
16.1.3 Market Breakdown – 2017-2024. 133
17 Iraq Safe City Market – 2017-2024. 134
17.1 Iraq Safe City Market Background. 134
17.1.1 Facts & Figures. 134
17.1.2 Crime in Iraq. 134
17.1.3 Terror in Iraq. 134
17.1.4 Iraq’s Homeland Security & Public Safety Agencies. 136
17.1.5 Iraq’s Police Forces. 136
17.1.6 Iraq: Safe City. 137
17.2 Iraq Safe City Market – 2017-2024. 138
17.2.1 Iraq Market by Revenue Source – 2017-2024. 138
17.2.2 Market Dynamics – 2017-2024. 138
17.2.3 Market Breakdown – 2017-2024. 139
18 Israel Safe City Market – 2017-2024. 140
18.1 Israel Safe City Market Background. 140
18.1.1 Facts & Figures. 140
18.1.2 Urban Crime in Israel 140
18.1.3 Terror in Israel 141
18.1.4 Israel’s Homeland Security & Public Safety Agencies. 142
18.1.5 Israel’s Police Forces. 143
18.1.6 Israel: Safe City. 144
18.1.6.1 Projects. 144
18.1.6.2 The Israeli Safe City and Safe Municipalities National Smart Alert System 146
18.2 Israel Safe City Market 149
18.2.1 Israel Market by Revenue Source – 2017-2024. 149
18.2.2 Market Dynamics – 2017-2024. 149
18.2.3 Market Breakdown – 2017-2024. 150
19 Nigeria Safe City Market – 2017-2024. 151
19.1 Nigeria Safe City Market Background. 151
19.1.1 Facts & Figures. 151
19.1.2 Crime in Nigeria. 151
19.1.3 Terror in Nigeria. 152
19.1.4 Nigeria’s Homeland Security & Public Safety Agencies. 153
19.1.5 Nigeria’s Police Forces. 154
19.1.6 Lagos State Security Trust Fund. 156
19.2 Nigeria Safe City Market – 2017-2024. 156
19.2.1 Nigeria Market by Revenue Source – 2017-2024. 156
19.2.2 Market Dynamics – 2017-2024. 156
19.2.3 Market Breakdown – 2017-2024. 157
20 Saudi Arabia Safe City Market – 2017-2024. 158
20.1 Saudi Arabia Safe City Market Background. 158
20.1.1 Facts & Figures. 158
20.1.2 Crime in Saudi Arabia. 158
20.1.3 Terror in Saudi Arabia. 158
20.1.4 Saudi Arabia’s Homeland Security & Public Safety Agencies. 158
20.1.5 Saudi Arabia’s Police Forces. 161
20.1.6 Saudi Arabia’s Safe City Projects. 162
20.1.6.1 Overview.. 162
20.1.6.2 Saudi Arabia – 34 Ongoing and Future Safe Cities Projects. 165
20.1.6.3 The Hajj Safe City Strategy. 165
20.2 Saudi Arabia Safe City Market – 2017-2024. 166
20.2.1 Saudi Arabia Market by Revenue Source – 2017-2024. 166
20.2.2 Market Dynamics – 2017-2024. 166
20.2.3 Market Breakdown – 2017-2024. 167
21 Turkey Safe City Market – 2017-2024. 168
21.1 Turkey Safe City Market Background. 168
21.1.1 Facts & Figures. 168
21.1.2 Crime in Turkey. 168
21.1.3 Terror in Turkey. 168
21.1.4 Turkey’s Homeland Security & Public Safety Agencies. 170
21.1.5 Turkey’s Police Forces. 170
21.2 Turkey Safe City Market – 2017-2024. 171
21.2.1 Turkey Market by Revenue Source – 2017-2024. 171
21.2.2 Market Dynamics – 2017-2024. 172
21.2.3 Market Breakdown – 2017-2024. 173
22 UAE & Other Gulf States Safe City Market – 2017-2024. 174
22.1 UAE Safe City Market Background. 174
22.1.1 Facts & Figures. 174
22.1.2 Urban Crime in the UAE.. 174
22.1.3 Terror in the UAE.. 175
22.1.4 UAE’s Homeland Security & Public Safety Agencies. 176
22.1.5 UAE’s Police Forces. 176
22.1.6 UAE’s Safe City Projects. 179
22.2 Qatar Safe City Market Background. 181
22.2.1 Facts & Figures. 181
22.2.2 Crime in Qatar 181
22.2.3 Terror in Qatar 182
22.2.4 Qatar’s Police Forces. 183
22.2.5 Qatar’s Safe City Projects. 184
22.3 Kuwait Safe City Market Background. 185
22.3.1 Facts & Figures. 185
22.3.2 Crime in Kuwait 185
22.3.3 Terror in Kuwait 185
22.3.4 Kuwait’s Homeland Security & Public Safety Agencies. 185
22.3.5 Kuwait’s Police Forces. 186
22.3.6 Kuwait’s Safe City Projects. 187
22.4 UAE & Other Gulf States Safe City Market – 2017-2024. 188
22.4.1 UAE & Other Gulf States Market by Revenue Source – 2017-2024 188
22.4.2 Market Dynamics – 2017-2024. 189
22.4.3 Market Breakdown – 2017-2024. 189
23 Rest of MEA Safe City Market – 2017-2024. 190
23.1 Rest of MEA Safe City Market 190
23.1.1 Rest of MEA Market by Revenue Source – 2017-2024. 190
23.1.2 Market Dynamics – 2017-2024. 191
23.1.3 Market Breakdown – 2017-2024. 191
24 Australia Safe City Market – 2017-2024. 192
24.1 Australia Safe City Market Background. 192
24.1.1 Facts & Figures. 192
24.1.2 Crime in Australia. 192
24.1.3 Terror in Australia. 192
24.1.4 Australia’s Homeland Security & Public Safety Agencies. 193
24.1.5 Australia’s Police Forces. 194
24.1.6 Australia’s Safe City Projects. 195
24.1.6.1 Overview.. 195
24.1.6.2 Melbourne – A Safe City. 196
24.1.6.3 Adelaide – A Safe City. 197
24.2 Australia Safe City Market – 2017-2024. 197
24.2.1 Australia Market by Revenue Source – 2017-2024. 198
24.2.2 Market Dynamics – 2017-2024. 198
24.2.3 Market Breakdown – 2017-2024. 199
25 China Safe City Market – 2017-2024. 200
25.1 China Safe City Market Background. 200
25.1.1 Facts & Figures. 200
25.1.2 Urban Crime in China. 200
25.1.3 Terror in China. 201
25.1.4 China’s Homeland Security & Public Safety Agencies. 202
25.1.5 China’s Police Forces. 202
25.1.6 China’s Safe City Projects. 203
25.1.6.1 China Public Security. 203
25.1.6.2 China Urbanization Plan. 203
25.1.6.3 China Safe Cities Market 204
25.1.6.4 China’s 200 Largest Safe City Projects. 205
25.2 China Safe City Market – 2017-2024. 207
25.2.1 China Market by Revenue Source – 2017-2024. 207
25.2.2 Market Dynamics – 2017-2024. 208
25.2.3 Market Breakdown – 2017-2024. 209
26 India Safe City Market – 2017-2024. 210
26.1 India Safe City Market Background. 210
26.1.1 Facts & Figures. 210
26.1.2 Crime in India. 210
26.1.3 Terror in India. 211
26.1.4 India’s Homeland Security & Public Safety Agencies. 212
26.1.5 India’s Police Forces. 212
26.1.6 India’s Safe City Projects. 213
26.2 India Safe City Market 215
26.2.1 India Market by Revenue Source – 2017-2024. 215
26.2.2 Market Dynamics – 2017-2024. 215
26.2.3 Market Breakdown – 2017-2024. 216
27 Japan Safe City Market – 2017-2024. 217
27.1 Japan Safe City Market Background. 217
27.1.1 Facts & Figures. 217
27.1.2 Urban Crime in Japan.. 217
27.1.3 Terror in Japan.. 218
27.1.4 Japan’s Homeland Security & Public Safety Agencies. 218
27.1.5 Japan’s Police Forces. 218
27.1.6 Japan’s Safe Cities. 219
27.1.7 Japan Safe Cities: Natural Disasters Response. 220
27.2 Japan Safe City Market 220
27.2.1 Japan Market by Revenue Source – 2017-2024. 221
27.2.2 Market Dynamics – 2017-2024. 221
27.2.3 Market Breakdown – 2017-2024. 222
28 South Korea Safe City Market – 2017-2024. 223
28.1 South Korea Safe City Market Background. 223
28.1.1 Facts & Figures. 223
28.1.2 Crime in South Korea. 223
28.1.3 Terror in South Korea. 223
28.1.4 South Korea’s Homeland Security & Public Safety Agencies. 224
28.1.5 South Korea’s Police Forces. 225
28.1.6 South Korea’s Safe City Projects. 225
28.2 South Korea Safe City Market – 2017-2024. 227
28.2.1 South Korea Market by Revenue Source – 2017-2024. 227
28.2.2 Market Dynamics – 2017-2024. 227
28.2.3 Market Breakdown – 2017-2024. 228
29 Rest of Asia Pacific Safe City Market – 2017-2024. 229
29.1 Rest of Asia Pacific Safe City Market 229
29.1.1 Rest of Asia Pacific Market by Revenue Source – 2017-2024. 229
29.1.2 Market Dynamics – 2017-2024. 229
29.1.3 Market Breakdown – 2017-2024. 230
[Back to top]
Safe City Market and Technologies – 2020-2024 – Volume 3
PRESENT & PIPELINE TECHNOLOGIES……………………………………………………… 22
1 Safe City Technologies: Introduction………………………………………………….. 22
2 Safe City Physical Security Information Management (PSIM) Technologies 23
2.1 Introduction…………………………………………………………………………………… 23
2.2 PSIM Software Capabilities…………………………………………………………… 26
2.3 Safe City PSIM Software Providers………………………………………………. 28
3 Safe City Public-Safety Answering Point (PSAP) Technologies……….. 29
3.1 Introduction…………………………………………………………………………………… 29
3.2 The Next-Generation 911 in the U.S…………………………………………….. 30
3.3 Public-Safety Answering Point (PSAP) Systems Vendors…………….. 32
4 Records Management Software……………………………………………………………. 33
5 Safe City Sensor ICT Network Technologies………………………………………. 34
5.1 Scope……………………………………………………………………………………………. 34
5.2 Distributed Sensors Systems………………………………………………………… 35
5.3 Sensor and Data Fusion Algorithms……………………………………………… 35
5.4 Safe City Wireless Sensor Networks…………………………………………….. 36
6 Safe City Software as a Service (SaaS) Technologies……………………….. 38
7 Safe City Social Media Emergency Response Technologies…………….. 39
8 Safe City Geo-design Technologies…………………………………………………….. 41
9 Safe City Geographic Information Systems (GIS) Technologies………. 42
10 Safe City Location Based Emergency Mass Notification Systems (EMNS) Technologies…………………………………………………………………………………………. 44
10.1 Introduction…………………………………………………………………………………… 44
10.2 Safe City Cell Broadcast Application…………………………………………….. 45
10.3 Cell Broadcast Technologies………………………………………………………… 46
11 Safe City SCADA Technologies……………………………………………………………. 48
12 Safe City, Managed Security Services (MSS) Technologies………………. 50
12.1 Managed Security Services…………………………………………………………… 50
12.2 On-Site Safe City Consulting………………………………………………………… 52
12.3 Remote Safe City Management……………………………………………………. 52
12.4 Managed Security Monitoring……………………………………………………….. 52
12.5 Safe City Managed Security Services Vendors…………………………….. 52
13 Safe City Big Data Technologies………………………………………………………….. 53
14 Safe City Communication Technologies……………………………………………… 54
14.1 Introduction…………………………………………………………………………………… 54
14.2 Safe City Communication Requirements…………………………………. 55
14.3 Benefits of Private Networks over Public Networks……………….. 56
14.4 City-Wide Communication Interoperability…………………………………….. 56
14.5 Long-term Evolution (LTE) Communication………………………………….. 58
14.6 Video Dispatch……………………………………………………………………………… 60
15 Safe City Video Surveillance Technologies………………………………………… 62
15.1 Introduction…………………………………………………………………………………… 62
15.2 Video Surveillance Evolution…………………………………………………………. 63
15.2.1 Analog Video Surveillance………………………………………………….. 64
15.2.2 Second-Generation Analog Video Surveillance………………….. 65
15.2.3 Third-Generation Video Surveillance………………………………….. 66
15.2.4 Digital Video Surveillance…………………………………………………… 69
15.2.5 IP Surveillance Cameras…………………………………………………….. 69
15.2.6 IP-Based Video Surveillance Systems……………………………….. 70
16 Safe City Video Analytics Technologies……………………………………………… 72
16.1 Introduction…………………………………………………………………………………… 72
16.1.1 Video Analytics System Architecture………………………………….. 73
16.1.2 Intelligent Video Surveillance: Cloud Platforms………………….. 73
16.2 Safe City Video Analytics Based Suspect Behavioral Analysis…….. 75
16.3 Video Surveillance as a Service (VSaaS)……………………………………… 77
16.3.1 Video Surveillance as Service Solutions: 26 Vendors………… 78
16.4 Real Time Automatic Alerts Software……………………………………………. 79
16.5 Image Segmentation Software……………………………………………………… 80
16.6 Item Tracking Video Analytics Software………………………………………… 81
16.7 Object Sorting and ID……………………………………………………………………. 81
16.8 Safe City Face Recognition Technologies…………………………………….. 81
16.9 Item Identification and Recognition……………………………………………….. 83
16.10 Multi-Camera Intelligent Video Surveillance Systems…………………… 83
16.11 Video Content Analysis…………………………………………………………………. 84
16.11.1 Automated Analysis of Video Surveillance Data…………………. 87
16.11.2 Item Detection…………………………………………………………………….. 88
16.11.3 Background Subtraction: Gaussian Mixture Based Software 89
16.11.4 Background Subtraction……………………………………………………… 90
16.11.5 Item Detection Using a Single-image Software…………………… 91
16.11.6 Item Tracking Software………………………………………………………. 91
16.11.7 Kalman Filtering Techniques, Region Segmentation………….. 92
16.11.8 Kalman Filters Application to Track Moving Items………………. 93
16.11.9 Partially Observable Markov Decision Process, Intelligent Video Surveillance Systems…………………………………………………………. 94
16.11.10 “Splitting” Items Algorithms…………………………………………………. 95
16.11.11 Dimension Based Items Classifiers…………………………………….. 97
16.11.12 Shape Based Item Classifiers…………………………………………….. 97
16.11.13 Event Detection Methods……………………………………………………. 98
16.11.14 Vision-based Human Action Recognition……………………………. 99
16.11.15 3D Derived Egomotion……………………………………………………….. 99
16.11.16 Path Reconstruction Software………………………………………….. 100
16.11.17 Video Cameras Spatial Gap Mitigation Software……………… 101
16.11.18 Networked Cameras Tag and Track Software………………….. 101
16.11.19 Visual Intelligence Technologies………………………………………. 102
16.11.20 The Visual Intelligence Process……………………………………….. 103
16.11.20.1 Visual Processing…………………………………………………………… 103
16.11.20.2 Fusion Engine………………………………………………………………… 103
16.11.20.3 Event Description…………………………………………………………… 104
16.11.20.4 Reasoning……………………………………………………………………… 104
16.11.20.5 Reporting……………………………………………………………………….. 105
16.12 Video Analytics Challenges…………………………………………………………. 105
17 Safe City Standoff Video Analytics…………………………………………………….. 106
17.1 Introduction…………………………………………………………………………………. 106
17.1.1 Video Surveillance Based Behavioral Profiling…………………. 109
17.1.2 Video Analytics Based Biometric Face Recognition Identification vs. Verification………………………………………………………………………… 111
17.1.3 Video Based Biometric Recognition Technologies……………. 112
17.2 Video Based Face Recognition…………………………………………………… 113
17.2.1 Remote Biometric Identification Technologies………………….. 114
17.2.2 Fused Intelligent Video Surveillance & Watch Lists………….. 114
17.2.3 Crowd and Riot Surveillance…………………………………………….. 115
17.2.4 Wireless Video Analytics…………………………………………………… 116
17.2.5 Cloud Video Analytics………………………………………………………. 117
17.2.6 Online Video Analytics……………………………………………………… 118
17.2.7 Pulse Video Analytics……………………………………………………….. 119
17.3 Smart Cameras…………………………………………………………………………… 119
17.4 Smart Cameras Edge Based Video Analytics vs. Centralized Video Analytics 122
18 Safe City Physical Identity and Access Management (PIAM)Technologies 124
18.1 Introduction…………………………………………………………………………………. 124
18.2 Physical Identity and Access Management Benefits…………………… 124
18.2.1 PIAM Vendors…………………………………………………………………. 126
18.2.2 Video Surveillance and Intelligent Video Analysis…………….. 127
19 Safe City Natural Disasters Mitigation & Management…………………….. 129
19.1 Background…………………………………………………………………………………. 129
19.2 Private Sector Involvement in Safe Cities Disasters……………………. 132
19.3 Emergency Management Training and Education………………………. 134
19.4 Safe City Emergency Medical Services (EMS)……………………………. 135
19.5 Emergency Management Software…………………………………………….. 137
19.6 Market Drivers…………………………………………………………………………….. 137
19.7 Market Inhibitors…………………………………………………………………………. 137
19.8 Flood Prediction Software…………………………………………………………… 138
20 Urban Public Events Security…………………………………………………………….. 140
20.1 Public Event security…………………………………………………………………… 140
20.1.1 Pre-Event Planning…………………………………………………………… 140
20.1.2 During the Event……………………………………………………………….. 140
20.1.3 After the Event………………………………………………………………….. 140
20.2 Private Sector Public Events Security…………………………………………. 140
20.3 Communication Interoperability…………………………………………………… 141
20.4 Perimeter Security………………………………………………………………………. 141
20.5 Public Events Infrastructure Security…………………………………………… 142
20.6 Public Events Emergency Services…………………………………………….. 142
20.7 Public Events WMD and Hazmat Detection………………………………… 142
20.8 Public Events Security Market: Business Opportunities & Challenges 144
20.9 Market Drivers…………………………………………………………………………….. 145
20.10 Market Inhibitors…………………………………………………………………………. 145
21 Safe City Cloud Computing, Data Mining & Analytics Technologies 147
22 Safe City Command & Control Technologies……………………………………. 148
22.1 Safe City Command & Control Tasks………………………………………….. 148
22.2 Safe City NICS Command & Control Infrastructure…………………….. 149
22.3 First Responder Network Authority (FirstNet)……………………………… 151
23 Safe City Gunshot Sensor Technologies…………………………………………… 152
23.1 Introduction…………………………………………………………………………………. 152
23.2 Acoustic Gunshot Location Technologies…………………………………… 153
23.3 Optical Gunshot Location Technologies……………………………………… 154
23.4 Fused Optical and Acoustic Gunshot Detection………………………….. 154
23.5 Detection of Gunshot Signature: Artificial Neural Networks………… 155
23.6 Gunshot Location Detection: System Architecture………………………. 156
24 Safe City Emergency Transportation Management Technologies….. 157
24.1 Intelligent Transportation Systems (ITS)…………………………………….. 157
24.2 Intelligent Transport Technologies………………………………………………. 158
24.3 Wireless Communications…………………………………………………………… 158
24.4 Triangulation Methods………………………………………………………………… 159
24.5 License Plate Recognition (LPR)………………………………………………… 160
24.6 Inductive Loop Detection…………………………………………………………….. 160
24.7 Video Vehicle Detection………………………………………………………………. 160
24.8 Smart Transportation Security: Bluetooth Detection……………………. 161
24.9 Emergency Vehicle Notification Systems……………………………………. 161
VENDORS……………………………………………………………………………………………………… 162
25 Major Vendors……………………………………………………………………………………… 162
25.1 Digital Clues………………………………………………………………………………… 162
25.1.1 Company profile……………………………………………………………….. 162
25.1.2 Safe City and Smart City Products……………………………………. 163
25.1.3 Recent Events………………………………………………………………….. 163
25.1.4 Contact Information………………………………………………………….. 163
25.2 3VR…………………………………………………………………………………………….. 164
25.2.1 Company profile……………………………………………………………….. 164
25.2.2 Safe City & Smart City Products……………………………………….. 164
25.2.3 Safe City and Smart City Activities……………………………………. 164
25.2.4 Contact Information………………………………………………………….. 166
25.3 3xLOGIC…………………………………………………………………………………….. 166
25.3.1 Company profile……………………………………………………………….. 166
25.3.2 Safe City and Smart City Products……………………………………. 166
25.3.3 Safe City and Smart City Activities……………………………………. 167
25.3.4 Recent Events………………………………………………………………….. 167
25.3.5 Contact Information………………………………………………………….. 168
25.4 ABB…………………………………………………………………………………………….. 168
25.4.1 Company profile……………………………………………………………….. 168
25.4.2 Safe City & Smart City Products……………………………………….. 169
25.4.3 Safe City and Smart City Activities……………………………………. 169
25.4.4 Recent Events………………………………………………………………….. 170
25.4.5 Contact Information………………………………………………………….. 170
25.5 Accenture……………………………………………………………………………………. 171
25.5.1 Company Profile……………………………………………………………….. 171
25.5.2 Safe City and Smart City Activities……………………………………. 172
25.5.3 Recent Events………………………………………………………………….. 172
25.5.4 Contact Information………………………………………………………….. 174
25.6 ACTi Corporation………………………………………………………………………… 174
25.6.1 Company profile……………………………………………………………….. 174
25.6.2 Safe City and Smart City Products……………………………………. 174
25.6.3 Safe City and Smart City Activities……………………………………. 175
25.6.4 Contact Information………………………………………………………….. 175
25.7 ADT Security Services………………………………………………………………… 176
25.7.1 Company profile……………………………………………………………….. 176
25.7.2 Safe City and Smart City Products……………………………………. 176
25.7.3 Recent Events………………………………………………………………….. 177
25.7.4 Contact Information………………………………………………………….. 177
25.8 ADANI…………………………………………………………………………………………. 178
25.8.1 Company profile……………………………………………………………….. 178
25.8.2 City Products…………………………………………………………………….. 178
25.8.3 Contact Info………………………………………………………………………. 178
25.9 Agent Video Intelligence……………………………………………………………… 179
25.9.1 Company profile……………………………………………………………….. 179
25.9.2 Safe City and Smart City Products……………………………………. 179
25.9.3 Safe City and Smart City Activities……………………………………. 180
25.9.4 Recent Events………………………………………………………………….. 180
25.9.5 Contact Information………………………………………………………….. 181
25.10 Alcatel Lucent……………………………………………………………………………… 181
25.10.1 Company Profile……………………………………………………………….. 181
25.10.2 Safe City and Smart City Products……………………………………. 182
25.10.2.1 Cloud & Data Centers……………………………………………………. 182
25.10.2.2 Fixed Access………………………………………………………………….. 182
25.10.2.3 Content and Video delivery……………………………………………. 183
25.10.2.4 Wireless Access…………………………………………………………….. 183
25.10.3 Safe City and Smart City Activities……………………………………. 183
25.10.4 Recent Events………………………………………………………………….. 184
25.10.5 Contact Information………………………………………………………….. 184
25.11 ALPHAOPEN………………………………………………………………………………. 185
25.11.1 Company Profile……………………………………………………………….. 185
25.11.2 Safe City and Smart City Products……………………………………. 185
25.11.3 Contact Information………………………………………………………….. 186
25.12 Anixter…………………………………………………………………………………………. 186
25.12.1 Company profile……………………………………………………………….. 186
25.12.2 Safe City and Smart City Products……………………………………. 186
25.12.3 Safe City and Smart City Activities……………………………………. 186
25.12.4 Recent Events………………………………………………………………….. 187
25.12.5 Contact Information………………………………………………………….. 187
25.13 Appealing Products, Inc. (API) / ChemSee…………………………………. 188
25.13.1 Company profile……………………………………………………………….. 188
25.13.2 Safe City and Smart City Products……………………………………. 188
25.13.3 Contact Info………………………………………………………………………. 188
25.14 Aralia System……………………………………………………………………………… 189
25.14.1 Company profile……………………………………………………………….. 189
25.14.2 Safe City and Smart City Products……………………………………. 189
25.14.3 Contact Information………………………………………………………….. 190
25.15 AT&T Inc…………………………………………………………………………………….. 190
25.15.1 Company profile……………………………………………………………….. 190
25.15.2 Safe City & Smart City Products……………………………………….. 191
25.15.3 Safe City and Smart City Activities……………………………………. 193
25.15.4 Recent Events………………………………………………………………….. 193
25.15.5 Contact Information………………………………………………………….. 194
25.16 Auto Clear…………………………………………………………………………………… 194
25.16.1 Company profile……………………………………………………………….. 194
25.16.2 Safe City & Smart City Products……………………………………….. 195
25.16.3 Contact Info………………………………………………………………………. 195
25.17 Augusta Systems………………………………………………………………………… 195
25.17.1 Company profile……………………………………………………………….. 195
25.17.2 Safe City & Smart City Products……………………………………….. 196
25.17.3 Safe City and Smart City Activities……………………………………. 196
25.17.4 Contact Information………………………………………………………….. 196
25.18 Avigilon Corporation……………………………………………………………………. 197
25.18.1 Company profile……………………………………………………………….. 197
25.18.2 Safe City and Smart City Products……………………………………. 197
25.18.3 Safe City and Smart City Activities……………………………………. 197
25.18.4 Recent Events………………………………………………………………….. 198
25.18.5 Contact Information………………………………………………………….. 198
25.19 Axis……………………………………………………………………………………………… 199
25.19.1 Company profile……………………………………………………………….. 199
25.19.2 Safe City and Smart City Products……………………………………. 199
25.19.3 Safe City and Smart City Activities……………………………………. 200
25.19.4 Recent Events………………………………………………………………….. 202
25.19.5 Contact Information………………………………………………………….. 202
25.20 AxxonSoft……………………………………………………………………………………. 202
25.20.1 Company profile……………………………………………………………….. 202
25.20.2 Safe City and Smart City Products……………………………………. 203
25.20.3 Safe City and Smart City Activities……………………………………. 203
25.20.4 Recent Events………………………………………………………………….. 203
25.20.5 Contact Information………………………………………………………….. 204
25.21 BAE Systems………………………………………………………………………………. 204
25.21.1 Company Profile……………………………………………………………….. 204
25.21.2 Safe City and Smart City Products……………………………………. 205
25.21.3 Safe City and Smart City Activities……………………………………. 205
25.21.4 Recent Events………………………………………………………………….. 205
25.21.5 Contact Information………………………………………………………….. 206
25.22 BAHIA Corp (Sibel Ltd.)………………………………………………………………. 207
25.22.1 Company Profile……………………………………………………………….. 207
25.22.2 Safe City and Smart City Products……………………………………. 207
25.22.3 Contact Info………………………………………………………………………. 207
25.23 Biosensor Applications………………………………………………………………… 208
25.23.1 Company Profile……………………………………………………………….. 208
25.23.2 Safe City and Smart City Products……………………………………. 209
25.23.3 Contact Info………………………………………………………………………. 209
25.24 Brijot Imaging Systems……………………………………………………………….. 209
25.24.1 Company Profile……………………………………………………………….. 209
25.24.2 Safe City and Smart City Products……………………………………. 210
25.24.3 Contact Info………………………………………………………………………. 210
25.25 Bosch Security Systems……………………………………………………………… 211
25.25.1 Company Profile……………………………………………………………….. 211
25.25.2 Safe City and Smart City Products……………………………………. 211
25.25.3 Safe City and Smart City Activities……………………………………. 212
25.25.4 Recent Events………………………………………………………………….. 212
25.25.5 Contact Information………………………………………………………….. 213
25.26 BT……………………………………………………………………………………………….. 213
25.26.1 Company Profile……………………………………………………………….. 213
25.26.2 Safe City and Smart City Products……………………………………. 214
25.26.3 Safe City and Smart City Activities……………………………………. 214
25.26.4 Recent Events………………………………………………………………….. 215
25.26.5 Contact Information………………………………………………………….. 215
25.27 Camero……………………………………………………………………………………….. 216
25.27.1 Company Profile……………………………………………………………….. 216
25.27.2 Safe City and Smart City Products……………………………………. 216
25.27.3 Recent Events………………………………………………………………….. 217
25.27.4 Contact Information………………………………………………………….. 217
25.28 Airbus Defence and Space…………………………………………………………. 217
25.28.1 Company Profile……………………………………………………………….. 217
25.28.2 Safe City & Smart City Products……………………………………….. 218
25.28.3 Safe City and Smart City Activities……………………………………. 218
25.28.4 Recent Events………………………………………………………………….. 218
25.28.5 Contact Information………………………………………………………….. 219
25.29 CEIA……………………………………………………………………………………………. 219
25.29.1 Company Profile……………………………………………………………….. 219
25.29.2 Safe City & Smart City Products……………………………………….. 219
25.29.3 Recent Events………………………………………………………………….. 219
25.29.4 Contact Info………………………………………………………………………. 220
25.30 CelPlan……………………………………………………………………………………….. 220
25.30.1 Company Profile……………………………………………………………….. 220
25.30.2 Safe City and Smart City Products……………………………………. 220
25.30.3 Safe City and Smart City Activities……………………………………. 221
25.30.4 Contact Information………………………………………………………….. 222
25.31 China Security & Surveillance, Inc………………………………………………. 223
25.31.1 Company Profile……………………………………………………………….. 223
25.31.2 Safe City and Smart City Products……………………………………. 223
25.31.3 Safe City and Smart City Activities……………………………………. 224
25.31.4 Contact Information………………………………………………………….. 224
25.32 Cisco…………………………………………………………………………………………… 225
25.32.1 Company Profile……………………………………………………………….. 225
25.32.2 Safe City and Smart City Products……………………………………. 225
25.32.2.1 Cisco Systems HLS Video Surveillance Products………….. 225
25.32.2.2 Cisco Systems HLS Web Security Products………………….. 226
25.32.2.3 Cisco Systems HLS Router Security Products………………. 226
25.32.2.4 Other Products………………………………………………………………. 226
25.32.3 Safe City and Smart City Activities……………………………………. 226
25.32.4 Recent Events………………………………………………………………….. 227
25.32.5 Contact Information………………………………………………………….. 227
25.33 Citilog………………………………………………………………………………………….. 228
25.33.1 Company Profile……………………………………………………………….. 228
25.33.2 Safe City and Smart City Products……………………………………. 228
25.33.3 Safe City and Smart City Activities……………………………………. 229
25.33.4 Recent Events………………………………………………………………….. 229
25.33.5 Contact Information………………………………………………………….. 230
25.34 Collins Aerospace……………………………………………………………………….. 230
25.34.1 Company Profile……………………………………………………………….. 230
25.34.2 Safe City and Smart City Products……………………………………. 231
25.34.3 Recent Events………………………………………………………………….. 231
25.34.4 Contact Info………………………………………………………………………. 231
25.35 Computer Network Limited (CNL)……………………………………………….. 232
25.35.1 Company Profile……………………………………………………………….. 232
25.35.2 Safe City & Smart City Products……………………………………….. 232
25.35.3 Safe City and Smart City Activities……………………………………. 232
25.35.4 Recent Events………………………………………………………………….. 233
25.35.5 Contact Information………………………………………………………….. 234
25.36 DetectaChem LLC………………………………………………………………………. 234
25.36.1 Company Profile……………………………………………………………….. 234
25.36.2 Safe City & Smart City Products……………………………………….. 234
25.36.3 Recent Events………………………………………………………………….. 235
25.36.4 Contact Info………………………………………………………………………. 235
25.37 Diebold………………………………………………………………………………………… 236
25.37.1 Company Profile……………………………………………………………….. 236
25.37.2 Safe City and Smart City Products……………………………………. 236
25.37.3 Safe City and Smart City Activities……………………………………. 236
25.37.4 Recent Events………………………………………………………………….. 237
25.37.5 237
25.37.6 Contact Information………………………………………………………….. 237
25.38 DVTel………………………………………………………………………………………….. 238
25.38.1 Company Profile……………………………………………………………….. 238
25.38.2 Safe City and Smart City Products……………………………………. 238
25.38.3 Safe City and Smart City Activities……………………………………. 238
25.38.4 Contact Information………………………………………………………….. 239
25.39 Elsag Datamat…………………………………………………………………………….. 239
25.39.1 Company Profile……………………………………………………………….. 239
25.39.2 Safe City and Smart City Products……………………………………. 240
25.39.3 Contact Information………………………………………………………….. 240
25.40 Emerson Electric…………………………………………………………………………. 241
25.40.1 Company Profile……………………………………………………………….. 241
25.40.2 Safe City and Smart City Products……………………………………. 242
25.40.3 Safe City and Smart City Activities……………………………………. 242
25.40.4 Recent Events………………………………………………………………….. 243
25.40.5 Contact Information………………………………………………………….. 243
25.41 Ericsson………………………………………………………………………………………. 244
25.41.1 Company Profile……………………………………………………………….. 244
25.41.2 Safe City & Smart City Products……………………………………….. 244
25.41.3 Safe City and Smart City Activities……………………………………. 245
25.41.4 Recent Events………………………………………………………………….. 246
25.41.5 Contact Information………………………………………………………….. 246
25.42 Firetide………………………………………………………………………………………… 247
25.42.1 Company Profile……………………………………………………………….. 247
25.42.2 Safe City and Smart City Products……………………………………. 247
25.42.3 Safe City and Smart City Activities……………………………………. 248
25.42.4 Contact Information………………………………………………………….. 249
25.43 Flir Systems………………………………………………………………………………… 249
25.43.1 Company Profile……………………………………………………………….. 249
25.43.2 Safe City and Smart City Products……………………………………. 250
25.43.3 Recent Events………………………………………………………………….. 250
25.43.4 Contact Info………………………………………………………………………. 251
25.44 G4S…………………………………………………………………………………………….. 251
25.44.1 Company Profile……………………………………………………………….. 251
25.44.2 Safe City and Smart City Products……………………………………. 251
25.44.3 Safe City and Smart City Activities……………………………………. 252
25.44.4 Recent Events………………………………………………………………….. 252
25.44.5 Contact Information………………………………………………………….. 252
25.45 General Electric…………………………………………………………………………… 253
25.45.1 Company Profile……………………………………………………………….. 253
25.45.2 Safe City and Smart City Products……………………………………. 253
25.45.3 Safe City and Smart City Activities……………………………………. 253
25.45.4 Recent Events………………………………………………………………….. 254
25.45.5 Contact Information………………………………………………………….. 254
25.46 Gilardoni SpA……………………………………………………………………………… 255
25.46.1 Company Profile……………………………………………………………….. 255
25.46.2 Safe City and Smart City Products……………………………………. 255
25.46.3 Contact Info………………………………………………………………………. 255
25.47 Hanwha Techwin………………………………………………………………………… 256
25.47.1 Company Profile……………………………………………………………….. 256
25.47.2 Safe City and Smart City Products……………………………………. 256
25.47.3 Recent Events………………………………………………………………….. 257
25.47.4 Contact Information………………………………………………………….. 257
25.48 Hexagon AB………………………………………………………………………………… 258
25.48.1 Company Profile……………………………………………………………….. 258
25.48.2 Safe City and Smart City Products……………………………………. 258
25.48.3 Safe City and Smart City Activities……………………………………. 259
25.48.4 Recent Events………………………………………………………………….. 259
25.48.5 Contact Information………………………………………………………….. 260
25.49 Hitachi…………………………………………………………………………………………. 260
25.49.1 Company Profile……………………………………………………………….. 260
25.49.2 Safe City and Smart City Products……………………………………. 261
25.49.3 Recent Events………………………………………………………………….. 261
25.49.4 Contact Info………………………………………………………………………. 261
25.50 Honeywell……………………………………………………………………………………. 262
25.50.1 Company Profile……………………………………………………………….. 262
25.50.2 Safe City and Smart City Products……………………………………. 262
25.50.2.1 Video Surveillance Cameras………………………………………….. 262
25.50.2.2 Video Recording…………………………………………………………….. 263
25.50.2.3 Fire and Gas Detection and Alarm…………………………………. 263
25.50.3 Safe City and Smart City Activities……………………………………. 263
25.50.4 Recent Events………………………………………………………………….. 264
25.50.5 Contact Information………………………………………………………….. 264
25.51 IBM……………………………………………………………………………………………… 265
25.51.1 Company Profile……………………………………………………………….. 265
25.51.2 Safe City and Smart City Products……………………………………. 265
25.51.2.1 Fraud Protection Solutions…………………………………………….. 265
25.51.2.2 Data Security and Privacy Solutions………………………………. 266
25.51.2.3 Identity and Access Management Solutions………………….. 266
25.51.2.4 Network Protection Solutions…………………………………………. 266
25.51.2.5 Security Intelligence and Analytics Solutions…………………. 267
25.51.3 Safe City and Smart City Activities……………………………………. 267
25.51.4 Recent Events………………………………………………………………….. 268
25.51.5 Contact Information………………………………………………………….. 269
25.52 IndigoVision………………………………………………………………………………… 269
25.52.1 Company Profile……………………………………………………………….. 269
25.52.2 Safe City and Smart City Products……………………………………. 269
25.52.3 Safe City and Smart City Activities……………………………………. 270
25.52.4 Recent Events………………………………………………………………….. 270
25.52.5 Contact Information………………………………………………………….. 270
25.53 Intel Security……………………………………………………………………………….. 271
25.53.1 Company Profile……………………………………………………………….. 271
25.53.2 Safe City & Smart City Products……………………………………….. 271
25.53.3 Safe City and Smart City Activities……………………………………. 272
25.53.4 Recent Events………………………………………………………………….. 273
25.53.5 Contact Information………………………………………………………….. 273
25.54 IntuVision Inc………………………………………………………………………………. 274
25.54.1 Company Profile……………………………………………………………….. 274
25.54.2 Safe City and Smart City Products……………………………………. 274
25.54.3 Recent Events………………………………………………………………….. 274
25.54.4 Contact Information………………………………………………………….. 274
25.55 iOmniscient…………………………………………………………………………………. 275
25.55.1 Company Profile……………………………………………………………….. 275
25.55.2 Safe City and Smart City Products……………………………………. 275
25.55.3 Safe City and Smart City Activities……………………………………. 277
25.55.4 Contact Information………………………………………………………….. 279
25.56 IPConfigure…………………………………………………………………………………. 280
25.56.1 Company Profile……………………………………………………………….. 280
25.56.2 Safe City and Smart City Products……………………………………. 280
25.56.3 Safe City and Smart City Activities……………………………………. 280
25.56.4 Recent Events………………………………………………………………….. 282
25.56.5 Contact Information………………………………………………………….. 282
25.57 IPS Intelligent Video Analytics…………………………………………………….. 282
25.57.1 Company Profile……………………………………………………………….. 282
25.57.2 Safe City and Smart City Products……………………………………. 283
25.57.3 Safe City and Smart City Activities……………………………………. 283
25.57.4 Contact Information………………………………………………………….. 284
25.58 ISS………………………………………………………………………………………………. 284
25.58.1 Company Profile……………………………………………………………….. 284
25.58.2 Safe City and Smart City Products……………………………………. 285
25.58.3 Safe City and Smart City Activities……………………………………. 285
25.58.4 Recent Events………………………………………………………………….. 286
25.58.5 Contact Information………………………………………………………….. 287
25.59 Ketech Defence…………………………………………………………………………… 287
25.59.1 Company Profile……………………………………………………………….. 287
25.59.2 Safe City and Smart City Products……………………………………. 287
25.59.3 Recent Events………………………………………………………………….. 287
25.59.4 Contact Info………………………………………………………………………. 288
25.60 LIXI, Inc………………………………………………………………………………………. 289
25.60.1 Company Profile……………………………………………………………….. 289
25.60.2 Safe City and Smart City Products……………………………………. 289
25.60.3 Contact Info………………………………………………………………………. 289
25.61 Eocortex……………………………………………………………………………………… 290
25.61.1 Company Profile……………………………………………………………….. 290
25.61.2 Safe City and Smart City Products……………………………………. 290
25.61.3 Recent Events………………………………………………………………….. 290
25.61.4 Contact Information………………………………………………………….. 290
25.62 MDS……………………………………………………………………………………………. 291
25.62.1 Company Profile……………………………………………………………….. 291
25.62.2 Safe City and Smart City Products……………………………………. 291
25.62.3 Contact Information………………………………………………………….. 292
25.63 Mer group……………………………………………………………………………………. 293
25.63.1 Company Profile……………………………………………………………….. 293
25.63.2 Safe City and Smart City Products……………………………………. 294
25.63.3 Safe City and Smart City Activities……………………………………. 296
25.63.4 Recent Events………………………………………………………………….. 297
25.63.5 Contact Information………………………………………………………….. 297
25.64 Milestone Systems A/S……………………………………………………………….. 298
25.64.1 Company Profile……………………………………………………………….. 298
25.64.2 Safe City and Smart City Products……………………………………. 298
25.64.3 Safe City and Smart City Activities……………………………………. 298
25.64.4 Recent Events………………………………………………………………….. 299
25.64.5 Contact Information………………………………………………………….. 299
25.65 MilliVision……………………………………………………………………………………. 300
25.65.1 Company Profile……………………………………………………………….. 300
25.65.2 Safe City and Smart City Products……………………………………. 300
25.65.3 Contact Info………………………………………………………………………. 300
25.66 MINXRAY, Inc…………………………………………………………………………….. 301
25.66.1 Company Profile……………………………………………………………….. 301
25.66.2 Safe City and Smart City Products……………………………………. 301
25.66.3 Contact Info………………………………………………………………………. 301
25.67 Mirasys……………………………………………………………………………………….. 302
25.67.1 Company Profile……………………………………………………………….. 302
25.67.2 Safe City and Smart City Products……………………………………. 302
25.67.3 Safe City and Smart City Activities……………………………………. 302
25.67.4 Contact Information………………………………………………………….. 303
25.68 Mistral Security Inc……………………………………………………………………… 303
25.68.1 Company Profile……………………………………………………………….. 303
25.68.2 Safe City and Smart City Products……………………………………. 303
25.68.3 Recent Events………………………………………………………………….. 304
25.68.4 Contact Info………………………………………………………………………. 304
25.69 National instruments……………………………………………………………………. 304
25.69.1 Company Profile……………………………………………………………….. 304
25.69.2 Safe City and Smart City Products……………………………………. 305
25.69.3 Safe City and Smart City Activities……………………………………. 305
25.69.4 Contact Information………………………………………………………….. 306
25.70 NEC Corporation…………………………………………………………………………. 306
25.70.1 Company Profile……………………………………………………………….. 306
25.70.2 Safe City and Smart City Products……………………………………. 307
25.70.2.1 Critical Infrastructure Management Solutions………………… 307
25.70.2.2 Biometrics Solutions………………………………………………………. 308
25.70.2.3 Cybersecurity Solutions…………………………………………………. 308
25.70.3 Recent Events………………………………………………………………….. 308
25.70.4 Contact Information………………………………………………………….. 308
25.71 NICE Systems…………………………………………………………………………….. 308
25.71.1 Company Profile……………………………………………………………….. 308
25.71.2 Safe City and Smart City Products……………………………………. 309
25.71.3 Recent Events………………………………………………………………….. 309
25.71.4 Contact Information………………………………………………………….. 311
25.72 Northrop Grumman Corporation………………………………………………….. 311
25.72.1 Company Profile……………………………………………………………….. 311
25.72.2 Safe City and Smart City Products……………………………………. 312
25.72.2.1 Unmanned Systems………………………………………………………. 312
25.72.2.2 C4ISR Products……………………………………………………………… 313
25.72.3 Safe City and Smart City Activities……………………………………. 313
25.72.4 Recent Events………………………………………………………………….. 316
25.72.5 Contact Information………………………………………………………….. 317
25.73 Nuctech Co. Ltd………………………………………………………………………….. 317
25.73.1 Company Profile……………………………………………………………….. 317
25.73.2 Safe City and Smart City Products……………………………………. 317
25.73.3 Recent Events………………………………………………………………….. 318
25.73.1 Contact Info………………………………………………………………………. 318
25.74 ObjectVideo………………………………………………………………………………… 319
25.74.1 Company Profile……………………………………………………………….. 319
25.74.2 Safe City and Smart City Products……………………………………. 319
25.74.3 Recent Events………………………………………………………………….. 320
25.74.4 Contact Information………………………………………………………….. 320
25.75 Orsus………………………………………………………………………………………….. 321
25.75.1 Company Profile……………………………………………………………….. 321
25.75.2 Safe City and Smart City Activities……………………………………. 321
25.75.3 Safe City and Smart City Products……………………………………. 321
25.75.4 Contact Information………………………………………………………….. 322
25.76 Panasonic…………………………………………………………………………………… 322
25.76.1 Company Profile……………………………………………………………….. 322
25.76.2 Safe City and Smart City Products……………………………………. 323
25.76.2.1 Video Surveillance Products………………………………………….. 323
25.76.2.2 Surveillance Monitor Products……………………………………….. 324
25.76.2.3 Network Security Camera Products……………………………….. 324
25.76.2.4 Analog Security Camera Products…………………………………. 324
25.76.2.5 Evidence Collection System Products……………………………. 325
25.76.3 Safe City and Smart City Activities……………………………………. 325
25.76.4 Recent Events………………………………………………………………….. 326
25.76.5 Contact Information………………………………………………………….. 326
25.77 Pelco…………………………………………………………………………………………… 327
25.77.1 Company Profile……………………………………………………………….. 327
25.77.2 Safe City and Smart City Products……………………………………. 327
25.77.3 Contact Information………………………………………………………….. 327
25.78 Pivot3………………………………………………………………………………………….. 328
25.78.1 Company Profile……………………………………………………………….. 328
25.78.2 Safe City and Smart City Products……………………………………. 328
25.78.3 Safe City and Smart City Activities……………………………………. 328
25.78.4 Recent Events………………………………………………………………….. 329
25.78.5 Contact Information………………………………………………………….. 329
25.79 Proximex…………………………………………………………………………………….. 330
25.79.1 Company Profile……………………………………………………………….. 330
25.79.2 Safe City and Smart City Products……………………………………. 330
25.79.3 Safe City and Smart City Activities……………………………………. 330
25.79.4 Contact Information………………………………………………………….. 331
25.80 Raytheon Company…………………………………………………………………….. 331
25.80.1 Company Profile……………………………………………………………….. 331
25.80.2 Safe City and Smart City Products……………………………………. 332
25.80.2.1 Interception Products…………………………………………………….. 332
25.80.2.2 Ground-based Air Defense Products……………………………… 332
25.80.2.3 Ballistic Missile Defense Products………………………………….. 332
25.80.2.4 UAV Products………………………………………………………………… 333
25.80.2.5 Airborne Surveillance Products……………………………………… 333
25.80.2.6 Maritime Surveillance Products……………………………………… 333
25.80.3 Safe City and Smart City Activities……………………………………. 333
25.80.4 Recent Events………………………………………………………………….. 334
25.80.5 Contact Information………………………………………………………….. 334
25.81 Red X Defense……………………………………………………………………………. 335
25.81.1 Company Profile……………………………………………………………….. 335
25.81.2 Safe City and Smart City Products……………………………………. 335
25.81.3 Contact Info………………………………………………………………………. 335
25.82 Salient Stills………………………………………………………………………………… 336
25.82.1 Company Profile……………………………………………………………….. 336
25.82.2 Safe City and Smart City Products……………………………………. 336
25.82.3 Safe City and Smart City Activities……………………………………. 336
25.82.4 Recent Events………………………………………………………………….. 336
25.82.5 Contact Information………………………………………………………….. 337
25.83 Scanna MSC Ltd…………………………………………………………………………. 337
25.83.1 Company Profile……………………………………………………………….. 337
25.83.2 Safe City and Smart City Products……………………………………. 338
25.83.3 Contact Info………………………………………………………………………. 338
25.84 Schneider Electric……………………………………………………………………….. 339
25.84.1 Company Profile……………………………………………………………….. 339
25.84.2 Safe City and Smart City Products……………………………………. 339
25.84.3 Safe City and Smart City Activities……………………………………. 339
25.84.4 Recent Events………………………………………………………………….. 341
25.84.5 Contact Information………………………………………………………….. 341
25.85 Scintrex Trace…………………………………………………………………………….. 342
25.85.1 Company Profile……………………………………………………………….. 342
25.85.2 Safe City and Smart City Products……………………………………. 342
25.85.3 Contact Info………………………………………………………………………. 342
25.86 SeeTec……………………………………………………………………………………….. 343
25.86.1 Company Profile……………………………………………………………….. 343
25.86.2 Safe City and Smart City Products……………………………………. 343
25.86.3 Safe City and Smart City Activities……………………………………. 343
25.86.4 Recent Events………………………………………………………………….. 343
25.86.5 Contact Information………………………………………………………….. 344
25.87 Siemens………………………………………………………………………………………. 344
25.87.1 Company Profile……………………………………………………………….. 344
25.87.2 Safe City and Smart City Products……………………………………. 345
25.87.3 Safe City and Smart City Activities……………………………………. 345
25.87.4 Recent Events………………………………………………………………….. 347
25.87.5 Contact Information………………………………………………………….. 347
25.88 Smart China (Holdings) Limited………………………………………………….. 348
25.88.1 Company Profile……………………………………………………………….. 348
25.88.2 Safe City and Smart City Activities……………………………………. 348
25.88.3 Contact Information………………………………………………………….. 348
25.89 Sony Corp…………………………………………………………………………………… 349
25.89.1 Company Profile……………………………………………………………….. 349
25.89.2 Safe City and Smart City Products……………………………………. 349
25.89.3 Safe City and Smart City Activities……………………………………. 350
25.89.4 Recent Events………………………………………………………………….. 350
25.89.5 Contact Information………………………………………………………….. 350
25.90 Syagen Technology…………………………………………………………………….. 351
25.90.1 Company Profile……………………………………………………………….. 351
25.90.2 Contact Info………………………………………………………………………. 351
25.91 Synectics Plc………………………………………………………………………………. 352
25.91.1 Company Profile……………………………………………………………….. 352
25.91.2 Safe City and Smart City Products……………………………………. 352
25.91.3 Safe City and Smart City Activities……………………………………. 353
25.91.4 Recent Events………………………………………………………………….. 353
25.91.5 Contact Information………………………………………………………….. 354
25.92 Tandu Technologies & Security Systems Ltd……………………………… 354
25.92.1 Company Profile……………………………………………………………….. 354
25.92.2 Recent Events………………………………………………………………….. 354
25.92.3 Contact Information………………………………………………………….. 354
25.93 TeraView…………………………………………………………………………………….. 355
25.93.1 Company Profile……………………………………………………………….. 355
25.93.2 Safe City and Smart City Products……………………………………. 355
25.93.3 Contact Info………………………………………………………………………. 356
25.94 Texas Instruments………………………………………………………………………. 356
25.94.1 Company Profile……………………………………………………………….. 356
25.94.2 Safe City and Smart City Products……………………………………. 356
25.94.3 Recent Events………………………………………………………………….. 358
25.94.4 Contact Information………………………………………………………….. 359
25.95 Thales Group………………………………………………………………………………. 359
25.95.1 Company Profile……………………………………………………………….. 359
25.95.2 Safe City and Smart City Products……………………………………. 360
25.95.2.1 Air-Borne ISR Products………………………………………………….. 360
25.95.2.2 Unmanned Aerial Vehicle (UAV) Systems……………………… 360
25.95.2.3 Security Systems…………………………………………………………… 360
25.95.3 Safe City and Smart City Activities……………………………………. 361
25.95.4 Recent Events………………………………………………………………….. 361
25.95.5 Contact Information………………………………………………………….. 362
25.96 Thermo Electron Corporation……………………………………………………… 362
25.96.1 Company Profile……………………………………………………………….. 362
25.96.2 Safe City and Smart City Products……………………………………. 363
25.96.3 Recent Events………………………………………………………………….. 363
25.96.4 Contact Info………………………………………………………………………. 364
25.97 ThruVision Systems…………………………………………………………………….. 364
25.97.1 Company Profile……………………………………………………………….. 364
25.97.2 Safe City and Smart City Products……………………………………. 365
25.97.3 Recent Events………………………………………………………………….. 365
25.97.4 Contact Info………………………………………………………………………. 365
25.98 Total Recall…………………………………………………………………………………. 366
25.98.1 Company Profile……………………………………………………………….. 366
25.98.2 Safe City and Smart City Products……………………………………. 367
25.98.3 Safe City and Smart City Activities……………………………………. 368
25.98.4 Contact Information………………………………………………………….. 368
25.99 Unisys…………………………………………………………………………………………. 368
25.99.1 Company Profile……………………………………………………………….. 368
25.99.2 Safe City and Smart City Products……………………………………. 369
25.99.3 Recent Events………………………………………………………………….. 369
25.99.4 Contact Information………………………………………………………….. 369
25.100 Verint………………………………………………………………………………… 371
25.100.1 Company Profile……………………………………………………………….. 371
25.100.2 Safe City and Smart City Products……………………………………. 371
25.100.3 Safe City and Smart City Activities……………………………………. 372
25.100.4 Recent Events………………………………………………………………….. 373
25.100.5 Contact Information………………………………………………………….. 373
25.101 Vialogy LLC………………………………………………………………………. 374
25.101.1 Company Profile……………………………………………………………….. 374
25.101.2 Safe City & Smart City Products……………………………………….. 374
25.101.3 Safe City and Smart City Activities……………………………………. 374
25.101.4 Contact Information………………………………………………………….. 375
25.102 Vidisco Ltd………………………………………………………………………… 375
25.102.1 Company Profile……………………………………………………………….. 375
25.102.2 Safe City and Smart City Products……………………………………. 376
25.102.3 Contact Info………………………………………………………………………. 376
25.103 Vigilant Technology………………………………………………………….. 376
25.103.1 Company Profile……………………………………………………………….. 376
25.103.2 Safe City and Smart City Products……………………………………. 377
25.103.3 Safe City and Smart City Activities……………………………………. 377
25.103.4 Contact Information………………………………………………………….. 378
25.104 Westminster International Ltd…………………………………………… 379
25.104.1 Company Profile……………………………………………………………….. 379
25.104.2 Safe City and Smart City Products……………………………………. 379
25.104.3 Recent Events………………………………………………………………….. 380
25.104.4 Contact Info………………………………………………………………………. 380
25.105 Zhejiang Dahua Technology…………………………………………….. 381
25.105.1 Company Profile……………………………………………………………….. 381
25.105.2 Safe City and Smart City Products……………………………………. 381
25.105.3 Recent Events………………………………………………………………….. 381
25.105.4 Contact Information………………………………………………………….. 382
26 The Report Research Methodology……………………………………………………. 383
26.1 Safe City Report Structure………………………………………………………….. 383
26.2 Research Methodology……………………………………………………………….. 383
26.3 Whom Is This Report For?………………………………………………………….. 384
27 Disclaimer and Copyright……………………………………………………………………. 385