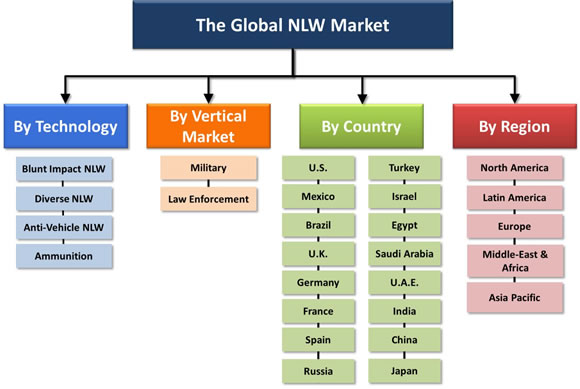
| 1 |
Executive Summary |
| 1.1 |
Major Findings |
| 1.2 |
Major Conclusions |
| 1.3 |
Global Non-Lethal Weapons (NLW) Market Outlook |
| 1.3.1 |
Global Non-Lethal Weapons Market by Technology – 2011-2020 |
| 1.3.2 |
Global Non-Lethal Weapons Market by Vertical Market (User Sector) – 2011-2020 |
| 1.3.3 |
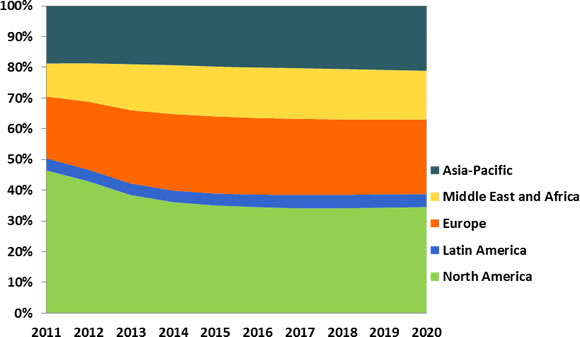
Global Non-Lethal Weapons Market by Region – 2011-2020 |
| 1.3.4 |
Global Non-Lethal Weapons Market by Country – 2011-2020 |
| |
GLOBAL MARKET |
| 2 |
NLW Market Drivers |
| 3 |
NLW Market Inhibitors |
| 4 |
Non-Lethal Weapons: Business Opportunities & Challenges |
| 5 |
Non-Lethal Weapons HLS & Public Safety Industry: SWOT Analysis |
| 5.1 |
Strengths |
| 5.2 |
Weaknesses |
| 5.3 |
Opportunities |
| 5.4 |
Threats |
| 6 |
NLW Market Competitive Analysis |
| 7 |
Global Non-Lethal Weapons Market by Technology – 2011-2020 |
| 8 |
Global Non-Lethal Weapons Market by Vertical Market (User Sector) – 2011-2020 |
| 8.1 |
Overview |
| 8.2 |
Global Military NLW Market – 2011-2020 |
| 8.3 |
Global Law Enforcement NLW Market – 2011-2020 |
| 9 |
Global Non-Lethal Weapons Market by Region – 2011-2020 |
| 9.1 |
Total NLW Market by Region – 2011-2020 |
| 9.2 |
Military NLW Market by Region – 2011-2020 |
| 9.3 |
Law Enforcement NLW Market by Region – 2011-2020 |
| 10 |
Global Non-Lethal Weapons Market by Country – 2011-2020 |
| |
REGIONAL MARKETS |
| 11 |
North America Non-Lethal Weapons Market – 2011-2020 |
| 11.1 |
North America NLW Market by Vertical Market (User Sector) – 2011-2020 |
| 11.2 |
North America Military NLW Market – 2011-2020 |
| 11.3 |
North America Law Enforcement NLW Market – 2011-2020 |
| 12 |
Latin America Non-Lethal Weapons Market – 2011-2020 |
| 12.1 |
Latin America NLW Market by Vertical Market (User Sector) – 2011-2020 |
| 12.2 |
Latin America Military NLW Market – 2011-2020 |
| 12.3 |
Latin America Law Enforcement NLW Market – 2011-2020 |
| 13 |
Europe Non-Lethal Weapons Market – 2011-2020 |
| 13.1 |
Europe NLW Market by Vertical Market (User Sector) – 2011-2020 |
| 13.2 |
Europe Military NLW Market – 2011-2020 |
| 13.3 |
Europe Law Enforcement NLW Market – 2011-2020 |
| 14 |
Middle East Non-Lethal Weapons Market – 2011-2020 |
| 14.1 |
Middle East NLW Market by Vertical Market (User Sector) – 2011-2020 |
| 14.2 |
Middle East Military NLW Market – 2011-2020 |
| 14.3 |
Middle East Law Enforcement NLW Market – 2011-2020 |
| 15 |
Asia-Pacific Non-Lethal Weapons Market – 2011-2020 |
| 15.1 |
South Korea NLW Market Background |
| 15.2 |
Australia NLW Market Background |
| 15.3 |
Asia-Pacific NLW Market by Vertical Market (User Sector) – 2011-2020 |
| 15.4 |
Asia-Pacific Military NLW Market – 2011-2020 |
| 15.5 |
Asia-Pacific Law Enforcement NLW Market – 2011-2020 |
| |
NATIONAL MARKETS |
| 16 |
U.S. Non-Lethal Weapons Market – 2011-2020 |
| 16.1 |
Introduction |
| 16.2 |
U.S. Law Enforcement Agencies Data |
| 16.3 |
U.S. DOD NLW |
| 16.4 |
DoD and DHS NLW Technologies Programs |
| 16.4.1 |
The DoD Joint Non-Lethal Weapons Programs |
| 16.4.2 |
Joint Integration Program (JIP) |
| 16.4.3 |
U.S. Army Non-Lethal Weapons Program |
| 16.4.4 |
U.S. Marine Corps Non-Lethal Weapons Programs |
| 16.4.5 |
U.S. Navy Non-Lethal Weapons Program |
| 16.4.6 |
U.S. Air Force Non-Lethal Weapons Program |
| 16.4.7 |
U.S. Special Operations Command Non-lethal Weapons Program |
| 16.4.8 |
U.S. Coast Guard Non-lethal Weapons Program |
| 16.5 |
U.S. NLW Market by Vertical Market (User Sector) – 2011-2020 |
| 16.6 |
U.S. Military NLW Market – 2011-2020 |
| 16.7 |
U.S. Law Enforcement NLW Market – 2011-2020 |
| 17 |
Mexican NLW Market – 2011 -2020 |
| 17.1 |
Mexico Market Background |
| 17.1.1 |
Geopolitical Background |
| 17.1.2 |
Facts & Figures |
| 17.1.3 |
Mexico Security Market |
| 17.1.4 |
Mexico Security Industry |
| 17.1.5 |
Terror & Crime in Mexico |
| 17.1.5.1 |
Terror in Mexico |
| 17.1.5.2 |
Crime in Mexico |
| 17.1.6 |
Mexico HLS & Public Safety Agencies |
| 17.2 |
Market Background |
| 17.3 |
Mexican NLW Market by Vertical Market (User Sector) – 2011-2020 |
| 17.4 |
Mexican Military NLW Market – 2011-2020 |
| 17.5 |
Mexican Law Enforcement NLW Market – 2011-2020 |
| 18 |
Brazilian Non-Lethal Weapons Market – 2011-2020 |
| 18.1 |
Brazil Market Background |
| 18.1.1 |
Facts & Figures |
| 18.1.2 |
Brazil Geopolitical Analysis |
| 18.1.3 |
Security Market |
| 18.1.4 |
Terror & Crime in Brazil |
| 18.1.4.1 |
Crime |
| 18.1.4.2 |
Counterterrorism-Related Activities |
| 18.1.5 |
Legislation & Law Enforcement |
| 18.1.6 |
Brazil HLS & Public Safety Agencies |
| 18.2 |
Market Background |
| 18.3 |
Brazilian NLW Market by Vertical Market (User Sector) – 2011-2020 |
| 18.4 |
Brazilian Military NLW Market – 2011-2020 |
| 18.5 |
Brazilian Law Enforcement NLW Market – 2011-2020 |
| 19 |
U.K. Non-Lethal Weapons Market – 2011-2020 |
| 19.1.1 |
Facts & Figures |
| 19.1.2 |
Economy |
| 19.1.3 |
U.K. Security Market |
| 19.1.4 |
U.K. Security Industry |
| 19.1.5 |
Terror & Crime in the U.K. |
| 19.1.5.1 |
Countering International Terrorism |
| 19.1.6 |
Legislation & Law Enforcement |
| 19.1.7 |
U.K. HLS & Public Safety Agencies |
| 19.2 |
Market Background |
| 19.3 |
U.K. NLW Market by Vertical Market (User Sector) – 2011-2020 |
| 19.4 |
U.K. Military NLW Market – 2011-2020 |
| 19.5 |
U.K. Law Enforcement NLW Market – 2011-2020 |
| 20 |
German Non-Lethal Weapons Market – 2011-2020 |
| 20.1.1 |
Facts & Figures |
| 20.1.2 |
Germany Short Range Geopolitical Outlook |
| 20.1.3 |
Economy |
| 20.1.4 |
Security Market |
| 20.1.5 |
Security Industry |
| 20.1.6 |
Terror & Crime in Germany |
| 20.1.7 |
Germany HLS & Public Safety Agencies |
| 20.2 |
German NLW Market by Vertical Market (User Sector) – 2011-2020 |
| 20.3 |
German Military NLW Market – 2011-2020 |
| 20.4 |
German Law Enforcement NLW Market – 2011-2020 |
| 21 |
French Non-Lethal Weapons Market – 2011-2020 |
| 21.1.1 |
Facts & Figures |
| 21.1.2 |
Economy |
| 21.1.3 |
Security Market |
| 21.1.4 |
HLS Market |
| 21.1.5 |
France Security Industry Companies |
| 21.1.6 |
Terror & Crime in France |
| 21.1.7 |
Legislation & Law Enforcement |
| 21.1.8 |
France HLS & Public Safety Agencies |
| 21.2 |
Market Background |
| 21.3 |
French NLW Market by Vertical Market (User Sector) – 2011-2020 |
| 21.4 |
French Military NLW Market – 2011-2020 |
| 21.5 |
French Law Enforcement NLW Market – 2011-2020 |
| 22 |
Spanish Non-Lethal Weapons Market – 2011-2020 |
| 22.1 |
Market Background |
| 22.1.1 |
Facts & Figures |
| 22.1.2 |
Economy |
| 22.1.3 |
Spain Security Market |
| 22.1.4 |
Terror & Crime in Spain |
| 22.1.4.1 |
Terror in Spain |
| 22.1.4.2 |
2012 Terrorist Incidents |
| 22.1.5 |
Legislation & Law Enforcement |
| 22.1.6 |
Spain HLS & Public Safety Agencies |
| 22.2 |
Spanish NLW Market by Vertical Market (User Sector) – 2011-2020 |
| 22.3 |
Spanish Military NLW Market – 2011-2020 |
| 22.4 |
Spanish Law Enforcement NLW Market – 2011-2020 |
| 23 |
Russian Non-Lethal Weapons Market – 2011-2020 |
| 23.1 |
Geopolitical Background |
| 23.1.1 |
Facts & Figures |
| 23.1.2 |
Economy |
| 23.1.3 |
Security Market in Russia |
| 23.1.4 |
Security Companies in Russia |
| 23.2 |
Terror & Crime in Russia |
| 23.2.1 |
Terror in Russia |
| 23.2.2 |
2013 Terrorist Incidents |
| 23.2.3 |
Crime in Russia |
| 23.2.4 |
Legislation & Law Enforcement in Russia |
| 23.3 |
Russia HLS & Public Safety Agencies |
| 23.4 |
Market Background |
| 23.5 |
Russian NLW Market by Vertical Market (User Sector) – 2011-2020 |
| 23.6 |
Russian Military NLW Market – 2011-2020 |
| 23.7 |
Russian Law Enforcement NLW Market – 2011-2020 |
| 24 |
Turkish Non-Lethal Weapons Market – 2011-2020 |
| 24.1 |
Market Background |
| 24.1.1 |
Facts & Figures |
| 24.1.2 |
Turkey Security Market |
| 24.1.3 |
Turkey Security Industry |
| 24.1.4 |
Terror & Crime in Turkey |
| 24.1.5 |
2012 Terrorist Incidents |
| 24.1.6 |
Legislation & Law Enforcement |
| 24.1.7 |
Turkey HLS & Public Safety Agencies |
| 24.2 |
Turkish NLW Market by Vertical Market (User Sector) – 2011-2020 |
| 24.3 |
Turkish Military NLW Market – 2011-2020 |
| 24.4 |
Turkish Law Enforcement NLW Market – 2011-2020 |
| 25 |
Israeli Non-Lethal Weapons Market – 2011-2020 |
| 25.1 |
Geopolitical Background |
| 25.1.1 |
Facts & Figures |
| 25.1.2 |
Israel Economy |
| 25.1.3 |
Israel Security Market |
| 25.1.4 |
Israel Homeland Security Industry |
| 25.1.5 |
Israel Defense Forces |
| 25.1.6 |
The Israeli National Police (INP), |
| 25.2 |
Terror, Crime & Natural Disasters in Israel |
| 25.2.1 |
Continued Terrorist Threats |
| 25.2.2 |
2012 Terrorist Incidents |
| 25.3 |
The Israeli NLW Market Background |
| 25.4 |
Israeli NLW Market by Vertical Market (User Sector) – 2011-2020 |
| 25.5 |
Israeli Military NLW Market – 2011-2020 |
| 25.6 |
Israeli Law Enforcement NLW Market – 2011-2020 |
| 26 |
Egyptian Non-Lethal Weapons Market – 2011-2020 |
| 26.1 |
Egyptian NLW Market by Vertical Market (User Sector) – 2011-2020 |
| 26.2 |
Egyptian Military NLW Market – 2011-2020 |
| 26.3 |
Egyptian Law Enforcement NLW Market – 2011-2020 |
| 27 |
Saudi Arabian Non-Lethal Weapons Market – 2011-2020 |
| 27.1 |
Saudi Arabia Market Background |
| 27.1.1 |
Economy |
| 27.1.2 |
Terror in Saudi Arabia |
| 27.1.2.1 |
2012 Terrorist Incidents |
| 27.1.3 |
Legislation & Law Enforcement |
| 27.1.4 |
Saudi Arabia HLS & Public Safety Agencies |
| 27.2 |
Market Background |
| 27.3 |
Saudi Arabian NLW Market by Vertical Market (User Sector) – 2011-2020 |
| 27.4 |
Saudi Arabian Military NLW Market – 2011-2020 |
| 27.5 |
Saudi Arabian Law Enforcement NLW Market – 2011-2020 |
| 28 |
UAE Non-Lethal Weapons Market – 2011-2020 |
| 28.1.1 |
Facts & Figures |
| 28.1.2 |
Economy |
| 28.1.3 |
U.A.E. Security Market |
| 28.1.4 |
Counterterrorism |
| 28.1.5 |
Legislation & Law Enforcement |
| 28.1.6 |
U.A.E. HLS Agencies |
| 28.2 |
Market Background |
| 28.3 |
UAE NLW Market by Vertical Market (User Sector) – 2011-2020 |
| 28.4 |
UAE Military NLW Market – 2011-2020 |
| 28.5 |
UAE Law Enforcement NLW Market – 2011-2020 |
| 29 |
Indian Non-Lethal Weapons Market – 2011-2020 |
| 29.1.1 |
Geopolitical Background |
| 29.1.2 |
India Short Range Geopolitical Outlook |
| 29.1.3 |
Economy |
| 29.1.4 |
Security Industry |
| 29.1.5 |
Security Market |
| 29.1.6 |
Terror in India |
| 29.1.7 |
Legislation & Law Enforcement |
| 29.1.8 |
India HLS & Public Safety Agencies |
| 29.2 |
Market Background |
| 29.3 |
Indian NLW Market by Vertical Market (User Sector) – 2011-2020 |
| 29.4 |
Indian Military NLW Market – 2011-2020 |
| 29.5 |
Indian Law Enforcement NLW Market – 2011-2020 |
| 30 |
Chinese Non-Lethal Weapons Market – 2011-2020 |
| 30.1 |
Geopolitical Background |
| 30.1.1 |
Facts & Figures |
| 30.1.2 |
Economy |
| 30.1.3 |
China Security Market |
| 30.1.4 |
Terror |
| 30.2 |
China HLS & Public Safety Agencies |
| 30.2.1 |
China Ministry of State Security |
| 30.3 |
Market Background |
| 30.4 |
Chinese NLW Market by Vertical Market (User Sector) – 2011-2020 |
| 30.5 |
Chinese Military NLW Market – 2011-2020 |
| 30.6 |
Chinese Law Enforcement NLW Market – 2011-2020 |
| 31 |
Japanese Non-Lethal Weapons Market – 2011-2020 |
| 31.1 |
Facts & Figures |
| 31.2 |
Economy |
| 31.3 |
Security Market |
| 31.4 |
Japan Security Industry |
| 31.5 |
Japan HLS & Public Safety Agencies |
| 31.6 |
Market Background |
| 31.7 |
Japanese NLW Market by Vertical Market (User Sector) – 2011-2020 |
| 31.8 |
Japanese Military NLW Market – 2011-2020 |
| 31.9 |
Japanese Law Enforcement NLW Market – 2011-2020 |
| |
TECHNOLOGIES |
| 32 |
Non-Lethal Weapon Technologies |
| 32.1 |
Several Non-Lethal Weapons & Systems Categories |
| 32.1.1 |
Kinetic Non-Lethal Weapons |
| 32.1.2 |
Direct-Fired Non-Lethal Projectiles |
| 32.1.3 |
Concurrently Launched Multiple Kinetic Projectiles |
| 32.1.4 |
NLW Sting-ball Grenades |
| 32.1.5 |
Chemical Non-Lethal Systems |
| 32.1.6 |
Area Denial NLW Procedures: |
| 32.1.7 |
Optical NLW Incapacitation Devices |
| 32.1.8 |
Acoustical Non-Lethal Devices |
| 32.1.9 |
Electro-Muscular NLW |
| 32.2 |
Counter-Personnel NLW Technologies |
| 32.2.1 |
Overview |
| 32.2.2 |
Electromagnetic NLW Technologies |
| 32.2.2.1 |
Microwave NLW |
| 32.2.2.2 |
Electromagnetic Launcher |
| 32.2.2.3 |
Electromagnetic Mines |
| 32.2.2.4 |
Laser Based NLW |
| 32.2.2.5 |
Multi-Purpose Dazzling Laser |
| 32.2.2.6 |
Pain Generation Laser |
| 32.2.3 |
Active Denial Weapon Microwave Technology |
| 32.2.4 |
Chemical NLW Technologies |
| 32.2.5 |
Acoustic NLW Technologies |
| 32.2.5.1 |
Overview |
| 32.2.5.2 |
Directional Multi-Effects Acoustic System |
| 32.2.6 |
Mechanical NLW Technologies |
| 32.2.6.1 |
Non-lethal Barriers and Entanglements |
| 32.2.6.2 |
Rapid Barriers |
| 32.2.6.3 |
Nets & Entanglement Techniques |
| 32.2.7 |
Kinetic NLW Technologies |
| 32.2.7.1 |
Overview |
| 32.2.7.2 |
Stun Devices |
| 32.2.7.3 |
Stun Batons |
| 32.2.7.4 |
Vortex Generator |
| 32.2.7.5 |
Airbag Stoppers |
| 32.2.7.6 |
Paints and Dyes |
| 32.2.8 |
Water Cannons |
| 32.2.9 |
Area Denial and Barrier Technologies |
| 32.2.10 |
Combined Technologies |
| 32.3 |
Counter-Material NLW Technologies |
| 32.3.1 |
Overview |
| 32.3.2 |
Electromagnetic Technologies |
| 32.3.2.1 |
Radio Frequency (RF) NLW Devices |
| 32.3.2.2 |
Laser |
| 32.3.3 |
Chemical Technologies |
| 32.3.3.1 |
Chemical Agents |
| 32.3.3.2 |
Slippery Foams |
| 32.3.3.3 |
Sticky Foams |
| 32.3.3.4 |
Super-Adhesive Substances |
| 32.3.3.5 |
Super-Caustic Substances/Liquid Metal Embrittlement |
| 32.3.3.6 |
Graphite Powders |
| 32.3.4 |
Biological Technologies |
| 32.3.5 |
Mechanical Technologies |
| 32.3.5.1 |
Rapid Barriers |
| 32.3.5.2 |
Nets & Entanglement Techniques |
| 32.3.5.3 |
Tire Puncturing Techniques |
| 33 |
NLW Technology Outlook-2014-2022 |
| 33.1 |
Counter-Personnel NLW Outlook |
| 33.1.1 |
Improved Flash Bang Grenade |
| 33.1.2 |
Airburst Non-Lethal Munitions |
| 33.1.3 |
Active Denial Tech System |
| 33.1.4 |
MK19 Non-Lethal Munitions |
| 33.1.5 |
Joint Non-Lethal Warning Munitions |
| 33.1.6 |
40mm Human-Electro-Muscular Incapacitation Projectile |
| 33.1.7 |
Mission Payload Module |
| 33.1.8 |
Distributed Sound and Light Array |
| 33.2 |
Counter-Material Non-Lethal Technologies Outlook |
| 33.2.1 |
Vehicle Lightweight Arresting Device Single Net Solution and Remote Deployment Device |
| 33.2.2 |
Pre-emplaced Electric Vehicle Stopper |
| 33.2.3 |
Small Vessel Stopping Entanglement |
| 33.2.4 |
Multi-Frequency Radio-Frequency Vehicle Stopper |
| 33.2.5 |
High Power Microwave Vehicle Stopper |
| 34 |
Non-Lethal Weapons Business Opportunities |
| |
PRODUCTS AND VENDORS |
| 35 |
Non-lethal Products |
| 35.1 |
Blunt Impact NLW-Kinetic Munitions |
| 35.3 |
Diverse Non-Lethal Weapons |
| 35.3.1 |
Background – Weapons that Halt or Disperse People |
| 35.3.2 |
Electro-Shock Stun Weapons (Taser) |
| 35.3.3 |
Stun Grenades |
| 35.3.4 |
Laser Scatters and Dazzlers |
| 35.3.5 |
DF/HF Lasers |
| 35.3.6 |
Foams |
| 35.3.7 |
Water Cannons |
| 35.3.8 |
High Intensity Directed Acoustics (HIDA) |
| 35.3.9 |
Tear Gas and Pepper Spray |
| 35.3.10 |
Stink Bombs |
| 35.3.11 |
Calmatives |
| 35.3.12 |
Acoustic Hailing Devices |
| 35.3.13 |
Optical Distracters |
| 35.3.14 |
Active Denial System |
| 35.3.15 |
Nets |
| 35.3.16 |
Chatsatsit (Gravel Thrower) |
| 35.3.17 |
MAUL (Multi-shot Accessory Under-barrel Launcher) |
| 35.3.18 |
Firestorm Grenade Launcher |
| 35.4 |
Anti-Vehicle Non-Lethal Weapons |
| 35.4.1 |
Caltrops |
| 35.4.2 |
Stinger Spike Strips |
| 35.4.3 |
Nets |
| 35.4.4 |
Barriers |
| 35.4.5 |
Slippery Foams |
| 36 |
Leading NLW Vendors |
| 36.1 |
Aardvark Tactical, Inc. |
| 36.2 |
Able 2 Products Company |
| 36.3 |
Alliant Techsystems |
| 36.4 |
AMTEC |
| 36.5 |
BAE Systems plc |
| 36.6 |
Bazalt |
| 36.7 |
Boeing |
| 36.8 |
Centech |
| 36.9 |
Chemring Defense |
| 36.10 |
Combined Tactical Systems, Inc. |
| 36.11 |
Defense Technology Corp. |
| 36.12 |
Fiocchi |
| 36.13 |
FN Herstal |
| 36.14 |
Goodrich Corporation |
| 36.15 |
Heckler and Koch |
| 36.16 |
General Dynamics Corporation |
| 36.17 |
ISPRA |
| 36.18 |
JAYCOR |
| 36.19 |
Kratos Defense & Security Solutions, Inc. |
| 36.20 |
L-3 Communications |
| 36.21 |
Lamperd Less Lethal Inc. |
| 36.22 |
LE Systems, Inc. |
| 36.23 |
LRAD Corporation |
| 36.24 |
Mace Security International, Inc. |
| 36.25 |
Megaray |
| 36.26 |
Metal Storm Limited |
| 36.27 |
Mikor |
| 36.28 |
MK Ballistic Systems |
| 36.29 |
Mossberg |
| 36.30 |
NonLethal Technologies, Inc. |
| 36.31 |
Penn Arms, Inc. |
| 36.32 |
PepperBall Technologies |
| 36.33 |
Policske Strojirny |
| 36.34 |
PW Defense |
| 36.35 |
Raytheon |
| 36.36 |
Remington Arms Company |
| 36.37 |
Royal Ordnance |
| 36.38 |
SEA Technology |
| 36.39 |
Security Devices International Inc. |
| 36.40 |
SNPE |
| 36.41 |
Taser International |
| 36.42 |
TFM |
| 36.43 |
Universal Propulsion |
| 36.44 |
Verney Carron |
| 36.45 |
ZARC International, Inc. |
| |
APPENDICES |
| 37 |
Appendix A: Less-Lethal Weapons Legislation |
| 38 |
Appendix B: Less-Lethal Products: Prices & Description |
| 38.1 |
Expandable Baton |
| 38.2 |
Wooden Baton |
| 38.3 |
Portable Bullhorn |
| 38.4 |
Ground-Mounted Bullhorn |
| 38.5 |
Individual Voice Amplification System (M7) |
| 38.6 |
High-Intensity Light |
| 38.7 |
Individual High-Intensity Light |
| 38.8 |
Individual High-Intensity Light Accessory Kit |
| 38.9 |
Disposable Restraint System |
| 38.10 |
Individual Riot Control Agent Dispenser |
| 38.11 |
Inert Individual Riot Control Agent Dispenser |
| 38.12 |
Midsized Riot Control Agent Dispensers |
| 38.13 |
High Volume Output High-Capacity Oleoresin Capsicum (OC) Dispenser |
| 38.14 |
Squad Riot Control Agent Dispenser |
| 38.15 |
Refill Unit Riot Control Agent (Live) |
| 38.16 |
12-Gauge Shotgun With High-Intensity Light Kit |
| 38.17 |
12-Gauge Gunstock Carrier (6 Round) |
| 38.18 |
12-Gauge Launching Cup |
| 38.19 |
Caltrops |
| 38.20 |
Roadside Spike Strip |
| 38.21 |
Riot Training Suit With Accessories |
| 38.22 |
Riot Training Bag |
| 38.23 |
12-Gauge Dummy Round |
| 38.24 |
12-Gauge Point Round |
| 38.25 |
12-Gauge Area Round |
| 38.26 |
12-Gauge Diversionary/Flash-Bang Round |
| 38.27 |
12-Gauge Launching Cup Cartridge |
| 38.28 |
12-Gauge Beanbag Round |
| 38.29 |
40 mm Area Round |
| 38.30 |
40 mm Foam Rubber Baton Round |
| 38.31 |
40 mm Sponge Point Grenade |
| 38.32 |
5.56 Point Round |
| 38.33 |
5.56 Area Round |
| 38.34 |
Diversionary/Flash-Bang Stun Hand Grenade |
| 38.35 |
Rubber Ball Hand Grenade |
| 38.36 |
Inert Rubber Ball Hand Grenade |
| 38.37 |
Light Vehicle Obscurant Smoke System (LVOSS) |
| 38.38 |
66 mm LVOSS Canister (Rubber Ball) |
| 38.39 |
66 mm LVOSS Canister (Diversionary/Flash-Bang) |
| 38.40 |
66 mm Riot Control Grenade (L96A1) |
| 38.41 |
66 mm Riot Control Training Grenade (L97A1) |
| 38.42 |
Modular Crowd Control Munition |
| 38.43 |
Portable Vehicle-Arresting Barrier (PVAB) |
| 38.44 |
Dissuader Laser Illuminator |
| 38.45 |
12-Gauge Rubber-Fin Stabilized Projectile Round |
| 38.46 |
12-Gauge Rubber Stingball Round |
| 38.47 |
Running Gear Entanglement System |
| 38.48 |
Copper Solid Sabot Slugs |
| 38.49 |
12-Gauge Peacekeeper |
| 38.50 |
ARWEN®37 mm Weapon System |
| 38.51 |
SAGE SL-6®37 mm Weapon System |
| 38.52 |
SAGE SL-1®37 mm Weapon System |
| 38.53 |
M-26 Advanced Taser |
| 38.54 |
40 mm Rifled Barrel Launcher With Mounted Holographic Site |
| 38.55 |
Pyrotechnic Grenade No. 2, CS |
| 38.56 |
Pyrotechnic Grenade No. 3, CS |
| 38.57 |
Pyrotechnic Grenade, Triple Charger |
| 38.58 |
37 mm Scat Shell, CS |
| 38.59 |
37 mm Impact Munition, Stinger |
| 38.60 |
37 mm Impact Munition (Kinetic), Foam Baton |
| 38.61 |
12-Gauge Impact Munition, Beanbag, Super Sock |
| 38.62 |
Aerosol Disburser MK-46? OC |
| 38.63 |
Aerosol Disburser, ProtectoJet 5? OC/CS |
| 38.64 |
Aerosol Disburser, OC/CS, MK-9 |
| 38.65 |
MK-4 Handheld OC Dispenser |
| 38.66 |
T-16 OC Nonpyrotechnic Expulsion Grenade |
| 38.67 |
No. 15 OC/CS Rubber Ball Munition |
| 38.68 |
PepperBall |
| 38.69 |
No. 15 Stinger?Grenade |
| 38.70 |
No. 20 37 mm Fired Foam Batons |
| 38.71 |
37 mm Beanbag Round |
| 38.72 |
Wooden Riot Baton |
| 38.73 |
Hot PAVA Powder Projectiles PC3-R375-8 |
| 38.74 |
Hot PAVA Powder Projectiles PC3-R375-1 |
| 38.75 |
Hot PAVA Powder Projectiles PC3-R375-2 |
| 38.76 |
Hot PAVA Powder Projectiles PC3-R375-4 |
| 38.77 |
Paintballs Clear 8000/CASE .43C 2000CL43 |