Top
HSRCExplosives & Weapons Detection Systems Market, Technologies & Industry – 2020-2025

Explosives & Weapons Detection Systems Market, Technologies & Industry - 2020-2025

5 volumes, 207 Sub-Markets Mega Report

  • November 2019
  • 1284
  • 647
    • 4950 $
    • 5950 $
    • 8950 $
    • 12000 $

    Small Businesses, Startups & Academia - Up to 50% Off

Quantity
IBM
Amazon
Sandia National Lab
HITACHI
Thales
Smiths Detection
Nuctech
Korea Internet & Security Agency
L3Harris
Huawei
Leidos
NEC
Toshiba
Deloitte
MAG

Want to customize this report?

If you purchase this report, you are entitled to a 30% discount towards customizing it, to better fit your market research and strategic needs. Our Custom Research and Industry Insights Department will work with you to better understand your information gaps and strategic needs and will provide you with a tailor-made market research report within a short period of time.

Why Choose Us?

30+ Years of Experience
We are a multidisciplinary team of Transformational Technologies industry experts with over 30 years of experience.
Gold Standard
With over 950 private sector clients (73% repeat customers), including major defense and security vendors, and Forbes Global 2000 companies, HSRC earned the reputation as the industry’s Gold Standard for Transformational Technologies Market Reports.
Tailored Research Services
Provide you with clear, actionable recommendations designed to empower decision making and to help you exploit emerging opportunities in the Transformational Technologies industries.
Information Security
Your personal information is safe and secure.

From: $4,950

Description

With 5 volumes, 1284 pages, 321 tables and 288 figures, the “Explosives & Weapons Detection Systems Market, Technologies & Industry – 2020-2025” report is the most comprehensive explosives  detection systems & weapons detection systems market report available today.

The report offers for each of its 207 sub-markets: 2016-2018 market data and analyses, as well as 2019-2025 estimations, forecasts and analyses.

The purpose of the “Explosives & Weapons Detection Systems Market, Technologies and Industry” report is to provide the industry’s decision-makers with insight and intelligence that will translate directly into bottom line results. To that end, the report concentrates on a detailed analysis of the current and future state of technologies and markets in each relevant industry segment, in terms of both technology and functionality.

Figure 1 – State-of-the-Art Explosives & Weapons Detection Technologies

Explosives Detection Systems & Weapons Detection Systems Market, Technologies & Industry – 2018-2025

The research is based on a unique team of high-level experts having a wealth of knowledge and years of experience in explosives & weapons detection technologies and markets.

A] The lead analyst of the report led a team of hundreds of engineers who developed and commercialized the following explosives and weapons detection products:

  • Explosives Trace Detectors
  • Tomographic EDSs
  • X-Ray Screening Systems
  • IED Mitigation Devices
  • Metal Detectors

B] The research team provided consultation services and customized reports on Explosives and Weapons Detection Technologies to the following governmental bodies and security agencies:

  • NATO
  • U.S. Congress
  • Sweden Customs Services
  • U.S GAO
  • Department of Homeland Security (DHS)
  • Israeli National Security Agency
  • IDF
  • U.S. DOD
  • U.S. Army
  • Israeli Counter Terror Agency

C] Beyond their experience our team of analysts undertook a number of initiatives striving to provide a comprehensive and in-depth study:

  • Team members participated, chaired and/or lectured in 26 Explosives & Weapons Detection conferences over the past 20 years
  • Published 75 explosives & weapons detection technologies & markets related reports over the past 16 years

D] Beyond their experience our team of analysts undertook a number of initiatives striving to provide a comprehensive and in-depth study:

  • Visited and interviewed Explosives & Weapons Detection companies
  • Reviewed and analyzed over 354 Explosives & Weapons Detection reports, papers, vendors and governmental information sources
  • Participated in 12 round table Explosives & Weapons Detection focus groups, including 65 Explosives & Weapons Detection experts and clients
  • Conducted 125 face-to-face interviews with industry executives, other experts and counter terror agencies officers
  • Reviewed Industry relevant corporations’ security exchange filing, websites & marketing literature

The report is granulated by 5 Regional, 44 National, 7 Vertical, 8 Technology and 3 Revenue Source Vectors resulting in 207 sub-markets as shown in the chart below

Explosives Detection Systems & Weapons Detection Systems Market, Technologies & Industry – 2018-2025

Top-down and bottom-up approaches were used to estimate and validate the size of the market as well as the various sub-markets in the entire explosives & weapons detection market. With a highly fragmented explosives & weapons detection market, we analyzed each dollar spent via 5 bottom-up research vectors including:

  • By 7 Vertical Markets:
    1. Aviation Security
    2. Maritime Security
    3. Land Transportation Security
    4. Secured Perimeters & Buildings
    5. Postal Security
    6. Public Venue Security
    7. Other Vertical Markets
  • By 8 Technology Markets:
    1. Explosives Trace Detection Systems (ETD)
    2. Metal Detectors
    3. Standoff Detection
    4. IoT & Predictive Maintenance
    5. EDS & BHS
    6. Full Body Scanners (AIT)
    7. X-ray Scanners (w/o AIT)
    8. Big Data & Data Analytics
  • By 3 Revenue Segments:
    1. Product Sales
    2. Aftersale Revenues
    3. Planning, Consulting & Training Services
  • By 5 Regional Markets:
    1. North America
    2. Latin America
    3. Europe
    4. Middle East and Africa
    5. Asia-Pacific
  • By 46 National Markets:
    1. U.S.
    2. Canada
    3. Mexico
    4. Colombia
    5. Brazil
    6. Argentina
    7. Rest of South America
    8. UK
    9. Germany
    10. Belgium
    11. France
    12. Spain
    13. Italy
    14. Poland
    15. Russia
    16. Sweden
    17. Netherlands
    18. Denmark
    19. Austria
    20. Czech Republic
    21. Poland
    22. Russia
    23. Rest of Europe
    1. Turkey
    2. Israel
    3. Saudi Arabia
    4. Qatar
    5. UAE
    6. Kuwait
    7. Nigeria
    8. South Africa
    9. Iraq
    10. Rest of Middle East & Africa
    11. Azerbaijan
    12. Kazakhstan
    13. Pakistan
    14. India
    15. China
    16. Taiwan
    17. South Korea
    18. Japan
    19. Malaysia
    20. Indonesia
    21. Australia
    22. Singapore
    23. Rest of Asia-Pacific

    The report presents: 

    40 Key Vendors: Profiles, Products & Contact Info.

    1. 1st Detect Corporation
    2. 3DX-Ray
    3. Adani
    4. Analysed Images
    5. Astrophysics Inc.
    6. Autoclear LLC
    7. Biosensor Applications AB
    8. Bruker Corporation
    9. CEIA
    10. DetectaChem, LLC
    11. EG&G Middle East
    12. Electronic Sensor Technology
    13. Eurologix Security Ltd.
    14. FLIR Systems Inc
    15. Gilardoni SpA
    16. Hitachi Ltd
    17. Ion Applications Inc.
    18. Ketech Defence
    19. L-3 Communictions
    20. Leidos Inc.
    1. LIXI Inc.
    2. MINXRAY, Inc.
    3. Mistral Security, Inc.
    4. Morpho Detection
    5. MS Tech.
    6. Nuctech Co. Ltd.
    7. Optosecurity
    8. OSI Systems
    9. RedXDefense
    10. SAIC
    11. SCANNA MSC Ltd.
    12. Sibel Ltd.
    13. Smiths Detection
    14. Todd Research Ltd.
    15. Vidisco Ltd.
    16. Rapiscan Systems
    17. Reveal Imaging Technologies
    18. Syagen Technology
    19. Thermo Fisher Schientific Inc.
    20. Westminster International

Market & Industry Analysis

Market drivers & inhibitors, SWOT analysis, barriers to entry, supplier power, buyer power & barriers to substitution.

Business Environment

Competitive analysis, industry analysis, price elasticity, mergers and acquisitions (M&A).

Business Opportunities and Challenges

Dozens of business opportunities, barriers to entry, supply-side & demand-side analysis, variable economic conditions, market tiers, defense primes & mega corporations’ inroads into the market, people screening market entry strategies.

Airports Screening Data 2016 & 2019

Details included for each airport: number of passengers screened and annual growth rate of passengers in more than 1800 airports.

For additional information, please refer to our  Explosives Detection Systems Market, Technologies & Industry – 2020-2025 report or the Explosives Trace Detection Market & ETD Technologies – 2017-2022 report.

For readers who wish to acquire more information, the report also includes 19 in-depth appendices:

  • Appendix A: 40 Countries Market Backgrounds
  • Appendix B: Improvised Explosives & Military Grade Explosives
  • Appendix C: X-Ray Baggage, Cargo, People, Container & Vehicle Explosives & Weapons Screening Technologies
  • Appendix D: Global Security Concerns
  • Appendix E: Standoff IED Detection Technologies
  • Appendix F: TSA Apex Checkpoint of the Future
  • Appendix G: Business & Technological Opportunities and Challenges
  • Appendix H: The Explosives & Weapons Detection Products Industry
  • Appendix I: Explosives & Weapons Detection Systems Industry: Business Models & Strategies
  • Appendix J: Cargo Facility Regulations
  • Appendix K: Air Cargo Approved Explosives Screening Systems (ACSTL)
  • Appendix L: Authorized Air-Cargo Screening Facilities Roster
  • Appendix M: IATA, Boeing, Airbus & ICAO Air Travel and Air Cargo Forecast to 2034
  • Appendix N: IATA Airport Screening Checkpoints Recommended
  • Appendix O: Israel Ben Gurion Airport Security Procedures
  • Appendix P: Explosives & Weapons Detection Related Product Standards
  • Appendix Q: International X-ray Explosives & Weapons Detection Systems Related Legislation
  • Appendix R: Security & Screening Related Big Data Technologies
  • Appendix S: Glossary & Abbreviations

Table of Contents

Download TOC as PDF

Volume 1 – Volume 5 – Explosives & Weapons Detection Systems – Table of Contents

Volume 1 – Table of Contents

1         Research Scope & Methodology. 16

1.1        Research Scope. 16

1.2        Information Sources. 18

1.3        Market Definition. 19

1.4        Market Analysis. 19

1.5        Research Methodology. 20

2         Executive Summary. 23

2.1        Major Findings. 23

2.2        Major Conclusions. 28

2.1        Explosives & Weapons Detection Market Dynamics & Opportunities. 33

2.2        Global Explosives & Weapons Detection Systems Market – 2016-2025. 34

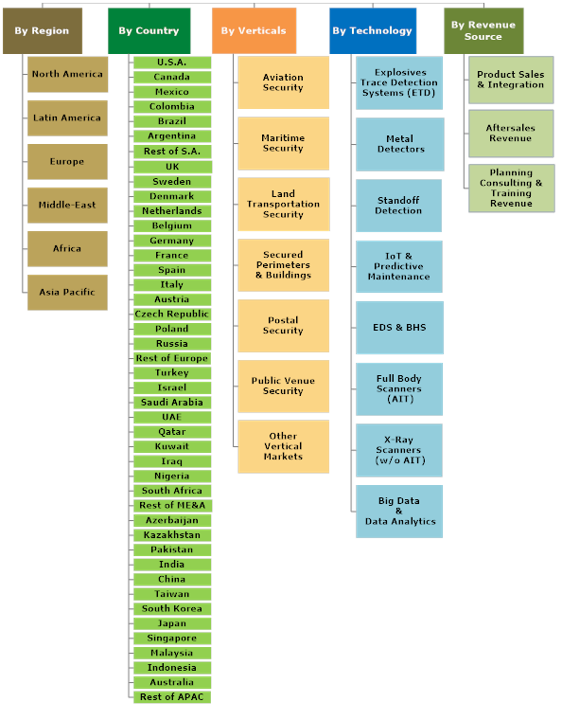
2.2.1             Global Explosives & Weapons Detection Vertical Markets. 34

2.2.2             Global Explosives & Weapons Detection Systems Technology Markets  35

2.2.3             Global Explosives & Weapons Detection Systems Market by Region   37

MARKET ANALYSIS.. 39

3         Explosives & Weapons Detection Systems: Market Drivers. 39

4         Explosives & Weapons Detection Systems: Market Inhibitors. 41

5         Explosives & Weapons Detection Industry: Business Opportunities & Challenges. 42

6         Explosives & Weapons Detection Systems Industry: SWOT Analysis. 44

6.1        Strengths. 44

6.2        Weaknesses. 45

6.3        Opportunities. 45

6.4        Threats. 46

7         Barriers to Entry, Supplier Power, Buyer Power & Barriers to Substitution   47

VERTICAL MARKETS.. 48

8         Global Explosives & Weapons Detection Systems Market by Vertical Market 48

8.1        Vertical Markets – 2016-2025. 48

8.2        Market Dynamics – 2016-2025. 49

8.3        Market Breakdown – 2016-2025. 50

9         Global Explosives & Weapons Detection Systems Aviation Security Market – 2016-2025. 52

9.1        Airport Security Market Background. 52

9.2        Aviation Explosives & Weapons Detection Systems Market: Drivers. 61

9.3        Aviation Explosives & Weapons Detection Screening Systems Market: Inhibitors. 62

9.4        Explosives & Weapons Detection Systems Aviation Security Market  – 2016-2025. 62

9.4.1             Market Size. 62

9.4.2             Market Dynamics. 63

9.4.3             Market Breakdown.. 63

10      Global Explosives & Weapons Detection Maritime Security Market – 2016-2025. 65

10.1     Maritime Weapons & Explosives Detection: Market Background. 65

10.2     Market Drivers. 65

10.3     Market Inhibitors. 66

10.4     Explosives & Weapons Detection Maritime Security Market  – 2016-2025  67

10.4.1          Market Size. 67

10.4.2          Market Dynamics. 68

10.4.3          Market Breakdown.. 69

11      Global Explosives & Weapons Detection Land Transportation Security Market – 2016-2025. 71

11.1     Land Transportation Security Market Background. 71

11.2     Market Drivers. 72

11.3     Market Inhibitors. 72

11.4     Explosives & Weapons Detection Land Transportation Security Market  – 2016-2025. 74

11.4.1          Market Size. 74

11.4.2          Market Dynamics. 75

11.4.3          Market Breakdown.. 75

12      Global Explosives & Weapons Detection Secured Perimeters & Buildings Market – 2016-2025. 77

12.1     Secured Perimeters & Buildings Market Background. 77

12.2     Explosives & Weapons Detection Secured Perimeters & Buildings Market  – 2016-2025. 78

12.2.1          Market Size. 78

12.2.2          Market Dynamics. 79

12.2.3          Market Breakdown.. 80

13      Global Explosives & Weapons Detection Systems Postal Security Market – 2016-2025. 82

13.1     Postal Explosives Detection Systems Market Background. 82

13.2     Market Drivers. 83

13.3     Market Inhibitors. 83

13.4     Explosives & Weapons Detection Systems Postal Security Market  – 2016-2025. 84

13.4.1          Market Size. 84

13.4.2          Market Dynamics. 85

13.4.3          Market Breakdown.. 85

14      Global Explosives & Weapons Detection Systems Public Venue Security Market – 2016-2025. 87

14.1     Public Venue Security Market Background. 87

14.2     Police Modernization & Other 1st Responders: Market Background. 87

14.2.1          Police Modernization Vectors. 92

14.2.2          Law Enforcement Agencies and Police Modernization Funding. 93

14.2.3          Police Modernization & Other 1st Responders Business Opportunities  93

14.3     Public Venue Security Market: SWOT Analysis. 95

14.3.1          Strengths. 95

14.3.2          Weaknesses. 96

14.3.3          Opportunities. 97

14.3.4          Threats. 98

14.4     Public Venue Security Market: Competitive Analysis. 99

14.5     Market Analysis. 100

14.5.1          Market Drivers. 100

14.5.2          Market Inhibitors. 101

14.6     Explosives & Weapons Detection Systems Public Venue Security Market  – 2016-2025. 101

14.6.1          Market Size. 101

14.6.2          Market Dynamics. 102

14.6.3          Market Breakdown.. 102

15      Global Explosives & Weapons Detection Systems Other Vertical Markets – 2016-2025. 104

15.1     Market Size. 104

15.2     Market Dynamics. 105

15.3     Market Breakdown.. 105

TECHNOLOGY MARKETS.. 107

16      Global Explosives & Weapons Detection Systems Market by Technology  107

16.1     Overview.. 107

16.1.1          Consolidated Market – 2016-2025. 107

16.1.2          Market Dynamics – 2016-2025. 108

16.1.3          Market Breakdown – 2016-2025. 109


17      Global Explosives Trace Detection (ETD) Market – 2016-2025. 111

17.1     ETD Market Background. 111

17.2     Global ETD Market Dynamics & Opportunities. 116

17.3     ETD Industry: Business Opportunities & Challenges. 118

18      ETD Market: SWOT Analysis. 119

18.1     Strengths. 119

18.2     Weaknesses. 120

18.3     Opportunities. 120

18.4     Threats. 120

18.5     ETD Market: Barriers to Entry, Supplier Power, Buyer Power & Barriers to Substitution.. 122

18.6     Explosives Trace Detection (ETD) Systems Market – 2016-2025. 123

18.6.1          Market Size. 123

18.6.2          Market Dynamics. 124

18.6.3          Market Breakdown.. 124

19      Global Metal Detection Market – 2016-2025. 126

19.1     Metal Detectors Market Background. 126

19.1.1          Hand-Held Metal Detectors Market Background. 126

19.1.1.1       Principles of Operation.. 126

19.1.1.2       Technology & Operational Essentials. 127

19.1.1.3       Hand-Held Metal Detectors – Technology Trends. 127

19.1.2          Metal Detection Portals. 128

19.1.2.1       Metal Detection Portals Market Background. 128

19.1.2.2       Metal Detection Portals Technology. 129

19.2     Metal Detectors: Business Opportunities & Challenges. 131

19.3     Metal Detectors Market: SWOT Analysis. 132

19.3.1          Strengths. 132

19.3.2          Weaknesses. 132

19.3.3          Opportunities. 132

19.3.4          Threats. 133

19.4     Metal Detectors Market – 2016-2025. 133

19.4.1          Market Size. 133

19.4.2          Market Dynamics. 134

19.4.3          Market Breakdown.. 134

20      Global Standoff Explosives & Weapons Detection Market – 2016-2025. 136

20.1     Standoff IED Mitigation Systems Market Background. 136

20.2     Counter-IED Technologies: Business Opportunities & Challenges. 140

20.2.1          Maintenance and Upgrades (Particularly of Jammers & Armored Trucks) 140

20.2.2          Sensors and Other Electronic Systems Upgrade. 141

20.2.3          Standoff Suicide Bombers Detection.. 141

20.2.4          Suicide Bombers Detonation Neutralization. 141

20.2.5          Standoff Detection of VBIED.. 141

20.2.6          VBIED Detonation Neutralization.. 142

20.2.7          Standoff Explosive Detection in Urban Environment 142

20.2.8          Large Area IED Detection Coverage. 142

20.2.9          IED Placement Detection.. 143

20.2.10       Active Armors for Vehicles. 143

20.3     Counter-IED Technologies Industry: SWOT Analysis. 143

20.3.1          Strengths. 143

20.3.2          Weaknesses. 144

20.3.3          Opportunities. 144

20.3.4          Threats. 144

20.4     Market Drivers. 145

20.5     Market Inhibitors. 145

20.6     Standoff Explosives & Weapons Detection: Market Background. 146

20.7     Standoff IED  Detection Technologies. 156

20.8     Standoff Detection Systems Market – 2016-2025. 160

20.8.1          Market Size. 160

20.8.2          Market Dynamics. 161

20.8.3          Market Breakdown.. 162

21      Global Explosives & Weapons Detection – IoT & Predictive Maintenance Market – 2016-2025. 164

21.1     Explosives & Weapons Detection – IoT & Predictive Maintenance Market Background. 164

21.2     Explosives & Weapons Detection Systems IoT & Predictive Maintenance Market – 2016-2025. 168

21.2.1          Market Size. 168

21.2.2          Market Dynamics. 169

21.2.3          Market Breakdown.. 169

22      Global Weapons & Explosives Detection Systems (EDS) & Baggage Handling Systems (BHS) Market – 2016-2025. 171

22.1     EDS & BHS Market Background. 171

22.2     EDS & BHS Market – 2016-2025. 173

22.2.1          Market Size. 173

22.2.2          Market Dynamics. 174

22.2.3          Market Breakdown.. 174

23      Global X-Ray & MMWave Full Body Scanners (AIT) Market – 2016-2025. 176

23.1     X-Ray & MMWave Full Body Scanners (AIT): Market Background. 176

23.1.1          The Advanced Technology (AIT) X-ray Systems. 176

23.1.2          Whole Body Scanners (AIT) 178

23.1.3          X-ray Backscatter AIT Portals. 181

23.2     Backscatter Imaging Technology – Principles of Operation.. 181

23.2.1          Risks/Benefits of X-Ray AIT Systems. 181

23.2.1.1       Sample System.. 183

23.2.2          Currently Available X-ray Backscatter Portals. 183

23.3     Active MMWave Whole Body AIT Scanners. 183

23.3.1          Principles of Operation.. 183

23.4     Techno-Tactical & Economic Considerations. 188

23.4.1          Sample Systems. 188

23.5     Passive MMWave Whole Body Scanners. 189

23.5.1          Principle of Operation.. 190

23.5.2          System Example: Millivision 350 Portal 190

23.6     Other X-Ray Whole Body Scanners Technologies. 192

23.7     Full Body Scanners (AIT) Market – 2016-2025. 192

23.7.1          Market Size. 192

23.7.2          Market Dynamics. 193

23.7.3          Market Breakdown.. 193

24      Global X-Ray Scanners Market – 2016-2025. 195

24.1     X-Ray Scanners: Market Background. 195

24.2     Market Dynamics & Opportunities. 197

24.3     X-ray Screening Systems: Market Drivers. 198

24.4     X-ray Screening Systems: Market Inhibitors. 200

24.5     X-ray Security Industry: Business Opportunities & Challenges. 201

24.6     X-ray Screening Systems Industry: SWOT Analysis. 202

24.6.1          Strengths. 202

24.6.2          Weaknesses. 203

24.6.3          Opportunities. 203

24.6.4          Threats. 203

24.7     Barriers to Entry, Supplier Power, Buyer Power & Barriers to Substitution   205

24.8     X-Ray weapons & Explosives Detection Technologies. 206

24.9     Explosives & Weapons Detection X-ray Scanners (w/o AIT) Market – 2016-2025. 206

24.9.1          Market Size. 206

24.9.2          Market Dynamics. 207

24.9.3          Market Breakdown.. 207

25      Global Explosives & Weapons Detection: Big Data Systems Market – 2016-2025. 209

25.1     Explosives & Weapons Detection & Screening: Big Data  & Data Analytics Systems: Market Background. 209

25.1.1          Summary. 209

25.1.2          Proliferation of Data. 211

25.1.3          Main Personal Data Sources for Explosives & Weapons Detection Big Data & Data Analytics Projects. 212

25.1.4          Big Data and Data Analytics in Explosives & Weapons Detection Systems  212

25.1.5          Market Drivers. 213

25.1.6          Market Inhibitors. 214

25.1.7          Big Data in Homeland Security Vendors. 214

25.2     Explosives & Weapons Detection Systems Big Data & Data Analytics Market – 2016-2025. 215

25.2.1          Market Size. 215

25.2.2          Market Dynamics. 216

25.2.3          Market Breakdown.. 216

REGIONAL & NATIONAL MARKETS.. 218

26      Global Explosives & Weapons Detection Systems Market by Region.. 218

26.1     Consolidated Market – 2016-2025. 218

26.2     Market Dynamics – 2016-2025. 219

26.3     Market Breakdown – 2016-2025. 219

Volume 2 – Table of Contents


NORTH AMERICA MARKET.. 26

1         North America Explosives & Weapons Detection Systems Market – 2016-2025  26

1.1        North America Explosives & Weapons Detection Vertical Markets. 26

1.1.1             Market Size – 2016-2025. 26

1.1.2             Market Dynamics – 2016-2025. 27

1.1.3             Market Breakdown – 2016-2025. 28

1.2        North America Explosives & Weapons Detection Technology Markets. 29

1.2.1             Consolidated Market – 2016-2025. 29

1.2.2             Market Dynamics – 2016-2025. 31

1.2.3             Market Breakdown – 2016-2025. 31

1.3        North America Explosives & Weapons Detection Systems Market by Country  33

2         U.S. Explosives & Weapons Detection Systems Market – 2016-2025. 34

2.1        U.S. Explosives & Weapons Detection Systems Market 34

2.1.1             Market Forecast – 2016-2025. 34

2.1.2             Market Dynamics – 2016-2025. 36

2.1.3             Market Breakdown – 2016-2025. 36

3         Canada Explosives & Weapons Detection Systems Market – 2016-2025. 38

3.1        Canada Explosives & Weapons Detection Systems Market 38

3.1.1             Market Forecast – 2016-2025. 38

3.1.2             Market Dynamics – 2016-2025. 40

3.1.3             Market Breakdown – 2016-2025. 40

LATIN AMERICA MARKET.. 42

4         Latin America Explosives & Weapons Detection Systems Market – 2016-2025  42

4.1        Latin America Explosives & Weapons Detection Vertical Markets. 42

4.1.1             Market Size – 2016-2025. 42

4.1.2             Market Dynamics – 2016-2025. 43

4.1.3             Market Breakdown – 2016-2025. 44

4.2        Latin America Explosives & Weapons Detection Technology Markets. 45

4.2.1             Consolidated Market – 2016-2025. 45

4.2.2             Market Dynamics – 2016-2025. 47

4.2.3             Market Breakdown – 2016-2025. 47

4.3        Latin America Explosives & Weapons Detection Systems Market by Country  49

5         Mexico Explosives & Weapons Detection Systems Market – 2016-2025. 50

5.1        Mexico Explosives & Weapons Detection Systems Market 50

5.1.1             Market Forecast – 2016-2025. 50

5.1.2             Market Dynamics – 2016-2025. 52

5.1.3             Market Breakdown – 2016-2025. 52

6         Colombia Explosives & Weapons Detection Systems Market – 2016-2025  54

6.1        Colombia Explosives & Weapons Detection Systems Market 54

6.1.1             Market Forecast – 2016-2025. 54

6.1.2             Market Dynamics – 2016-2025. 56

6.1.3             Market Breakdown – 2016-2025. 56

7         Brazil Explosives & Weapons Detection Systems Market – 2016-2025. 58

7.1        Brazil Explosives & Weapons Detection Systems Market 58

7.1.1             Market Forecast – 2016-2025. 58

7.1.2             Market Dynamics – 2016-2025. 60

7.1.3             Market Breakdown – 2016-2025. 60

8         Argentina Explosives & Weapons Detection Systems Market – 2016-2025  62

8.1        Argentina Explosives & Weapons Detection Systems Market 62

8.1.1             Market Forecast – 2016-2025. 62

8.1.2             Market Dynamics – 2016-2025. 64

8.1.3             Market Breakdown – 2016-2025. 64

9         Other Latin America Explosives & Weapons Detection Systems Market – 2016-2025. 66

9.1        Other Latin America Explosives & Weapons Detection Systems Market 66

9.1.1             Market Forecast – 2016-2025. 66

9.1.2             Market Dynamics – 2016-2025. 68

9.1.3             Market Breakdown – 2016-2025. 68

EUROPE MARKET.. 70

10      Europe Explosives & Weapons Detection Systems Market – 2016-2025. 70

10.1     Europe Explosives & Weapons Detection Vertical Markets. 70

10.1.1          Market Size – 2016-2025. 70

10.1.2          Market Dynamics – 2016-2025. 71

10.1.3          Market Breakdown – 2016-2025. 72

10.2     Europe Explosives & Weapons Detection Technology Markets. 73

10.2.1          Consolidated Market – 2016-2025. 73

10.2.2          Market Dynamics – 2016-2025. 75

10.2.3          Market Breakdown – 2016-2025. 75

10.3     Europe Explosives & Weapons Detection Systems Market by Country. 76

11      U.K. Explosives & Weapons Detection Systems Market – 2016-2025. 79

11.1     U.K. Explosives & Weapons Detection Systems Market 79

11.1.1          Market Forecast – 2016-2025. 79

11.1.2          Market Dynamics – 2016-2025. 81

11.1.3          Market Breakdown – 2016-2025. 81

12      Sweden Explosives & Weapons Detection Systems Market – 2016-2025. 83

12.1     Sweden Explosives & Weapons Detection Systems Market 83

12.1.1          Market Forecast – 2016-2025. 83

12.1.2          Market Dynamics – 2016-2025. 85

12.1.3          Market Breakdown – 2016-2025. 85

13      Denmark Explosives & Weapons Detection Systems Market – 2016-2025. 87

13.1     Denmark Explosives & Weapons Detection Systems Market 87

13.1.1          Market Forecast – 2016-2025. 87

13.1.2          Market Dynamics – 2016-2025. 89

13.1.3          Market Breakdown – 2016-2025. 89

14      Netherlands Explosives & Weapons Detection Systems Market – 2016-2025  91

14.1     Netherlands Explosives & Weapons Detection Systems Market 91

14.1.1          Market Forecast – 2016-2025. 91

14.1.2          Market Dynamics – 2016-2025. 93

14.1.3          Market Breakdown – 2016-2025. 93

15      Belgium Explosives & Weapons Detection Systems Market – 2016-2025. 95

15.1     Belgium Explosives & Weapons Detection Systems Market 95

15.1.1          Market Forecast – 2016-2025. 95

15.1.2          Market Dynamics – 2016-2025. 97

15.1.3          Market Breakdown – 2016-2025. 97

16      Germany Explosives & Weapons Detection Systems Market – 2016-2025. 99

16.1     Germany Explosives & Weapons Detection Systems Market 99

16.1.1          Market Forecast – 2016-2025. 99

16.1.2          Market Dynamics – 2016-2025. 101

16.1.3          Market Breakdown – 2016-2025. 101

17      France Explosives & Weapons Detection Systems Market – 2016-2025. 103

17.1     France Explosives & Weapons Detection Systems Market 103

17.1.1          Market Forecast – 2016-2025. 103

17.1.2          Market Dynamics – 2016-2025. 105

17.1.3          Market Breakdown – 2016-2025. 105

18      Spain Explosives & Weapons Detection Systems Market – 2016-2025. 107

18.1     Spain Explosives & Weapons Detection Systems Market 107

18.1.1          Market Forecast – 2016-2025. 107

18.1.2          Market Dynamics – 2016-2025. 109

18.1.3          Market Breakdown – 2016-2025. 109

19      Italy Explosives & Weapons Detection Systems Market – 2016-2025. 111

19.1     Italy Explosives & Weapons Detection Systems Market 111

19.1.1          Market Forecast – 2016-2025. 111

19.1.2          Market Dynamics – 2016-2025. 113

19.1.3          Market Breakdown – 2016-2025. 113

20      Austria Explosives & Weapons Detection Systems Market – 2016-2025. 115

20.1     Austria Explosives & Weapons Detection Systems Market 115

20.1.1          Market Forecast – 2016-2025. 115

20.1.2          Market Dynamics – 2016-2025. 117

20.1.3          Market Breakdown – 2016-2025. 117

21      Czech Republic Explosives & Weapons Detection Systems Market – 2016-2025. 119

21.1     Czech Republic Explosives & Weapons Detection Systems Market 119

21.1.1          Market Forecast – 2016-2025. 119

21.1.2          Market Dynamics – 2016-2025. 121

21.1.3          Market Breakdown – 2016-2025. 121

22      Poland Explosives & Weapons Detection Systems Market – 2016-2025. 123

22.1     Poland Explosives & Weapons Detection Systems Market 123

22.1.1          Market Forecast – 2016-2025. 123

22.1.2          Market Dynamics – 2016-2025. 125

22.1.3          Market Breakdown – 2016-2025. 125

23      Russia Explosives & Weapons Detection Systems Market – 2016-2025. 127

23.1     Russia Explosives & Weapons Detection Systems Market 127

23.1.1          Market Forecast – 2016-2025. 127

23.1.2          Market Dynamics – 2016-2025. 129

23.1.3          Market Breakdown – 2016-2025. 129

24      Other European Countries Explosives & Weapons Detection Systems Market – 2016-2025. 131

24.1     Other European Countries Explosives & Weapons Detection Systems Market 131

24.1.1          Market Forecast – 2016-2025. 131

24.1.2          Market Dynamics – 2016-2025. 133

24.1.3          Market Breakdown – 2016-2025. 133

MIDDLE EAST & AFRICA MARKET.. 135

25      Middle East & Africa Explosives & Weapons Detection Systems Market – 2016-2025. 135

25.1     Middle East & Africa Explosives & Weapons Detection Vertical Markets  135

25.1.1          Market Size – 2016-2025. 135

25.1.2          Market Dynamics – 2016-2025. 136

25.1.3          Market Breakdown – 2016-2025. 137

25.2     Middle East & Africa Explosives & Weapons Detection Technology Markets  138

25.2.1          Consolidated Market – 2016-2025. 138

25.2.2          Market Dynamics – 2016-2025. 140

25.2.3          Market Breakdown – 2016-2025. 140

25.3     MEA Explosives & Weapons Detection Systems Market by Country. 142

26      Turkey Explosives & Weapons Detection Systems Market – 2016-2025. 143

26.1     Turkey Explosives & Weapons Detection Systems Market 143

26.1.1          Market Forecast – 2016-2025. 143

26.1.2          Market Dynamics – 2016-2025. 145

26.1.3          Market Breakdown – 2016-2025. 145

27      Israel Explosives & Weapons Detection Systems Market – 2016-2025. 147

27.1     Israel Explosives & Weapons Detection Systems Market 147

27.1.1          Market Forecast – 2016-2025. 147

27.1.2          Market Dynamics – 2016-2025. 149

27.1.3          Market Breakdown – 2016-2025. 149

28      Saudi Arabia Explosives & Weapons Detection Systems Market – 2016-2025  151

28.1     Saudi Arabia Explosives & Weapons Detection Systems Market 151

28.1.1          Market Forecast – 2016-2025. 151

28.1.2          Market Dynamics – 2016-2025. 153

28.1.3          Market Breakdown – 2016-2025. 153


29      UAE Explosives & Weapons Detection Systems Market – 2016-2025. 155

29.1     UAE Explosives & Weapons Detection Systems Market 155

29.1.1          Market Forecast – 2016-2025. 155

29.1.2          Market Dynamics – 2016-2025. 157

29.1.3          Market Breakdown – 2016-2025. 157

30      Qatar Explosives & Weapons Detection Systems Market – 2016-2025. 159

30.1     Qatar Explosives & Weapons Detection Systems Market 159

30.1.1          Market Forecast – 2016-2025. 159

30.1.2          Market Dynamics – 2016-2025. 161

30.1.3          Market Breakdown – 2016-2025. 161

31      Kuwait Explosives & Weapons Detection Systems Market – 2016-2025. 163

31.1     Kuwait Explosives & Weapons Detection Systems Market 163

31.1.1          Market Forecast – 2016-2025. 163

31.1.2          Market Dynamics – 2016-2025. 165

31.1.3          Market Breakdown – 2016-2025. 165

32      Iraq Explosives & Weapons Detection Systems Market – 2016-2025. 167

32.1     Iraq Explosives & Weapons Detection Systems Market 167

32.1.1          Market Forecast – 2016-2025. 167

32.1.2          Market Dynamics – 2016-2025. 169

32.1.3          Market Breakdown – 2016-2025. 169

33      Nigeria Explosives & Weapons Detection Systems Market – 2016-2025. 171

33.1     Nigeria Explosives & Weapons Detection Systems Market 171

33.1.1          Market Forecast – 2016-2025. 171

33.1.2          Market Dynamics – 2016-2025. 173

33.1.3          Market Breakdown – 2016-2025. 173

34      South Africa Explosives & Weapons Detection Systems Market – 2016-2025  175

34.1     South Africa Explosives & Weapons Detection Systems Market 175

34.1.1          Market Forecast – 2016-2025. 175

34.1.2          Market Dynamics – 2016-2025. 177

34.1.3          Market Breakdown – 2016-2025. 177

35      Other MEA Countries Explosives & Weapons Detection Systems Market – 2016-2025. 179

35.1     Other MEA Countries Explosives & Weapons Detection Systems Market 179

35.1.1          Market Forecast – 2016-2025. 179

35.1.2          Market Dynamics – 2016-2025. 181

35.1.3          Market Breakdown – 2016-2025. 181

ASIA-PACIFIC MARKET.. 183

36      Asia-Pacific Explosives & Weapons Detection Systems Market – 2016-2025  183

36.1     Asia-Pacific Explosives & Weapons Detection Vertical Markets. 183

36.1.1          Market Size – 2016-2025. 183

36.1.2          Market Dynamics – 2016-2025. 184

36.1.3          Market Breakdown – 2016-2025. 185

36.2     Asia-Pacific Explosives & Weapons Detection Technology Markets. 186

36.2.1          Consolidated Market – 2016-2025. 186

36.2.2          Market Dynamics – 2016-2025. 188

36.2.3          Market Breakdown – 2016-2025. 188

36.3     APAC Explosives & Weapons Detection Systems Market by Country. 190

37      Azerbaijan Explosives & Weapons Detection Systems Market – 2016-2025  192

37.1     Azerbaijan Explosives & Weapons Detection Systems Market 192

37.1.1          Market Forecast – 2016-2025. 192

37.1.2          Market Dynamics – 2016-2025. 194

37.1.3          Market Breakdown – 2016-2025. 194

38      Kazakhstan Explosives & Weapons Detection Systems Market – 2016-2025  196

38.1     Kazakhstan Explosives & Weapons Detection Systems Market 196

38.1.1          Market Forecast – 2016-2025. 196

38.1.2          Market Dynamics – 2016-2025. 198

38.1.3          Market Breakdown – 2016-2025. 198

39      Pakistan Explosives & Weapons Detection Systems Market – 2016-2025. 200

39.1     Pakistan Explosives & Weapons Detection Systems Market 200

39.1.1          Market Forecast – 2016-2025. 200

39.1.2          Market Dynamics – 2016-2025. 202

39.1.3          Market Breakdown – 2016-2025. 202

40      India Explosives & Weapons Detection Systems Market – 2016-2025. 204

40.1     India Explosives & Weapons Detection Systems Market 204

40.1.1          Market Forecast – 2016-2025. 204

40.1.2          Market Dynamics – 2016-2025. 206

40.1.3          Market Breakdown – 2016-2025. 206

41      China Explosives & Weapons Detection Systems Market – 2016-2025. 208

41.1     China Explosives & Weapons Detection Systems Market 208

41.1.1          Market Forecast – 2016-2025. 208

41.1.2          Market Dynamics – 2016-2025. 210

41.1.3          Market Breakdown – 2016-2025. 210

42      Taiwan Explosives & Weapons Detection Systems Market – 2016-2025. 212

42.1     Taiwan Explosives & Weapons Detection Systems Market 212

42.1.1          Market Forecast – 2016-2025. 212

42.1.2          Market Dynamics – 2016-2025. 214

42.1.3          Market Breakdown – 2016-2025. 214

43      South Korea Explosives & Weapons Detection Systems Market – 2016-2025  216

43.1     South Korea Explosives & Weapons Detection Systems Market 216

43.1.1          Market Forecast – 2016-2025. 216

43.1.2          Market Dynamics – 2016-2025. 218

43.1.3          Market Breakdown – 2016-2025. 218

44      Japan Explosives & Weapons Detection Systems Market – 2016-2025. 220

44.1     Japan Explosives & Weapons Detection Systems Market 220

44.1.1          Market Forecast – 2016-2025. 220

44.1.2          Market Dynamics – 2016-2025. 222

44.1.3          Market Breakdown – 2016-2025. 222

45      Singapore Explosives & Weapons Detection Systems Market – 2016-2025  224

45.1     Singapore Explosives & Weapons Detection Systems Market 224

45.1.1          Market Forecast – 2016-2025. 224

45.1.2          Market Dynamics – 2016-2025. 226

45.1.3          Market Breakdown – 2016-2025. 226

46      Malaysia Explosives & Weapons Detection Systems Market – 2016-2025. 228

46.1     Malaysia Explosives & Weapons Detection Systems Market 228

46.1.1          Market Forecast – 2016-2025. 228

46.1.2          Market Dynamics – 2016-2025. 230

46.1.3          Market Breakdown – 2016-2025. 230

47      Indonesia Explosives & Weapons Detection Systems Market – 2016-2025  232

47.1     Indonesia Explosives & Weapons Detection Systems Market 232

47.1.1          Market Forecast – 2016-2025. 232

47.1.2          Market Dynamics – 2016-2025. 234

47.1.3          Market Breakdown – 2016-2025. 234

48      Australia Explosives & Weapons Detection Systems Market – 2016-2025. 236

48.1     Australia Explosives & Weapons Detection Systems Market 236

48.1.1          Market Forecast – 2016-2025. 236

48.1.2          Market Dynamics – 2016-2025. 238

48.1.3          Market Breakdown – 2016-2025. 238

49      Other APAC Countries Explosives & Weapons Detection Systems Market – 2016-2025. 240

49.1     Other APAC Countries Explosives & Weapons Detection Systems Market 240

49.1.1          Market Forecast – 2016-2025. 240

49.1.2          Market Dynamics – 2016-2025. 242

49.1.3          Market Breakdown – 2016-2025. 242

Volume 3 – Table of Contents

VENDORS.. 7

1         Leading Explosives Trace Detectors Vendors. 7

1.1        1st Detect Corporation.. 7

1.1.1             Company Profile. 7

1.1.2             Contact Info. 7

1.1.3             Products. 8

1.2        3DX-RAY.. 9

1.2.1             Company Profile. 9

1.2.2             Contact Info. 9

1.2.3             Products. 9

1.3        Adani 10

1.3.1             Company Profile. 10

1.3.2             Contact Info. 10

1.3.3             Products. 11

1.4        Analysed Images. 11

1.4.1             Company Profile. 11

1.4.2             Contact Info. 12

1.4.3             Products. 12

1.5        Astrophysics Inc. 12

1.5.1             Company Profile. 12

1.5.2             Contact Info. 13

1.5.3             Products. 13

1.6        Autoclear LLC.. 15

1.6.1             Company Profile. 15

1.6.2             Contact Info. 15

1.6.3             Products. 16

1.7        Biosensor Applications AB.. 18

1.7.1             Company Profile. 18

1.7.2             Contact Info. 18

1.7.3             Products. 19

1.8        Bruker Corporation.. 20

1.8.1             Company Profile. 20

1.8.2             Contact Info. 20

1.8.3             Products. 21

1.9        C.E.I.A. S.p.A. 21

1.9.1             Company Profile. 21

1.9.2             Contact Info. 22

1.9.3             Products. 22

1.10     DetectaChem, LLC.. 23

1.10.1          Company Profile. 23

1.10.2          Contact Info. 23

1.10.3          Products. 24

1.11     EG&G Middle East 24

1.11.1          Company Profile. 24

1.11.2          Contact Info. 25

1.11.3          Products. 25

1.12     Electronic Sensor Technology. 27

1.12.1          Company Profile. 27

1.12.2          Contact Info. 27

1.12.3          Products. 27

1.13     Eurologix Security Ltd. 28

1.13.1          Company Profile. 28

1.13.2          Contact Info. 28

1.13.3          Products. 29

1.14     FLIR Systems, Inc. 30

1.14.1          Company Profile. 30

1.14.2          Contact Info. 31

1.14.3          Products. 31

1.15     Gilardoni SpA.. 33

1.15.1          Company Profile. 33

1.15.2          Contact Info. 33

1.15.3          Products. 34

1.16     Hitachi, Ltd. 37

1.16.1          Company Profile. 37

1.16.2          Contact Info. 37

1.16.3          Products. 37

1.17     Ion Applications, Inc. 38

1.17.1          Company Profile. 38

1.17.2          Contact Info. 38

1.17.3          Products. 39

1.18     Ketech Defence. 39

1.18.1          Company Profile. 39

1.18.2          Contact Info. 40

1.18.3          Products. 40

1.19     L-3 Communications Security & Detection Systems. 41

1.19.1          Company Profile. 41

1.19.2          Contact Info. 41

1.19.3          Products. 42

1.20     Leidos, Inc. 47

1.20.1          Company Profile. 47

1.20.2          Contact Info. 47

1.20.3          Products. 48

1.21     LIXI, Inc. 48

1.21.1          Company Profile. 48

1.21.2          Contact Info. 48

1.21.3          Products. 49

1.22     MINXRAY, Inc. 50

1.22.1          Company Profile. 50

1.22.2          Contact Info. 50

1.22.3          Products. 51

1.23     Mistral Security, Inc. 51

1.23.1          Company Profile. 51

1.23.2          Contact Info. 51

1.23.3          Products. 52

1.24     Morpho Detection Inc. 52

1.24.1          Company Profile. 52

1.24.2          Contact Info. 52

1.24.3          Products. 53

1.25     MS Tech.. 58

1.25.1          Company Profile. 58

1.25.2          Products. 58

1.25.3          Contact Info. 59

1.26     Nuctech Co. Ltd. 59

1.26.1          Company Profile. 59

1.26.2          Contact Info. 59

1.26.3          Products. 60

1.27     Optosecurity. 70

1.27.1          Company Profile. 70

1.27.2          Contact Info. 70

1.27.3          Products. 71

1.28     OSI Systems. 71

1.28.1          Company Profile. 71

1.28.2          Contact Info. 72

1.28.3          Products. 72

1.29     RedXDefense. 73

1.29.1          Company Profile. 73

1.29.2          Contact Info. 73

1.29.3          Products. 74

1.30     SAIC.. 74

1.30.1          Company Profile. 74

1.30.2          Contact Info. 75

1.30.3          Products. 75

1.31     SCANNA MSC Ltd. 76

1.31.1          Company Profile. 76

1.31.2          Contact Info. 76

1.31.3          Products. 77

1.32     Sibel Ltd. 78

1.32.1          Company Profile. 78

1.32.2          Contact Info. 78

1.32.3          Products. 79

1.33     Smiths Detection.. 80

1.33.1          Company Profile. 80

1.33.2          Contact Info. 80

1.33.3          Products. 81

1.34     Todd Research Ltd. 92

1.34.1          Company Profile. 92

1.34.2          Contact Info. 93

1.34.3          Products. 93

1.35     Vidisco Ltd. 94

1.35.1          Company Profile. 94

1.35.2          Contact Info. 94

1.35.3          Products. 95

1.36     Rapiscan Systems, Inc. 95

1.36.1          Company Profile. 95

1.36.2          Contact Info. 96

1.36.3          Products. 96

1.37     Reveal Imaging Technologies Inc. 99

1.37.1          Company Profile. 99

1.37.2          Contact Info. 99

1.38     Syagen Technology. 100

1.38.1          Company Profile. 100

1.38.2          Contact Info. 100

1.38.3          Products. 100

1.39     Thermo Fisher Scientific Inc. 101

1.39.1          Company Profile. 101

1.39.2          Contact Info. 102

1.39.3          Products. 102

1.40     Westminster International Ltd. 103

1.40.1          Company Profile. 103

1.40.2          Contact Info. 103

1.40.3          Products. 104

 Volume 4 – Table of Contents

Appendix A: Countries Market Background.. 21

1         U.S. Explosives & Weapons Detection Systems – Market Background.. 21

1.1        U.S. Federal Homeland Security & Public Safety Agencies. 21

1.2        Department of Homeland Security (DHS) 23

1.2.1             Department of Homeland Security: Agencies and Units. 24

1.2.2             DHS – Transportation Security Administration (TSA) 26

1.2.3             DHS – U.S. Customs & Border Protection (CBP) 28

1.2.4             DHS – Federal Emergency Management Agency (FEMA) 28

1.2.5             DHS – U.S. Immigration & Customs Enforcement (ICE) 29

1.2.6             DHS – U.S. Coast Guard (USCG) 29

1.2.7             U.S. Secret Service (USSS) 30

1.2.8             DHS – Science & Technology Directorate (S&T) 30

1.2.9             DHS – Domestic Nuclear Detection Office (DNDO) 31

1.2.10          DHS – U.S. Citizenship & Immigration Services (USCIS) 32

1.2.11          DHS – National Protection and Programs Directorate (NPPD) 33

1.3        Department of Defense (DOD) 34

1.4        Department of Justice (DOJ) 34

1.5        Federal Bureau of Investigation (FBI) 37

1.6        Department of State (DOS) 38

1.7        Department of Transportation (DOT) 39

1.8        Department of Commerce (DOC) 39

1.9        U.S. Police Forces. 40

1.10     276 Major U.S. Airports Statistics: Number of Screened Passengers & Screened Baggage by Airport – 2016 & 2019. 41

2         Canada Explosives & Weapons Detection Systems – Market Background   53

2.1        Canada Overview.. 53

2.2        Crime in Canada. 53

2.3        Terror in Canada. 54

2.4        Canada Counter Terror & Law Enforcement Legislation.. 54

2.5        Canada Homeland Security & Public Safety Agencies. 56

2.6        Canada Police Forces. 57

2.7        Canada Intelligent Services. 57

2.8        Canada Defense Forces. 58

2.9        Aviation Security. 58

2.9.1             Aviation Security Mandated Activities. 60

2.9.2             Air Cargo Screening. 61

2.9.3             Full Body Scanner (AIT) Screening. 62

2.10     20 Major Canada Airports Statistics: Number of Screened Passengers & Screened Baggage by Airport – 2016 & 2019. 62

3         Mexico Explosives & Weapons Detection Systems – Market Background.. 64

3.1        Mexico Overview.. 64

3.2        Mexico Homeland Security & Public Safety Industry. 65

3.3        Crime in Mexico. 68

3.4        Terror in Mexico. 69

3.5        Mexico Counter Terror Legislation & Law Enforcement 70

3.6        Mexico Security Policy. 70

3.7        Mexico Homeland Security & Public Safety Agencies. 72

3.8        Mexico Police Forces. 72

3.9        50 Major Mexico Airports Statistics: Number of Screened Passengers & Screened Baggage by Airport – 2016 & 2019. 74

4         Colombia Explosives & Weapons Detection Systems – Market Background   77

4.1        Colombia Overview.. 77

4.2        Colombia Homeland Security & Public Safety Industry. 78

4.3        Crime in Colombia. 79

4.4        Terror in Colombia. 80

4.5        Colombia Counter Terror Legislation & Law Enforcement 80

4.6        Colombia Police Forces. 81

4.7        Colombia Defense Forces. 81

4.8        15 Major Colombia Airports Statistics: Number of Screened Passengers & Screened Baggage by Airport – 2016 & 2019. 82

5         Brazil Explosives & Weapons Detection Systems – Market Background.. 83

5.1        Brazil Overview.. 83

5.2        Brazil Homeland Security & Public Safety Industry. 85

5.3        Crime in Brazil 86

5.4        Terror in Brazil 87

5.5        Brazil Counter Terror Legislation & Law Enforcement 87

5.6        Brazil Homeland Security & Public Safety Agencies. 88

5.7        Brazil Police Forces. 88

5.8        Brazil Defense Forces. 89

5.9        41 Major Brazil Airports Statistics: Number of Screened Passengers & Screened Baggage by Airport – 2016 & 2019. 89

6         Argentina Explosives & Weapons Detection Systems – Market Background   92

6.1        Argentina Overview.. 92

6.2        Crime in Argentina. 92

6.3        Terror in Argentina. 93

6.4        Argentina Counter Terror Legislation & Law Enforcement 93

6.5        Argentina Police Forces. 94

6.6        Argentina Defense Market 94

6.7        2 Major Argentina Airports Statistics: Number of Screened Passengers & Screened Baggage by Airport – 2016 & 2019. 97

7         UK Explosives & Weapons Detection Systems – Market Background.. 98

7.1        Facts & Figures. 98

7.2        UK Overview.. 98

7.3        Brexit Effects on the Homeland Security & Public Safety Market 99

7.4        UK Homeland Security & Public Safety: Market Background. 101

7.4.1             UK National Security Risk Assessment 2016. 104

7.5        Crime in the UK.. 106

7.6        Terror in the UK.. 106

7.6.1             The New Realities of Terror 107

7.6.2             United Kingdom Counter Terror Strategy. 110

7.6.3             Countering International Terrorism.. 111

7.6.4             Countering Terrorism Financing. 111

7.7        UK Homeland Security and Public Safety Strategy. 112

7.8        UK Counter Terror & Law Enforcement Legislation.. 113

7.8.1             Counter Terror Policy Transformation.. 114

7.8.2             UK Public Safety Challenges. 115

7.9        UK Homeland Security & Public Safety Agencies. 116

7.10     UK Police Forces. 117

7.10.1          Background. 117

7.10.2          UK Police Forces Statistics. 119

7.11     UK Intelligent Services. 120

7.11.1          UK Intelligence Agencies Funding. 120

7.11.2          Security Service – MI5. 120

7.11.3          National Domestic Extremism & Disorder Intelligence Unit (NDEDIU) 121

7.11.4          National Crime Agency (NCA) 121

7.11.5          National Ballistics Intelligence Service (NBIS) 121

7.11.6          National Fraud Intelligence Bureau (NFIB) 121

7.11.7          MI6, Secret Intelligence Service. 121

7.11.8          Defense Intelligence (DI) 122

7.11.9          Communications Headquarters (GCHQ) 122

7.11.10       Joint Intelligence Organization.. 123

7.11.11       Parliament Intelligence and Security Committee. 123

7.11.12       UK Intelligence Agencies Budgets. 124

7.12     UK Defense Forces. 125

7.13     38 Major UK Airports Statistics: Number of Screened Passengers & Screened Baggage by Airport – 2016 & 2019. 125

7.14     UK Airport security. 127


8         France Explosives & Weapons Detection Systems – Market Background.. 132

8.1        Terror in France. 132

8.1.1             The New Realities of Terror 132

8.1.2             Terror Attacks and Terror Threats. 136

8.1.3             Counter Terror Policy Transformation.. 137

8.1.4             Threat Levels. 138

8.2        France Homeland Security & Public Safety Agencies. 139

8.3        France Police Forces. 139

8.3.1             The National Police. 140

8.3.2             Research, Assistance, Intervention, Deterrence (RAID) 140

8.3.3             National Police Intervention Groups (GIPN) 141

8.3.4             The National Gendarmerie. 141

8.3.5             National Gendarmerie Intervention Group. 141

8.3.6             Paris Police Prefecture. 142

8.3.7             Police Forces Statistics. 142

8.4        France Intelligent Services. 143

8.4.1             Domestic Counter-terrorism & Counter-espionage Intelligence (DGSI) 143

8.4.2             Central Directorate of the Judicial Police (DCPJ) 144

8.4.3             General Directorate for External Security (DGSE) 144

8.4.4             Directorate of Protection and Defense Security (DPSD) 144

8.4.5             Directorate of Military Intelligence (DRM) 145

8.4.6             Anti-Terrorist Bureau (BLAT) 145

8.4.7             Inter-Departmental Coordination on Terrorism Matters. 145

8.5        France Defense Forces. 146

8.6        France Safe City Projects. 147

8.7        France Airport security. 148

8.8        57 Major France Airports Statistics: Number of Screened Passengers & Screened Baggage by Airport – 2016 & 2019. 151

8.9        France Border Security. 153

8.10     Migration to France. 155

9         Netherlands Explosives & Weapons Detection Systems – Market Background   157

9.1        Netherlands Overview.. 157

9.2        Netherlands Homeland Security & Public Safety Industry. 157

9.3        Crime in the Netherlands. 158

9.4        Terror in the Netherlands. 158

9.5        Netherlands Counter Terror Legislation & Law Enforcement 159

9.6        Netherlands Homeland Security & Public Safety Agencies. 160

9.7        Netherlands Police Forces. 160

10      Belgium Explosives & Weapons Detection Systems – Market Background   161

10.1     Belgium Overview.. 161

10.2     Belgium Homeland Security & Public Safety Industry. 161

10.3     Crime in Belgium.. 163

10.4     Terror in Belgium.. 163

10.4.1          Overview.. 163

10.4.2          Terror Attack Statistics. 170

10.5     Belgium Counter Terror Legislation & Law Enforcement 173

10.6     Belgium Homeland Security & Public Safety Agencies. 177

10.7     Belgium Police Forces. 177

10.7.1          Belgium Federal Police. 178

10.7.2          Belgium Local Police Forces. 179

10.8     Belgium Intelligence Services. 179

10.8.1          Overview.. 179

10.8.2          State Security Service. 180

10.8.3          General Information and Security Service. 180

10.9     Migration to Belgium.. 180

10.9.1          Belgium Immigration Data. 181

11      Sweden Explosives & Weapons Detection Systems – Market Background   183

11.1     Sweden Overview.. 183

11.2     Sweden Homeland Security & Public Safety Industry. 183

11.3     Crime in Sweden.. 183

11.4     Terror in Sweden.. 184

11.5     Sweden Counter Terror Legislation & Law Enforcement 184

11.6     Sweden Homeland Security & Public Safety Agencies. 185

11.7     Sweden Police Forces. 186

11.8     24 Major Sweden Airports Statistics: Number of Screened Passengers & Screened Baggage by Airport – 2016 & 2019. 187

12      Denmark Explosives & Weapons Detection Systems – Market Background   188

12.1     Denmark Overview.. 188

12.2     Denmark Homeland Security & Public Safety Industry. 188

12.3     Crime in Denmark. 189

12.4     Terror in Denmark. 189

12.5     Denmark Counter Terror Legislation & Law Enforcement 190

12.6     Denmark Police Forces. 191

12.7     7 Major Denmark Airports Statistics: Number of Screened Passengers & Screened Baggage by Airport – 2016 & 2019. 192

13      Germany Explosives & Weapons Detection Systems – Market Background   193

13.1     Germany Overview.. 193

13.2     Germany Homeland Security & Public-Safety Industry. 193

13.3     Crime in Germany. 199

13.4     Terror in Germany. 199

13.5     Germany Counter Terror Legislation & Law Enforcement 200

13.6     Germany Terror Challenge & Counter Terror Strategy. 202

13.7     The New Realities of Terror 202

13.7.1          Germany Approach to Homeland Security and Public Safety. 209

13.7.2          Germany Migration Surge. 209

13.7.3          German Asylum and Refugee Status. 212

13.8     Germany Homeland Security & Public Safety Agencies. 213

13.9     German Police Forces. 213

13.9.1          BPOL – Federal Police. 213

13.9.2          GSG 9 – Special Operations & Counterterrorism Unit 214

13.9.3          BFE/BFHu Units – Special Anti-Terrorist Unit of Federal Anti-Riot Police  214

13.9.4          ASSIK – Special Task Force Protection in Crisis Areas. 215

13.9.5          ZKA – Customs Investigation Bureau.. 215

13.9.6          ZUZ – Customs SWAT Unit 215

13.9.7          Military Police. 216

13.9.8          State Police Forces. 216

13.9.9          SEK – State Special Operations Command Part of Uniformed Police  216

13.9.10       MEK – Mobile Task Force Units, Part of Criminal Police. 217

13.10  Germany Intelligent Services. 217

13.10.1       Federal Intelligence Service (BND) 217

13.10.2       Federal Office for the Protection of the Constitution (BfV) 218

13.10.3       Military Counterintelligence Service (MAD) 218

13.10.4       The State Office for the Protection of the Constitution. 219

13.11  Defense Forces. 219

13.12  Germany Airport Security. 219

13.13  26 Major German Airports Statistics: Number of Screened Passengers & Screened Baggage by Airport – 2016 & 2019. 221

14      Austria Explosives & Weapons Detection Systems – Market Background   223

14.1     Austria Homeland Security & Public Safety Industry. 223

14.2     Crime in Austria. 223

14.3     Terror in Austria. 223

14.4     Austria Counter Terror Legislation & Law Enforcement 224

14.5     Austria Homeland Security & Public Safety Agencies. 224

14.6     Austria Police Forces. 225

15      Italy Explosives & Weapons Detection Systems – Market Background.. 226

15.1     Italy Overview.. 226

15.2     Italy Homeland Security & Public Safety Industry. 226

15.3     Crime in Italy. 229

15.4     Terror in Italy. 229

15.5     Italy Counter Terror Legislation & Law Enforcement 230

15.6     Italy Homeland Security & Public Safety Agencies. 231

15.7     Italy Police Forces. 232

15.8     Italy Airport Security. 233

15.9     31 Major Italy Airports Statistics: Number of Screened Passengers & Screened Baggage by Airport – 2016 & 2019. 234

16      Spain Explosives & Weapons Detection Systems – Market Background.. 236

16.1     Counter Terror Legislation & Law Enforcement 236

16.2     Spain Homeland Security & Public Safety Agencies. 237

16.3     Spain Police Forces. 237

16.3.1          Spain National Police. 238

16.3.2          Spain Civil Guard. 239

16.4     Spain Airport security. 240

16.5     30 Major Spain Airports Statistics: Number of Screened Passengers & Screened Baggage by Airport – 2016 & 2019. 241

17      Poland Explosives & Weapons Detection Systems – Market Background.. 243

17.1     Poland Police Forces. 243

17.2     11 Major Poland Airports Statistics: Number of Screened Passengers & Screened Baggage by Airport – 2016 & 2019. 244

18      Czech Republic Explosives & Weapons Detection Systems – Market Background.. 245

18.1     Czech Republic Overview.. 245

18.2     Czech Republic Homeland Security & Public Safety Industry. 245

18.3     Crime in the Czech Republic. 245

18.4     Czech Republic Police Forces. 246

19      Russia Explosives & Weapons Detection Systems – Market Background.. 247

19.1     Russia Market Overview.. 247

19.2     Russia Homeland Security & Public Safety Industry. 248

19.3     Crime in Russia. 248

19.4     Terror in Russia. 249

19.5     Russia Counter Terror Legislation & Law Enforcement 250

19.6     Russia Homeland Security & Public Safety Agencies. 251

19.7     Russia Airport security. 252

19.7.1          Aviation Industry. 252

19.7.2          Aviation Security: New Measures. 252

19.8     58 Major Russia Airports Statistics: Number of Screened Passengers & Screened Baggage by Airport – 2016 & 2019. 253

20      Turkey Explosives & Weapons Detection Systems – Market Background.. 256

20.1     Facts & Figures. 256

20.2     Turkey Overview.. 256

20.3     Turkey Homeland Security & Public Safety Market 258

20.4     Crime in Turkey. 260

20.5     Terror in Turkey. 260

20.6     Turkey Counter Terror Legislation & Law Enforcement 262

20.7     Turkey Homeland Security & Public Safety Agencies. 263

20.8     Turkey Police Forces. 263

20.9     Turkey Defense Forces. 264

20.10  Turkey Airport security. 265

20.11  43 Major Turkey Airports Statistics: Number of Screened Passengers & Screened Baggage by Airport – 2016 & 2019. 266

21      Israel Explosives & Weapons Detection Systems – Market Background.. 268

21.1     Facts & Figures. 268

21.2     Israel Overview.. 268

21.3     Israel Homeland Security & Public Safety Market 270

21.4     Crime in Israel 272

21.5     Terror in Israel 273

21.6     Counter Terror Legislation & Law Enforcement 275

21.7     Israel Homeland Security & Public Safety Agencies. 276

21.8     Israel Police Forces. 277

21.9     Israel Defense Forces. 277

21.10  Israel Airport Security. 278

21.11  2 Major Israel Airports Statistics: Number of Screened Passengers & Screened Baggage by Airport – 2016 & 2019. 279

22      Saudi Arabia Explosives & Weapons Detection Systems – Market Background   280

22.1     Facts & Figures. 280

22.2     Saudi Arabia Overview.. 280

22.3     Saudi Arabia Homeland Security & Public Safety Market 283

22.4     Crime in Saudi Arabia. 284

22.5     Terror in Saudi Arabia. 284

22.6     Saudi Arabia Counter Terror Legislation & Law Enforcement 285

22.7     Saudi Arabia Homeland Security & Public Safety Agencies. 286

22.7.1          Ministry of Interior 290

22.7.2          Saudi National Guard. 290

22.7.3          Paramilitary Security Forces. 291

22.8     Saudi Arabia Police Forces. 291

22.9     Saudi Arabia Defense Forces. 292

22.9.1          Armed Services. 293

22.9.2          Independent Forces. 294

22.10  5 Major Saudi Arabia Airports Statistics: Number of Screened Passengers & Screened Baggage by Airport – 2016 & 2019. 294


23      Iraq Explosives & Weapons Detection Systems –  Market Background.. 295

23.1     Facts & Figures. 295

23.2     Iraq Overview.. 295

23.3     Iraq Homeland Security & Public Safety Market 296

23.4     Crime in Iraq. 298

23.5     Terror in Iraq. 298

23.6     Iraq Counter Terror Legislation & Law Enforcement 300

23.7     Counter Terror Market 300

23.8     Iraq Homeland Security & Public Safety Agencies. 301

23.9     Iraq Police Forces. 301

23.10  Iraq Defense Forces. 302

23.10.1       Iraq Army. 302

23.10.2       Iraq Air Force. 303

23.10.3       Iraq Navy. 303

23.11  Iraq Defense Forces Market 2017-2022. 303

23.11.1       Intelligence Surveillance and Reconnaissance (ISR) 304

23.11.2       Army Modernization.. 304

23.11.3       Army Aviation Upgrades. 305

23.11.4       Air Force Modernization.. 305

23.11.5       Naval Capabilities Upgrade. 306

23.11.6       Air Defense Command. 306

24      UAE Explosives & Weapons Detection Systems – Market Background.. 308

24.1     Facts & Figures. 308

24.2     UAE Overview.. 308

24.3     UAE Homeland Security & Public Safety Market 309

24.4     Crime in the UAE.. 314

24.5     Terror in the UAE.. 315

24.6     UAE Counter Terror Legislation & Law Enforcement 315

24.7     UAE Homeland Security & Public Safety Agencies. 317

24.8     UAE Police Forces. 317

24.9     UAE Defense Forces. 320

24.10  3 Major UAE Airports Statistics: Number of Screened Passengers & Screened Baggage by Airport – 2016 & 2019. 320

25      Qatar Explosives & Weapons Detection Systems – Market Background.. 321

25.1     Facts & Figures. 321

25.2     Qatar Overview.. 321

25.3     Qatar Homeland Security & Public Safety Market 322

25.4     Crime in Qatar 326

25.5     Terror in Qatar 327

25.6     Qatar Counter Terror Legislation & Law Enforcement 328

25.7     Qatar Police Forces. 329

25.8     Defense Forces. 330

26      Kuwait Explosives & Weapons Detection Systems – Market Background.. 332

26.1     Facts & Figures. 332

26.2     Kuwait Overview.. 332

26.3     Kuwait Homeland Security & Public Safety Market 334

26.4     Crime in Kuwait 334

26.5     Terror in Kuwait 335

26.6     Kuwait Counter Terror Legislation & Law Enforcement 335

26.7     Kuwait Homeland Security & Public Safety Agencies. 336

26.8     Kuwait Police Forces. 336

26.9     Kuwait Defense Forces. 337

26.10  Kuwait Airport Statistics: Number of Screened Passengers & Screened Baggage by Airport – 2016 & 2019. 338

27      Nigeria Explosives & Weapons Detection Systems – Market Background.. 339

27.1     Facts & Figures. 339

27.2     Nigeria Overview.. 339

27.3     Nigeria Homeland Security & Public Safety Market 340

27.4     Crime in Nigeria. 341

27.5     Terror in Nigeria. 341

27.6     Nigeria Counter Terror Legislation & Law Enforcement 343

27.7     Nigeria Homeland Security & Public Safety Agencies. 344

27.8     Nigeria Police Forces. 345

27.8.1          Nigeria Police Force (NPF) 345

27.8.2          Other Security-Related Departments. 346

27.9     Nigeria Defense Forces. 347

27.10  12 Major Nigeria Airports Statistics: Number of Screened Passengers & Screened Baggage by Airport – 2016 & 2019. 348

28      South Africa Explosives & Weapons Detection Systems – Market Background   349

28.1     Facts & Figures. 349

28.2     South Africa Overview.. 349

28.3     Crime in South Africa. 351

28.4     Terror in South Africa. 352

28.5     South Africa Counter Terror Legislation & Law Enforcement 353

28.6     South Africa Police Forces. 353

28.7     South African Defense Forces. 354

28.8     9 Major South Africa Airports Statistics: Number of Screened Passengers & Screened Baggage by Airport – 2016 & 2019. 355

29      India Explosives & Weapons Detection Systems – Market Background.. 356

29.1     Facts & Figures. 356

29.2     India Overview.. 356


29.3     India Homeland Security & Public Safety Market 357

29.4     Crime in India. 359

29.4.1          Crime in New Delhi 359

29.4.2          Crime in Mumbai 359

29.4.3          Crime in Hyderabad. 360

29.5     Terror in India. 360

29.6     India Counter Terror Legislation & Law Enforcement 361

29.7     India Homeland Security & Public Safety Agencies. 362

29.8     India Police Forces. 363

29.9     India Defense Market 364

29.10  India Defense Forces. 367

29.11  46 Major India Airports Statistics: Number of Screened Passengers & Screened Baggage by Airport – 2016 & 2019. 368

30      China Explosives & Weapons Detection Systems – Market Background.. 370

30.1     Facts & Figures. 370

30.2     China Overview.. 370

30.3     China Security Threat Assessment 372

30.4     China Security Industry. 373

30.5     China Homeland Security & Public Safety Market 376

30.6     Crime in China. 376

30.7     Terror in China. 378

30.8     China Homeland Security & Public Safety Agencies. 379

30.9     China Police Forces. 380

30.10  China Ministry of Public Security. 380

30.11  Public Security Bureau.. 381

30.12  China Ministry of State Security. 381

30.13  China Defense Forces. 382

30.14  100 Major China Airports Statistics: Number of Screened Passengers & Screened Baggage by Airport – 2016 & 2019. 387

31      South Korea Explosives & Weapons Detection Systems – Market Background   391

31.1     Facts & Figures. 391

31.2     South Korea Overview.. 391

31.3     South Korea Homeland Security & Public Safety Market 393

31.4     Crime in South Korea. 395

31.5     Terror in South Korea. 395

31.6     South Korea Homeland Security & Public Safety Agencies. 396

31.7     South Korea Police Forces. 397

31.8     South Korea Defense Forces. 397

31.9     13 Major South Korea Airports Statistics: Number of Screened Passengers & Screened Baggage by Airport – 2016 & 2019. 398


32      Japan Explosives & Weapons Detection Systems – Market Background.. 399

32.1     Facts & Figures. 399

32.2     Japan Overview.. 399

32.3     Japan Homeland Security & Public Safety Market 401

32.4     Crime in Japan.. 402

32.5     Terror in Japan.. 402

32.6     Japan Homeland Security & Public Safety Agencies. 403

32.7     Japan Police Forces. 404

32.8     Japan Defense Forces. 404

32.9     Japan Airports Statistics: Number of Screened Passengers & Screened Baggage by Airport – 2016 & 2019. 405

33      Australia Explosives & Weapons Detection Systems – Market Background   407

33.1     Facts & Figures. 407

33.2     Australia Overview.. 407

33.3     External Security. 407

33.4     Crime in Australia. 408

33.5     Terror in Australia. 408

33.6     Australia Counter Terror Legislation & Law Enforcement 409

33.7     Australia Homeland Security & Public Safety Agencies. 410

33.8     Australia Police Forces. 412

33.9     Australia Intelligence Services. 412

33.10  20 Major Australia Airports Statistics: Number of Screened Passengers & Screened Baggage by Airport – 2016 & 2019. 413

34      Azerbaijan Explosives & Weapons Detection Systems – Market Background   414

34.1     Facts & Figures. 414

34.2     Azerbaijan Overview.. 414

34.3     Azerbaijan Homeland Security & Public Safety Market 415

34.4     Crime in Azerbaijan.. 415

34.5     Terror in Azerbaijan.. 416

34.6     Azerbaijan Counter Terror Legislation & Law Enforcement 416

34.7     Azerbaijan Police Forces. 417

35      Kazakhstan Explosives & Weapons Detection Systems – Market Background   419

35.1     Facts & Figures. 419

35.2     Kazakhstan Overview.. 419

35.3     Crime in Kazakhstan.. 420

35.4     Terror in Kazakhstan.. 421

35.5     Kazakhstan Counter Terror Legislation & Law Enforcement 421

35.6     Kazakhstan Police Forces. 421


36      Pakistan Explosives & Weapons Detection Systems – Market Background   422

36.1     Facts & Figures. 422

36.2     Pakistan Overview.. 422

36.3     Crime in Pakistan.. 422

36.4     Terror in Pakistan.. 422

36.5     Pakistan Counter Terror Legislation & Law Enforcement 424

36.6     Pakistan Homeland Security & Public Safety Agencies. 424

36.7     Pakistan Police Forces. 425

36.8     Pakistan Defense Forces. 427

37      Taiwan Explosives & Weapons Detection Systems – Market Background.. 428

37.1     Facts & Figures. 428

37.2     Taiwan Overview.. 428

37.3     Taiwan Homeland Security & Public Safety Market 428

37.4     Crime and Terror in Taiwan.. 429

37.5     Taiwan Homeland Security & Public Safety Agencies. 429

37.6     Taiwan Police Forces. 430

37.7     Taiwan Defense Forces. 430

38      Singapore Explosives & Weapons Detection Systems – Market Background   431

38.1     Facts & Figures. 431

38.2     Singapore Overview.. 431

38.3     Singapore Homeland Security & Public Safety Market 431

38.4     Terror in Singapore. 432

38.5     Singapore Homeland Security & Public Safety Agencies. 433

38.6     Singapore Police Forces. 433

38.7     Singapore Defense Forces. 434

38.8     Singapore Statistics: Number of Screened Passengers & Screened Baggage – 2016 & 2019. 434

39      Malaysia Explosives & Weapons Detection Systems – Market Background   436

39.1     Facts & Figures. 436

39.2     Malaysia Overview.. 436

39.3     Malaysia Homeland Security & Public Safety Market 437

39.4     Crime in Malaysia. 437

39.5     Terror in Malaysia. 439

39.6     Malaysia Police. 439

39.7     Malaysia Defense Forces. 439

39.8     18 Major Malaysia Airports Statistics: Number of Screened Passengers & Screened Baggage by Airport – 2016 & 2019. 442


40      Indonesia Explosives & Weapons Detection Systems – Market Background   443

40.1     Facts & Figures. 443

40.2     Indonesia Overview.. 443

40.3     Indonesia Homeland Security & Public Safety Market 443

40.4     Crime in Indonesia. 445

40.5     Terror & Civil Unrest in Indonesia. 446

40.6     Indonesia Homeland Security & Public Safety Agencies. 448

40.7     Indonesia Police Forces. 449

40.8     Indonesia Defense Forces. 449

40.9     The Defense Market 450

40.10  30 Major Indonesia Airports Statistics: Number of Screened Passengers & Screened Baggage by Airport – 2016 & 2019. 451

Volume 5 – Table of Contents

1         Appendix B: Improvised Explosives & Military Grade Explosives. 14

1.1        Background. 14

1.2        Explosives Categories. 14

1.2.1             Chemical Explosives. 14

1.2.2             Explosives Train Materials. 16

1.2.3             Low Explosives. 16

1.2.4             Nitrocellulose. 17

1.2.5             High Explosives. 18

1.2.6             Primary High Explosives. 19

1.3        Secondary High Explosives. 21

1.3.1             PETN.. 21

1.3.2             RDX.. 22

1.3.3             Main Charges. 22

1.4        Improvised Explosives. 26

1.4.1             Introduction.. 26

1.4.2             Hexamethylene Triperoxide Diamine (HMTD) 27

1.4.3             Triacetone Triperoxide (TATP) 27

2         Appendix C: X-Ray Baggage, Cargo, People, Container & Vehicle Explosives & Weapons Screening Technologies. 28

2.1        Explosive Materials Classification.. 28

2.2        Security Screening Technologies. 30

2.2.1             Major Technologies. 30

2.2.2             2D X-ray, EDS and ETD Technologies – Pros and Cons. 32

2.2.3             Bulk Screening Technologies: Price Comparison.. 32

2.3        X-ray Explosives & Weapons Screening  Technologies: Background. 33

2.3.1             X-ray Systems – Characteristics. 33

2.3.2             X-ray Explosives & Weapons Screening Systems – Principles of Operation   34

2.3.3             Innocuous Materials Interference. 35

2.3.4             Threat Image Projection (TIP) 36

2.3.5             Automated Target Detection.. 36

2.4        X-ray Security Systems by Technology. 37

2.4.1             Overview.. 37

2.4.2             Conventional 2D X-ray. 37

2.4.3             Dual Energy X-ray. 38

2.4.4             Quasi Dual Energy X-ray. 41

2.4.5             Variable View X-ray. 42

2.4.6             Quasi 3-D Dual View Dual-Energy X-ray Imaging. 43

2.4.7             The Advanced Technology (AT) X-ray Systems. 44

2.4.8             Backscatter Screening X-ray. 46

2.4.9             X-ray and MMwawe People Screening AIT. 47

2.4.10          Backscatter AIT Sample System.. 50

2.4.11          Coherent Scatter 2D X-ray. 51

2.5        Cast and Artificial Limbs X-ray Backscatter Screening Technologies. 52

2.6        Transportable X-Ray Screening Checkpoints. 53

2.7        X-ray Technologies: Performance Comparison.. 53

2.8        Product Certification.. 54

2.9        National Standards. 55

3         Appendix D – Global Security Concerns. 57

3.1        Introduction.. 57

3.2        Global Risks: A Regional Perceptive. 58

4         Appendix E: Standoff IED Detection Technologies. 62

4.1        Comparison of Standoff IED Detection Technologies. 62

4.2        Standoff Walk-by & Pass-through Threat Detection Corridors Technologies  64

4.2.1             Walk-through Corridors: Active Electromagnetic Weapons Detection Present & Pipeline Technologies. 64

4.2.2             Passive Electro Magnetic Signature Corridor 65

4.2.3             Standoff Passive MMWave Doorways. 65

4.2.4             Focal Plane Array Passive MMWave. 66

4.2.5             Walk-through Corridors: Fourier Transform Infrared (FTIR) Spectroscopy Systems. 69

4.2.6             Covert Walk-through Biometric Identification Corridors. 70

4.2.7             Fused Standoff PBIED Detection &Video-based Biometrics. 72

4.2.8             Walk-by Active Centimeter Range (Ku band) Microwave System.. 73

4.3        Open Space Standoff Explosives & Weapon Detection Technologies. 76

4.3.1             Introduction.. 76

4.3.2             Open Space Standoff Explosives & Weapon Detection Technologies Challenges. 77

4.3.3             Bi-Modal Standoff IED, PBIED & VBIED Explosives & Weapon Detection Systems. 78

4.3.4             Sample: Standoff Fused MMWave & Infrared System.. 78

4.4        Standoff Vehicle-Borne Explosives Detection: Technologies. 79

4.4.1             Overview.. 79

4.4.2             VBIED Detection: Challenges. 79

4.4.3             Example: Raman Spectroscopy Based Vehicle Standoff Detector – P. Eye  82

4.5        Standoff IED UGV Based Detection Technologies. 82

4.5.1             UGV Expectation Management 82

4.5.2             UGV Requirements Management 83

4.5.3             UGV Mobility. 84

4.5.4             UGV Function.. 84

4.5.5             The Human Operator 84

4.5.6             Future IED, PBIED & VBIED Detection UGV.. 85

4.5.7             Cobham Antenna Systems Standoff IED, PVIED & VBIED UGV IED Detection Technology. 86

4.5.8             Israel Aerospace Industries CIMS System.. 87

4.5.9             Rafael – EZ-K9e Stand-off MMWave IED Detection System.. 90

4.6        Multi-Modal Fused IED, PBIED and VBIED Detection Technologies. 91

4.6.1             Technology Review.. 91

4.6.2             Example: The CounterBomber® System.. 93

4.7        Standoff IED Detection Pipeline Technologies. 94

4.7.1             Introduction.. 94

4.8        Standoff Active MMWave PBIED, VBIED & IED Detection.. 97

4.8.1             Principle of Operation.. 97

4.8.2             Active Standoff MMWave Imaging Systems. 98

4.8.3             Disadvantages of Standoff Active MMWave Technology. 100

4.8.4             Standoff Passive MMWave Imaging. 101

4.8.5             Principle of Operation.. 101

4.8.6             Advantages of a Passive Millimeter Wave (PMMW) System: 104

4.8.7             TREX Enterprises Standoff Passive MMWave Technology. 105

4.8.8             GEN2 Standoff Passive MMWave PBIED Detection Technology  106

4.8.9             Standoff “Illuminators of Opportunity” Passive MMWave Imaging  106

4.8.10          Mechanically Scanning Standoff MMWave PBIED, VBIED & IED Detection.. 107

4.8.11          Standoff MMWave PBIED Gait Characteristics Detection.. 108

4.8.12          Infra-red Standoff Detection Technologies. 109

4.8.13          Standoff Terahertz Explosives & Weapons Detection Technologies  110

4.8.14          Standoff Terahertz Contraband Detection Technology. 111

4.8.15          Terahertz Detection Advantages over Other Technologies. 112

4.8.16          Standoff Active Terahertz Heterodyne Concealed Explosives & Weapons Standoff Detection Imagers. 113

4.8.17          Standoff Active Terahertz Absorption Spectroscopy Using Principal Component Analysis. 114

4.8.18          Example: Active Terahertz Standoff Explosives Detection System of TeraView.. 118

4.8.19          Passive Terahertz Standoff Weapons & Explosives Detection.. 118

4.8.20          Passive Terahertz Detection System: ThruVision Systems. 120

4.9        Laser-Based Standoff Explosives Detection.. 121

4.9.1             Introduction.. 121

4.9.2             Standoff Laser-induced Breakdown Spectroscopy (LIBS) 124

4.9.3             Next Generation Standoff LIBS Systems. 126

4.9.4             Laser-Based Molecular Signatures Technologies. 127

4.9.5             Laser-Based Stimulated Raman Adiabatic Passage (STIRAP) Technologies. 128

4.9.6             External Cavity Quantum Cascade Lasers Standoff IED Detection   128

4.9.7             Standoff Laser Induced Fluorescence (PLP/LIF) Technology. 131

4.10     Standoff Raman Spectroscopy. 132

4.10.1          Introduction.. 132

4.10.2          Standoff Coherent Anti-Stokes Raman Spectroscopy. 135

4.10.3          Standoff Resonant Raman Spectroscopy. 135

4.10.4          Next-Generation Standoff CARS Systems. 136

4.11     Standoff Non-linear Wave Mixing Detection Technology. 137

4.11.1          Principle of Operation.. 137

4.11.2          Next-Generation Standoff Non-linear Wave Mixing PBIED, VBIED & IED Detection Technology. 137

4.12     Standoff Light Detection and Ranging (LIDAR) Explosives Detection.. 137

4.12.1          Overview.. 137

4.12.2          Next-Generation LIDAR Systems. 138

4.13     Triple Modality Standoff Detection Technology. 139

4.14     Differential Phase-Contrast X-ray Imaging. 139

4.15     The University of Puerto Rico Advanced Detection Techniques R&D.. 140

4.16     Rydberg Spectroscopy/Microwave Scattering Based Detection.. 140

5         Appendix F: TSA Apex Checkpoint of the Future. 142

6         Appendix G: Business & Technological Opportunities and Challenges. 143

6.1        Introduction.. 143

6.2        Tele-Interpretation.. 144

6.3        Medium Capacity Multi-Threat Screening Systems. 146

6.4        Upgraded Multi Threat Screening System.. 146

6.5        Third Party Service Business. 146

7         Appendix H: The Explosives & Weapons Detection Products Industry. 147

7.1        The Globalization of the Explosives & Weapons Detection  Systems Business  147

7.2        Classification of the Industry Business and Industrial Activities. 147

7.3        Forces that Shape the Explosives & Weapons Detection  Systems Industry & Markets. 148

7.4        Barriers to Market Entry. 150

7.5        Explosives & Weapons Detection Supply-Side & Demand-Side Analysis  151

8         Appendix I: Explosives & Weapons Detection Systems Industry: Business Models & Strategies. 154

8.1        Variable Funding Conditions. 154

8.2        Explosives & Weapons Detection Products: Market Tiers. 154

8.3        Inroads into the Market 154

8.4        Entry Strategies toward the Explosives & Weapons Detection Security Screening Systems Market 155

8.5        Price Competition.. 156

9         Appendix J: Cargo Facility Regulations. 158

9.1        Introduction to Cargo Security. 158

9.2        Airport – Cargo Processing Facilities. 158

9.3        Operational Considerations. 158

9.4        Access Control Considerations. 159

9.5        Information and Requirement Resources. 160

10      Appendix K: Air Cargo Approved Explosives & Weapons Screening Systems (ACSTL) 162

10.1     Certified Air Cargo Screening Product Manufacturers Contact Information   163

10.2     Qualified Technology. 163

10.3     Certified Explosives & Weapons Detection Products. 164

10.4     Certified 2D X-ray Devices. 166

11      Appendix L: Authorized Air-Cargo Screening Facilities Roster. 167

12      Appendix M: IATA, Boeing, Airbus & ICAO Air Travel and Air Cargo Forecast to 2034. 191

13      Appendix N: IATA Airport Screening Checkpoints Recommended.. 193

14      Appendix O: Israel Ben Gurion Airport Security Procedures. 198

15      Appendix P: Explosives & Weapons Detection Related Product Standards  199

16      Appendix Q: International X-ray Explosives & Weapons Detection Systems Related Legislation.. 223

16.1     ICAO.. 223

16.2     IATA.. 223

16.3     U.S. Legislation.. 225

17      Appendix R: Security & Screening Related Big Data Technologies. 226

17.1     Big Data Technology Background. 226

17.2     Big Data Collection and Analysis Process. 226

17.3     Data Sources Collection and Recording. 227

17.3.1          Digital and Analog Data Production.. 228

17.4     Machine Learning. 228

17.4.1          Machine Learning Methods. 229

17.4.2          Deep Machine Learning. 230

17.4.3          Application Types. 230

17.5     Data Exploration Vs. Machine Learning Model 231

17.6     Legacy Analytics Vs. Big Data Analytics. 231

17.7     Storage & Communications Equipment 231

17.8     Data Warehouses & Data Management 232

17.9     SQL (Structured) and NoSQL (Un-Structured) Database Software. 232

17.9.1          SQL (Structured) Database Software. 233

17.9.2          NoSQL (Un-Structured) Database Software. 233

17.10  Data Analytics & Visualization Applications. 233

17.10.1       Data Analytics. 233

17.10.2       Visualization and Presentation.. 234

17.11  Compute Engine. 235

17.12  Professional Services. 235

17.13  Mission Critical Applications. 236

17.13.1       Mission Critical Applications. 236

17.14  Government Intelligence Agencies. 237

17.14.1       Use Cases. 237

18      Appendix S: Glossary & Abbreviations. 239

19      Type of Data Sources. 259

19.1     Passive Data Sources. 259

19.2     Active Data Sources. 259

20      Data Sources. 260

20.1     Communications (including GPS) 260

20.1.1          GPS Sources. 260

20.1.2          Application Types. 260

21      Disclaimer & Copyright 261


Tables

Volume 1 – Volume 5 – Explosives & Weapons Detection Systems – List of Tables

Volume 1 – List of Tables

Table 1 – Global Air Passengers & Cargo Traffic on International & Domestic Scheduled Flights – 2016–2018. 27

Table 2 – Global Explosives & Weapons Detection Systems Market Size [$M] by Vertical Market – 2016-2025. 34

Table 3 – Global Explosives & Weapons Detection Systems Market Size [$M] by Technology – 2016-2025. 36

Table 4 – Global Explosives & Weapons Detection Systems Market Size [$M] by Region – 2016-2025. 37

Table 5 – Explosives & Weapons Detection Market: Business Opportunities. 42

Table 6 – Global Explosives & Weapons Detection Systems Market Size [$M] Vertical Markets – 2016-2025. 48

Table 7 – Global Explosives & Weapons Detection Systems Market AGR [%] by Vertical Market – 2016-2025. 49

Table 8 – Global Explosives & Weapons Detection Systems Market Share [%] by Vertical Market – 2016-2025. 50

Table 9 – Global Air Passengers & Cargo Traffic on International & Domestic Scheduled Flights – 2016–2018. 57

Table 10 – Global Explosives & Weapons Detection Systems Aviation Security Market Size [$M] by Region – 2016-2025. 62

Table 11 – Global Explosives & Weapons Detection Systems Aviation Security Market AGR [%] by Region – 2016-2025. 63

Table 12 – Global Explosives & Weapons Detection Systems Aviation Security Market Share [%] by Region – 2016-2025. 64

Table 13 – Global Explosives & Weapons Detection Maritime Security Market Size [$M] by Region – 2016-2025. 68

Table 14 – Global Explosives & Weapons Detection Maritime Security Market AGR [%] by Region – 2016-2025. 69

Table 15 – Global Explosives & Weapons Detection Maritime Security Market Share [%] by Region – 2016-2025. 69

Table 16 – Global Explosives & Weapons Detection Land Transportation Security Market Size [$M] by Region – 2016-2025. 74

Table 17 – Global Explosives & Weapons Detection Land Transportation Security Market AGR [%] by Region – 2016-2025. 75

Table 18 – Global Explosives & Weapons Detection Land Transportation Security Market Share [%] by Region – 2016-2025. 76

Table 19 – Global Explosives & Weapons Detection Secured Perimeters & Buildings Market Size [$M] by Region – 2016-2025. 79

Table 20 – Global Explosives & Weapons Detection Secured Perimeters & Buildings Market AGR [%] by Region – 2016-2025. 80

Table 21 – Global Explosives & Weapons Detection Secured Perimeters & Buildings Market Share [%] by Region – 2016-2025. 80

Table 22 – Global Explosives & Weapons Detection Systems Postal Security Market Size [$M] by Region – 2016-2025. 84

Table 23 – Global Explosives & Weapons Detection Systems Postal Security Market AGR [%] by Region – 2016-2025. 85

Table 24 – Global Explosives & Weapons Detection Systems Postal Security Market Share [%] by Region – 2016-2025. 86

Table 25 – Ranking of Manmade & Natural Disasters, Crime and Terror Threats  as a Market Driver 92

Table 26 – Police Modernization & Other 1st Responders Market:  Business Opportunities  94

Table 27 – Police Modernization & Other 1st Responders Market: Competitive Analysis  99

Table 28 – Global Explosives & Weapons Detection Systems Public Venue Security Market Size [$M] by Region – 2016-2025. 101

Table 29 – Global Explosives & Weapons Detection Systems Public Venue Security Market AGR [%] by Region – 2016-2025. 102

Table 30 – Global Explosives & Weapons Detection Systems Public Venue Security Market Share [%] by Region – 2016-2025. 103

Table 31 – Global Explosives & Weapons Detection Systems Other Vertical Markets Size [$M] by Region – 2016-2025. 104

Table 32 – Global Explosives & Weapons Detection Systems Other Vertical Markets AGR [%] by Region – 2016-2025. 105

Table 33 – Global Explosives & Weapons Detection Systems Other Vertical Markets Share [%] by Region – 2016-2025. 105

Table 34 – Global Explosives & Weapons Detection Systems Market Size [$M] by Technology – 2016-2025. 107

Table 35 – Global Explosives & Weapons Detection Systems Market AGR [%] by Technology – 2016-2025. 109

Table 36 – Global Explosives & Weapons Detection Systems Market Share [%] by Technology – 2016-2025. 110

Table 37 – ETD Screening Market: Business Opportunities. 118

Table 38 – Global Explosives Trace Detection (ETD) Systems Market Size [$M] by Region – 2016-2025. 123

Table 39 – Global Explosives Trace Detection (ETD) Systems Market AGR [%] by Region – 2016-2025. 124

Table 40 – Global Explosives Trace Detection (ETD) Systems Market Share [%] by Region – 2016-2025. 125

Table 41 – Metal Detectors Market: Business Opportunities. 131

Table 42 – Global Metal Detectors Market Size [$M] by Region – 2016-2025. 133

Table 43 – Global Metal Detectors Market AGR [%] by Region – 2016-2025. 134

Table 44 – Global Metal Detectors Market Share [%] by Region – 2016-2025. 135

Table 45 – Standoff IED Detection Technologies. 159

Table 46 – Global Standoff Detection Systems Market Size [$M] by Region – 2016-2025  161

Table 47 – Global Standoff Detection Systems Market AGR [%] by Region – 2016-2025  162

Table 48 – Global Standoff Detection Systems Market Share [%] by Region – 2016-2025  162

Table 49 – Global Explosives & Weapons Detection Systems IoT & Predictive Maintenance Market Size [$M] by Region – 2016-2025. 168

Table 50 – Global Explosives & Weapons Detection Systems IoT & Predictive Maintenance Market AGR [%] by Region – 2016-2025. 169

Table 51 – Global Explosives & Weapons Detection Systems IoT & Predictive Maintenance Market Share [%] by Region – 2016-2025. 170

Table 52 – Global EDS & BHS Market Size [$M] by Region – 2016-2025. 173

Table 53 – Global EDS & BHS Market AGR [%] by Region – 2016-2025. 174

Table 54 – Global EDS & BHS Market Share [%] by Region – 2016-2025. 174

Table 55 – Backscatter People Screening AIT Portals –  Advantages & Disadvantages  182

Table 56 – Reflectivity of Basic Explosives and Human Tissue. 184

Table 57 – Examples of Object Emissivity. 186

Table 58 – Active MMWave Screening: Advantages & Disadvantages. 188

Table 59 – Global Full Body Scanners (AIT) Market Size [$M] by Region – 2016-2025  192

Table 60 – Global Full Body Scanners (AIT) Market AGR [%] by Region – 2016-2025  193

Table 61 – Global Full Body Scanners (AIT) Market Share [%] by Region – 2016-2025  194

Table 62 – Airport X-ray Screening Market Opportunities by Region.. 198

Table 63 – X-ray Screening Market: Business Opportunities. 201

Table 64 – Global Explosives & Weapons Detection X-ray Scanners (w/o AIT) Market Size [$M] by Region – 2016-2025. 206

Table 65 – Global Explosives & Weapons Detection X-ray Scanners (w/o AIT) Market AGR [%] by Region – 2016-2025. 207

Table 66 – Global Explosives & Weapons Detection X-ray Scanners (w/o AIT) Market Share [%] by Region – 2016-2025. 208

Table 67 – Global Explosives & Weapons Detection Systems Big Data & Data Analytics Market Size [$M] by Region – 2016-2025. 215

Table 68 – Global Explosives & Weapons Detection Systems Big Data & Data Analytics Market AGR [%] by Region – 2016-2025. 216

Table 69 – Global Explosives & Weapons Detection Systems Big Data & Data Analytics Market Share [%] by Region – 2016-2025. 217

Table 70 – Global Explosives & Weapons Detection Systems Market Size [$M] by Region – 2016-2025. 218

Table 71 – Global Explosives & Weapons Detection Systems Market AGR [%] by Region – 2016-2025. 219

Table 72 – Global Explosives & Weapons Detection Systems Market Share [%] by Region – 2016-2025. 220

Volume 2 – List of Tables

Table 1 – North America Explosives & Weapons Detection Systems Market [$M] by  Vertical Market – 2016-2025. 26

Table 2 – North America Explosives & Weapons Detection Systems Market AGR [%] by  Vertical Market – 2016-2025. 27

Table 3 – North America Explosives & Weapons Detection Systems Market Share [%] by  Vertical Market – 2016-2025. 28

Table 4 – North America Explosives & Weapons Detection Systems Market [$M] by Technology – 2016-2025. 30

Table 5 – North America Explosives & Weapons Detection Systems Market AGR [%] by Technology – 2016-2025. 31

Table 6 – North America Explosives & Weapons Detection Systems Market Share [%] by Technology – 2016-2025. 32

Table 7 – North America Explosives & Weapons Detection Systems Market [$M] by Country – 2016-2025. 33

Table 8 – U.S. Explosives & Weapons Detection Systems Market Size [$M] by Revenue Segment – 2016-2025. 34

Table 9 – U.S. Explosives & Weapons Detection Systems Market AGR [%] by Revenue Segment  – 2016-2025. 36

Table 10 – U.S. Explosives & Weapons Detection Systems Market Share [%] by Revenue Segment – 2016-2025. 36

Table 11 – Canada Explosives & Weapons Detection Systems Market Size [$M] by Revenue Segment – 2016-2025. 38

Table 12 – Canada Explosives & Weapons Detection Systems Market AGR [%] by Revenue Segment  – 2016-2025. 40

Table 13 – Canada Explosives & Weapons Detection Systems Market Share [%] by Revenue Segment – 2016-2025. 40

Table 14 – Latin America Explosives & Weapons Detection Systems Market [$M] by  Vertical Market – 2016-2025. 42

Table 15 – Latin America Explosives & Weapons Detection Systems Market AGR [%] by  Vertical Market – 2016-2025. 43

Table 16 – Latin America Explosives & Weapons Detection Systems Market Share [%] by  Vertical Market – 2016-2025. 44

Table 17 – Latin America Explosives & Weapons Detection Systems Market [$M] by Technology – 2016-2025. 46

Table 18 – Latin America Explosives & Weapons Detection Systems Market AGR [%] by Technology – 2016-2025. 47

Table 19 – Latin America Explosives & Weapons Detection Systems Market Share [%] by Technology – 2016-2025. 48

Table 20 – Latin America Explosives & Weapons Detection Systems Market [$M] by Country – 2016-2025. 49

Table 21 – Mexico Explosives & Weapons Detection Systems Market Size [$M] by Revenue Segment – 2016-2025. 50

Table 22 – Mexico Explosives & Weapons Detection Systems Market AGR [%] by Revenue Segment  – 2016-2025. 52

Table 23 – Mexico Explosives & Weapons Detection Systems Market Share [%] by Revenue Segment – 2016-2025. 52

Table 24 – Colombia Explosives & Weapons Detection Systems Market Size [$M] by Revenue Segment – 2016-2025. 54

Table 25 – Colombia Explosives & Weapons Detection Systems Market AGR [%] by Revenue Segment  – 2016-2025. 56

Table 26 – Colombia Explosives & Weapons Detection Systems Market Share [%] by Revenue Segment – 2016-2025. 56

Table 27 – Brazil Explosives & Weapons Detection Systems Market Size [$M] by Revenue Segment – 2016-2025. 58

Table 28 – Brazil Explosives & Weapons Detection Systems Market AGR [%] by Revenue Segment  – 2016-2025. 60

Table 29 – Brazil Explosives & Weapons Detection Systems Market Share [%] by Revenue Segment – 2016-2025. 60

Table 30 – Argentina Explosives & Weapons Detection Systems Market Size [$M] by Revenue Segment – 2016-2025. 62

Table 31 – Argentina Explosives & Weapons Detection Systems Market AGR [%] by Revenue Segment  – 2016-2025. 64

Table 32 – Argentina Explosives & Weapons Detection Systems Market Share [%] by Revenue Segment – 2016-2025. 64

Table 33 – Other Latin America Explosives & Weapons Detection Systems Market Size [$M] by Revenue Segment – 2016-2025. 66

Table 34 – Other Latin America Explosives & Weapons Detection Systems Market AGR [%] by Revenue Segment  – 2016-2025. 68

Table 35 – Other Latin America Explosives & Weapons Detection Systems Market Share [%] by Revenue Segment – 2016-2025. 68

Table 36 – Europe Explosives & Weapons Detection Systems Market [$M] by  Vertical Market – 2016-2025. 70

Table 37 – Europe Explosives & Weapons Detection Systems Market AGR [%] by  Vertical Market – 2016-2025. 71

Table 38 – Europe Explosives & Weapons Detection Systems Market Share [%] by  Vertical Market – 2016-2025. 72

Table 39 – Europe Explosives & Weapons Detection Systems Market [$M] by Technology – 2016-2025. 74

Table 40 – Europe Explosives & Weapons Detection Systems Market AGR [%] by Technology – 2016-2025. 75

Table 41 – Europe Explosives & Weapons Detection Systems Market Share [%] by Technology – 2016-2025. 76

Table 42 – Europe Explosives & Weapons Detection Systems Market [$M] by Country – 2016-2025. 77

Table 43 – U.K. Explosives & Weapons Detection Systems Market Size [$M] by Revenue Segment – 2016-2025. 79

Table 44 – U.K. Explosives & Weapons Detection Systems Market AGR [%] by Revenue Segment  – 2016-2025. 81

Table 45 – U.K. Explosives & Weapons Detection Systems Market Share [%] by Revenue Segment – 2016-2025. 81

Table 46 – Sweden Explosives & Weapons Detection Systems Market Size [$M] by Revenue Segment – 2016-2025. 83

Table 47 – Sweden Explosives & Weapons Detection Systems Market AGR [%] by Revenue Segment  – 2016-2025. 85

Table 48 – Sweden Explosives & Weapons Detection Systems Market Share [%] by Revenue Segment – 2016-2025. 85

Table 49 – Denmark Explosives & Weapons Detection Systems Market Size [$M] by Revenue Segment – 2016-2025. 87

Table 50 – Denmark Explosives & Weapons Detection Systems Market AGR [%] by Revenue Segment  – 2016-2025. 89

Table 51 – Denmark Explosives & Weapons Detection Systems Market Share [%] by Revenue Segment – 2016-2025. 89

Table 52 – Netherlands Explosives & Weapons Detection Systems Market Size [$M] by Revenue Segment – 2016-2025. 91

Table 53 – Netherlands Explosives & Weapons Detection Systems Market AGR [%] by Revenue Segment  – 2016-2025. 93

Table 54 – Netherlands Explosives & Weapons Detection Systems Market Share [%] by Revenue Segment – 2016-2025. 93

Table 55 – Belgium Explosives & Weapons Detection Systems Market Size [$M] by Revenue Segment – 2016-2025. 95

Table 56 – Belgium Explosives & Weapons Detection Systems Market AGR [%] by Revenue Segment  – 2016-2025. 97

Table 57 – Belgium Explosives & Weapons Detection Systems Market Share [%] by Revenue Segment – 2016-2025. 97

Table 58 – Germany Explosives & Weapons Detection Systems Market Size [$M] by Revenue Segment – 2016-2025. 99

Table 59 – Germany Explosives & Weapons Detection Systems Market AGR [%] by Revenue Segment  – 2016-2025. 101

Table 60 – Germany Explosives & Weapons Detection Systems Market Share [%] by Revenue Segment – 2016-2025. 101

Table 61 – France Explosives & Weapons Detection Systems Market Size [$M] by Revenue Segment – 2016-2025. 103

Table 62 – France Explosives & Weapons Detection Systems Market AGR [%] by Revenue Segment  – 2016-2025. 105

Table 63 – France Explosives & Weapons Detection Systems Market Share [%] by Revenue Segment – 2016-2025. 105

Table 64 – Spain Explosives & Weapons Detection Systems Market Size [$M] by Revenue Segment – 2016-2025. 107

Table 65 – Spain Explosives & Weapons Detection Systems Market AGR [%] by Revenue Segment  – 2016-2025. 109

Table 66 – Spain Explosives & Weapons Detection Systems Market Share [%] by Revenue Segment – 2016-2025. 109

Table 67 – Italy Explosives & Weapons Detection Systems Market Size [$M] by Revenue Segment – 2016-2025. 111

Table 68 – Italy Explosives & Weapons Detection Systems Market AGR [%] by Revenue Segment  – 2016-2025. 113

Table 69 – Italy Explosives & Weapons Detection Systems Market Share [%] by Revenue Segment – 2016-2025. 113

Table 70 – Austria Explosives & Weapons Detection Systems Market Size [$M] by Revenue Segment – 2016-2025. 115

Table 71 – Austria Explosives & Weapons Detection Systems Market AGR [%] by Revenue Segment  – 2016-2025. 117

Table 72 – Austria Explosives & Weapons Detection Systems Market Share [%] by Revenue Segment – 2016-2025. 117

Table 73 – Czech Republic Explosives & Weapons Detection Systems Market Size [$M] by Revenue Segment – 2016-2025. 119

Table 74 – Czech Republic Explosives & Weapons Detection Systems Market AGR [%] by Revenue Segment  – 2016-2025. 121

Table 75 – Czech Republic Explosives & Weapons Detection Systems Market Share [%] by Revenue Segment – 2016-2025. 121

Table 76 – Poland Explosives & Weapons Detection Systems Market Size [$M] by Revenue Segment – 2016-2025. 123

Table 77 – Poland Explosives & Weapons Detection Systems Market AGR [%] by Revenue Segment  – 2016-2025. 125

Table 78 – Poland Explosives & Weapons Detection Systems Market Share [%] by Revenue Segment – 2016-2025. 125

Table 79 – Russia Explosives & Weapons Detection Systems Market Size [$M] by Revenue Segment – 2016-2025. 127

Table 80 – Russia Explosives & Weapons Detection Systems Market AGR [%] by Revenue Segment  – 2016-2025. 129

Table 81 – Russia Explosives & Weapons Detection Systems Market Share [%] by Revenue Segment – 2016-2025. 129

Table 82 – Other European Countries Explosives & Weapons Detection Systems Market Size [$M] by Revenue Segment – 2016-2025. 131

Table 83 – Other European Countries Explosives & Weapons Detection Systems Market AGR [%] by Revenue Segment  – 2016-2025. 133

Table 84 – Other European Countries Explosives & Weapons Detection Systems Market Share [%] by Revenue Segment – 2016-2025. 133

Table 85 – Middle East & Africa Explosives & Weapons Detection Systems Market [$M] by  Vertical Market – 2016-2025. 135

Table 86 – Middle East & Africa Explosives & Weapons Detection Systems Market AGR [%] by  Vertical Market – 2016-2025. 136

Table 87 – Middle East & Africa Explosives & Weapons Detection Systems Market Share [%] by  Vertical Market – 2016-2025. 137

Table 88 – Middle East & Africa Explosives & Weapons Detection Systems Market [$M] by Technology – 2016-2025. 139

Table 89 – Middle East & Africa Explosives & Weapons Detection Systems Market AGR [%] by Technology – 2016-2025. 140

Table 90 – Middle East & Africa Explosives & Weapons Detection Systems Market Share [%] by Technology – 2016-2025. 141

Table 91 – MEA Explosives & Weapons Detection Systems Market [$M] by Country – 2016-2025. 142

Table 92 – Turkey Explosives & Weapons Detection Systems Market Size [$M] by Revenue Segment – 2016-2025. 144

Table 93 – Turkey Explosives & Weapons Detection Systems Market AGR [%] by Revenue Segment  – 2016-2025. 145

Table 94 – Turkey Explosives & Weapons Detection Systems Market Share [%] by Revenue Segment – 2016-2025. 145

Table 95 – Israel Explosives & Weapons Detection Systems Market Size [$M] by Revenue Segment – 2016-2025. 147

Table 96 – Israel Explosives & Weapons Detection Systems Market AGR [%] by Revenue Segment  – 2016-2025. 149

Table 97 – Israel Explosives & Weapons Detection Systems Market Share [%] by Revenue Segment – 2016-2025. 149

Table 98 – Saudi Arabia Explosives & Weapons Detection Systems Market Size [$M] by Revenue Segment – 2016-2025. 151

Table 99 – Saudi Arabia Explosives & Weapons Detection Systems Market AGR [%] by Revenue Segment  – 2016-2025. 153

Table 100 – Saudi Arabia Explosives & Weapons Detection Systems Market Share [%] by Revenue Segment – 2016-2025. 153

Table 101 – UAE Explosives & Weapons Detection Systems Market Size [$M] by Revenue Segment – 2016-2025. 155

Table 102 – UAE Explosives & Weapons Detection Systems Market AGR [%] by Revenue Segment  – 2016-2025. 157

Table 103 – UAE Explosives & Weapons Detection Systems Market Share [%] by Revenue Segment – 2016-2025. 157

Table 104 – Qatar Explosives & Weapons Detection Systems Market Size [$M] by Revenue Segment – 2016-2025. 159

Table 105 – Qatar Explosives & Weapons Detection Systems Market AGR [%] by Revenue Segment  – 2016-2025. 161

Table 106 – Qatar Explosives & Weapons Detection Systems Market Share [%] by Revenue Segment – 2016-2025. 161

Table 107 – Kuwait Explosives & Weapons Detection Systems Market Size [$M] by Revenue Segment – 2016-2025. 163

Table 108 – Kuwait Explosives & Weapons Detection Systems Market AGR [%] by Revenue Segment  – 2016-2025. 165

Table 109 – Kuwait Explosives & Weapons Detection Systems Market Share [%] by Revenue Segment – 2016-2025. 165

Table 110 – Iraq Explosives & Weapons Detection Systems Market Size [$M] by Revenue Segment – 2016-2025. 167

Table 111 – Iraq Explosives & Weapons Detection Systems Market AGR [%] by Revenue Segment  – 2016-2025. 169

Table 112 – Iraq Explosives & Weapons Detection Systems Market Share [%] by Revenue Segment – 2016-2025. 169

Table 113 – Nigeria Explosives & Weapons Detection Systems Market Size [$M] by Revenue Segment – 2016-2025. 171

Table 114 – Nigeria Explosives & Weapons Detection Systems Market AGR [%] by Revenue Segment  – 2016-2025. 173

Table 115 – Nigeria Explosives & Weapons Detection Systems Market Share [%] by Revenue Segment – 2016-2025. 173

Table 116 – South Africa Explosives & Weapons Detection Systems Market Size [$M] by Revenue Segment – 2016-2025. 175

Table 117 – South Africa Explosives & Weapons Detection Systems Market AGR [%] by Revenue Segment  – 2016-2025. 177

Table 118 – South Africa Explosives & Weapons Detection Systems Market Share [%] by Revenue Segment – 2016-2025. 177

Table 119 – Other MEA Countries Explosives & Weapons Detection Systems Market Size [$M] by Revenue Segment – 2016-2025. 179

Table 120 – Other MEA Countries Explosives & Weapons Detection Systems Market AGR [%] by Revenue Segment  – 2016-2025. 181

Table 121 – Other MEA Countries Explosives & Weapons Detection Systems Market Share [%] by Revenue Segment – 2016-2025. 181

Table 122 – Asia-Pacific Explosives & Weapons Detection Systems Market [$M] by  Vertical Market – 2016-2025. 183

Table 123 – Asia-Pacific Explosives & Weapons Detection Systems Market AGR [%] by  Vertical Market – 2016-2025. 184

Table 124 – Asia-Pacific Explosives & Weapons Detection Systems Market Share [%] by  Vertical Market – 2016-2025. 185

Table 125 – Asia-Pacific Explosives & Weapons Detection Systems Market [$M] by Technology – 2016-2025. 187

Table 126 – Asia-Pacific Explosives & Weapons Detection Systems Market AGR [%] by Technology – 2016-2025. 188

Table 127 – Asia-Pacific Explosives & Weapons Detection Systems Market Share [%] by Technology – 2016-2025. 189

Table 128 – APAC Explosives & Weapons Detection Systems Market [$M] by Country – 2016-2025. 190

Table 129 – Azerbaijan Explosives & Weapons Detection Systems Market Size [$M] by Revenue Segment – 2016-2025. 192

Table 130 – Azerbaijan Explosives & Weapons Detection Systems Market AGR [%] by Revenue Segment  – 2016-2025. 194

Table 131 – Azerbaijan Explosives & Weapons Detection Systems Market Share [%] by Revenue Segment – 2016-2025. 194

Table 132 – Kazakhstan Explosives & Weapons Detection Systems Market Size [$M] by Revenue Segment – 2016-2025. 196

Table 133 – Kazakhstan Explosives & Weapons Detection Systems Market AGR [%] by Revenue Segment  – 2016-2025. 198

Table 134 – Kazakhstan Explosives & Weapons Detection Systems Market Share [%] by Revenue Segment – 2016-2025. 198

Table 135 – Pakistan Explosives & Weapons Detection Systems Market Size [$M] by Revenue Segment – 2016-2025. 200

Table 136 – Pakistan Explosives & Weapons Detection Systems Market AGR [%] by Revenue Segment  – 2016-2025. 202

Table 137 – Pakistan Explosives & Weapons Detection Systems Market Share [%] by Revenue Segment – 2016-2025. 202

Table 138 – India Explosives & Weapons Detection Systems Market Size [$M] by Revenue Segment – 2016-2025. 204

Table 139 – India Explosives & Weapons Detection Systems Market AGR [%] by Revenue Segment  – 2016-2025. 206

Table 140 – India Explosives & Weapons Detection Systems Market Share [%] by Revenue Segment – 2016-2025. 206

Table 141 – China Explosives & Weapons Detection Systems Market Size [$M] by Revenue Segment – 2016-2025. 208

Table 142 – China Explosives & Weapons Detection Systems Market AGR [%] by Revenue Segment  – 2016-2025. 210

Table 143 – China Explosives & Weapons Detection Systems Market Share [%] by Revenue Segment – 2016-2025. 210

Table 144 – Taiwan Explosives & Weapons Detection Systems Market Size [$M] by Revenue Segment – 2016-2025. 212

Table 145 – Taiwan Explosives & Weapons Detection Systems Market AGR [%] by Revenue Segment  – 2016-2025. 214

Table 146 – Taiwan Explosives & Weapons Detection Systems Market Share [%] by Revenue Segment – 2016-2025. 214

Table 147 – South Korea Explosives & Weapons Detection Systems Market Size [$M] by Revenue Segment – 2016-2025. 216

Table 148 – South Korea Explosives & Weapons Detection Systems Market AGR [%] by Revenue Segment  – 2016-2025. 218

Table 149 – South Korea Explosives & Weapons Detection Systems Market Share [%] by Revenue Segment – 2016-2025. 218

Table 150 – Japan Explosives & Weapons Detection Systems Market Size [$M] by Revenue Segment – 2016-2025. 220

Table 151 – Japan Explosives & Weapons Detection Systems Market AGR [%] by Revenue Segment  – 2016-2025. 222

Table 152 – Japan Explosives & Weapons Detection Systems Market Share [%] by Revenue Segment – 2016-2025. 222

Table 153 – Singapore Explosives & Weapons Detection Systems Market Size [$M] by Revenue Segment – 2016-2025. 224

Table 154 – Singapore Explosives & Weapons Detection Systems Market AGR [%] by Revenue Segment  – 2016-2025. 226

Table 155 – Singapore Explosives & Weapons Detection Systems Market Share [%] by Revenue Segment – 2016-2025. 226

Table 156 – Malaysia Explosives & Weapons Detection Systems Market Size [$M] by Revenue Segment – 2016-2025. 228

Table 157 – Malaysia Explosives & Weapons Detection Systems Market AGR [%] by Revenue Segment  – 2016-2025. 230

Table 158 – Malaysia Explosives & Weapons Detection Systems Market Share [%] by Revenue Segment – 2016-2025. 230

Table 159 – Indonesia Explosives & Weapons Detection Systems Market Size [$M] by Revenue Segment – 2016-2025. 232

Table 160 – Indonesia Explosives & Weapons Detection Systems Market AGR [%] by Revenue Segment  – 2016-2025. 234

Table 161 – Indonesia Explosives & Weapons Detection Systems Market Share [%] by Revenue Segment – 2016-2025. 234

Table 162 – Australia Explosives & Weapons Detection Systems Market Size [$M] by Revenue Segment – 2016-2025. 236

Table 163 – Australia Explosives & Weapons Detection Systems Market AGR [%] by Revenue Segment  – 2016-2025. 238

Table 164 – Australia Explosives & Weapons Detection Systems Market Share [%] by Revenue Segment – 2016-2025. 238

Table 165 – Other APAC Countries Explosives & Weapons Detection Systems Market Size [$M] by Revenue Segment – 2016-2025. 240

Table 166 – Other APAC Countries Explosives & Weapons Detection Systems Market AGR [%] by Revenue Segment  – 2016-2025. 242

Table 167 – Other APAC Countries Explosives & Weapons Detection Systems Market Share [%] by Revenue Segment – 2016-2025. 242

Volume 4 – List of Tables

Table 1 – Major U.S. Airports: Passengers Screening, Carry-on & Checked Baggage Screening [M] by Airport – 2016 & 2019. 41

Table 2 – Major Canadian Airports: Passengers Screening, Carry-on & Checked Baggage Screening [M] by Airport – 2016 & 2019. 62

Table 3 – Major Mexican Airports: Number of Screened Passengers & Screened Baggage (Carry-on & Checked Baggage) [M] by Airport – 2016 & 2019. 74

Table 4 – Major Colombian Airports: Passengers Screening, Carry-on & Checked Baggage Screening [M] by Airport – 2016 & 2019. 82

Table 5 – Major Brazilian Airports: Passengers Screening, Carry-on & Checked Baggage Screening [M] by Airport – 2016 & 2019. 90

Table 6 – Major Argentina Airports: Passengers Screening, Carry-on & Checked Baggage Screening [M] by Airport – 2016 & 2019. 97

Table 7 – Major UK Airports: Passengers Screening, Carry-on & Checked Baggage Screening [M] by Airport – 2016 & 2019. 125

Table 8 – French Airports: Passengers Screening, Carry-on & Checked Baggage Screening [M] by 57 Airports – 2016 & 2019. 151

Table 9 – Migrant Stock in Belgium by Country of Origin.. 181

Table 10 – Major Swedish Airports: Passengers Screening, Carry-on & Checked Baggage Screening [M] by Airport – 2016 & 2019. 187

Table 11 – Major Danish Airports: Passengers Screening, Carry-on & Checked Baggage Screening [M] by Airport – 2016 & 2019. 192

Table 12 – Major German Airports: Passengers Screening, Carry-on & Checked Baggage Screening [M] by Airport – 2016 & 2019. 221

Table 13 – Major Italian Airports: Passengers Screening, Carry-on & Checked Baggage Screening [M] by Airport – 2016 & 2019. 234

Table 14 – Major Spanish Airports: Passengers Screening, Carry-on & Checked Baggage Screening [M] by Airport – 2016 & 2019. 241

Table 15 – Major Poland Airports: Passengers Screening, Carry-on & Checked Baggage Screening [M] by Airport – 2016 & 2019. 244

Table 16 – Major Russian Airports: Passengers Screening, Carry-on & Checked Baggage Screening [M] by Airport – 2016 & 2019. 253

Table 17 – Major Turkish Airports: Passengers Screening, Carry-on & Checked Baggage Screening [M] by Airport – 2016 & 2019. 266

Table 18 – Major Israeli Airports: Passengers Screening, Carry-on & Checked Baggage Screening [M] by Airport – 2016 & 2019. 279

Table 19 – Major Saudi Arabian Airports: Passengers Screening, Carry-on & Checked Baggage Screening [M] by Airport – 2016 & 2019. 294

Table 20 – Major UAE Airports: Passengers Screening, Carry-on & Checked Baggage Screening [M] by Airport – 2016 & 2019. 320

Table 21 – Kuwait Airport: Passengers Screening, Carry-on & Checked Baggage Screening [M] – 2016 & 2019. 338

Table 22 – Nigeria Police Departments & Responsibilities. 345

Table 23 – Major Nigerian Airports: Passengers Screening, Carry-on & Checked Baggage Screening [M] by Airport – 2016 & 2019. 348

Table 24 – Major South African Airports: Passengers Screening, Carry-on & Checked Baggage Screening [M] by Airport – 2016 & 2019. 355

Table 25 – Major India Airports: Passengers Screening, Carry-on & Checked Baggage Screening [M] by Airport – 2016 & 2019. 368

Table 26 – Major Chinese Airports: Passengers Screening, Carry-on & Checked Baggage Screening [M] by Airport – 2016 & 2019. 387

Table 27 – Major South Korean Airports: Passengers Screening, Carry-on & Checked Baggage Screening [M] by Airport – 2016 & 2019. 398

Table 28 – Japan Passenger Screening [M] in 50 Airports – 2016-2019. 405

Table 29 – Major Australian Airports: Passengers Screening, Carry-on & Checked Baggage Screening [M] by Airport – 2016 & 2019. 413

Table 30 – Azerbaijan Ministry of Internal Affairs Crime Statistics. 416

Table 31 – 2013 Ministry of Internal Affairs Crime Statistics. 420

Table 32 – Singapore Airport: Number of Screened Passengers & Screened Baggage (Carry-on & Checked Baggage) [M] – 2016 & 2019. 434

Table 33 – Major Malaysian Airports: Passengers Screening, Carry-on & Checked Baggage Screening [M] by Airport – 2016 & 2019. 442

Table 34 – Major Indonesian Airports: Passengers Screening, Carry-on & Checked Baggage Screening [M] by Airport – 2016 & 2019. 451

Volume 5 – List of Tables


Table 1 – EDS, ETD and 2D X-ray Technologies – Pros and Cons. 32

Table 2 – Price Comparison of Bulk Explosives Screening Technologies. 32

Table 3 – Explosives, Drugs, and Common X-ray “Interruption” Materials. 35

Table 4 – Backscatter People Screening Portals – Advantages & Disadvantages. 49

Table 5 – Comparison of X-ray Detection Technologies. 54

Table 6 – X-ray Standards for Bulk Explosives Detection.. 56

Table 7 – Comparison of Standoff IED, PBIED & VBIED Detection Technologies. 62

Table 8 – Retica Standoff Biometric System Performance. 72

Table 9 – Standoff IED, PVIED & VBIED UGV Detection Technology:  Features & Benefits  83

Table 10 – Mechanically Scanning MMWave Camera Performance. 108

Table 11 – Comparison of Laser Based Standoff Explosives  Detection Technologies  123

Table 12 – Manufacturer Points of Contact 163

Table 13 – Certified Explosives & Weapons Detection Products. 164

Table 14 – Certified Non-EDS 2D X-ray Devices. 166

Table 15 – List of Authorized Air-Cargo on Passenger Plans Screening Facilities. 167

Table 16 – European Explosives & Weapons Detection Related Product Standards  199

Table 17 – Machine Learning Method Types. 229

Table 18 – Legacy Analytics Vs. Big Data Analytics. 231

Table 19 – Mission Critical Applications and Scope of Activity. 236

Table 20 – Passive Data Sources. 259

Table 21 – Active Data Sources. 259


Figures

Volume 1 – Volume 5 – Explosives & Weapons Detection Systems – List of Figures

Volume 1 – List of Figures

Figure 1 – Explosives & Weapons Detection Technologies: Global Market & Industry 207 Submarkets: 5 Granulation Vectors. 17

Figure 2 – Explosives & Weapons Detection Market Trends. 23

Figure 3 – Types of Airport Attacks by Weapons Used [%] 26

Figure 4 – Boeing Aviation Passengers 2015-2034 CAGR [%] Forecast 30

Figure 5 – Global Explosives & Weapons Detection Systems Market Size [$M] by Vertical Market – 2016-2025. 35

Figure 6 – Global Explosives & Weapons Detection Systems Market Size [$M] by Technology – 2016-2025. 36

Figure 7 – Global Explosives & Weapons Detection Systems Market Share [%] by Region – 2016-2025. 38

Figure 8 – Explosives & Weapons Detection Systems Market: Barriers to Entry, Supplier Power, Buyer Power and Barriers to Substitution.. 47

Figure 9 – Global Explosives & Weapons Detection Systems Market Size [$M] by Vertical Market – 2016-2025. 49

Figure 10 – Global Explosives & Weapons Detection Systems Market Share [%] by Vertical Market – 2016-2025. 51

Figure 11 – Aviation & Maritime Multi-Layered Security Infrastructure. 54

Figure 12 – Airport Security: Hand-Held Baggage & People Explosives & Weapons Detection Screening. 55

Figure 13 – Types of Airport Attacks by Weapons Used [%] 56

Figure 14 – A Multi-lane People & Baggage Screening Site. 58

Figure 15 – Airport Passengers [RPK] by Region 1994- 2034. 59

Figure 16 – Global Explosives & Weapons Detection Systems Aviation Security Market Size [$M] by Region – 2016-2025. 63

Figure 17 – Global Explosives & Weapons Detection Systems Aviation Security Market Share [%] by Region – 2016-2025. 64

Figure 18 – Global Explosives & Weapons Detection Maritime Security Market Size [$M] by Region – 2016-2025. 68

Figure 19 – Global Explosives & Weapons Detection Maritime Security Market Share [%] by Region – 2016-2025. 70

Figure 20 – Global Explosives & Weapons Detection Land Transportation Security Market Size [$M] by Region – 2016-2025. 75

Figure 21 – Global Explosives & Weapons Detection Land Transportation Security Market Share [%] by Region – 2016-2025. 76

Figure 22 – Perimeters & Buildings Security Systems, Layers of Security. 77

Figure 23 – Global Explosives & Weapons Detection Secured Perimeters & Buildings Market Size [$M] by Region – 2016-2025. 79

Figure 24 – Global Explosives & Weapons Detection Secured Perimeters & Buildings Market Share [%] by Region – 2016-2025. 81

Figure 25 – Global Explosives & Weapons Detection Systems Postal Security Market Size [$M] by Region – 2016-2025. 85

Figure 26 – Global Explosives & Weapons Detection Systems Postal Security Market Share [%] by Region – 2016-2025. 86

Figure 27 – Future 1st Responders Communications Services. 90

Figure 28 – First Responders’ Mobile Devices Network. 91

Figure 29 – Global Explosives & Weapons Detection Systems Public Venue Security Market Size [$M] by Region – 2016-2025. 102

Figure 30 – Global Explosives & Weapons Detection Systems Public Venue Security Market Share [%] by Region – 2016-2025. 103

Figure 31 – Global Explosives & Weapons Detection Systems Other Vertical Markets Size [$M] by Region – 2016-2025. 104

Figure 32 – Global Explosives & Weapons Detection Systems Other Vertical Markets Share [%] by Region – 2016-2025. 106

Figure 33 – Global Explosives & Weapons Detection Systems Market Size [$M] by Technology – 2016-2025. 108

Figure 34 – Global Explosives & Weapons Detection Systems Market Share [%] by Technology – 2016-2025. 110

Figure 35 – ETD Systems Market: Barriers to Entry, Supplier Power, Buyer Power and Barriers to Substitution.. 122

Figure 36 – Global Explosives Trace Detection (ETD) Systems Market Size [$M] by Region – 2016-2025. 124

Figure 37 – Global Explosives Trace Detection (ETD) Systems Market Share [%] by Region – 2016-2025. 125

Figure 38 – Metal Detection Portals Technologies. 130

Figure 39 – Global Metal Detectors Market Size [$M] by Region – 2016-2025. 134

Figure 40 – Global Metal Detectors Market Share [%] by Region – 2016-2025. 135

Figure 41 – IED Ready for Detonation.. 137

Figure 42 – IED Food Chain and Its Relevant Time Frame. 138

Figure 43 – Counter-IED – Mixed Mode Approach.. 140

Figure 44 – Global IED Suicide Attack. 147

Figure 45 – IED Suicide Attacks in 5 Countries. 147

Figure 46 – 148

Figure 47 –  Terror Suicide Attacks by IEDs (left)  and by Targets (Right) 148

Figure 48 – Improvised Explosives Device Kill Chain. 149

Figure 49 – Suicide Vest PBIEDs Configurations. 150

Figure 50 – Suicide Attack Sequence. 152

Figure 51 – Standoff & Non-Standoff IED Bulk Detection Technologies. 157

Figure 52 – Standoff IED Trace Detection Technologies. 158

Figure 53 – Global Standoff Detection Systems Market Size [$M] by Region – 2016-2025  161

Figure 54 – Global Standoff Detection Systems Market Share [%] by Region – 2016-2025  163

Figure 55 – Global Explosives & Weapons Detection Systems IoT & Predictive Maintenance Market Size [$M] by Region – 2016-2025. 169

Figure 56 – Global Explosives & Weapons Detection Systems IoT & Predictive Maintenance Market Share [%] by Region – 2016-2025. 170

Figure 57 – Global EDS & BHS Market Size [$M] by Region – 2016-2025. 173

Figure 58 – Global EDS & BHS Market Share [%] by Region – 2016-2025. 175

  • Figure 59 – People Screening Technologies – Threats and Associated Detection Technologies. 177

Figure 60 – Passenger Screening Process Using Advanced Imaging Technology. 180

Figure 61 – Dose Comparison: Environmental Radiation vs. Backscatter Scan.. 182

Figure 62 – Spectrum of MMWave Technologies. 184

Figure 63 – Active MMWave Imaging Technology – Principles of Operation.. 186

Figure 64 – A Passive MMWave Whole-Body Scanner Layout 191

Figure 65 – Passive MMWave Scanner: Typical Threat Images. 191

Figure 66 – Global Full Body Scanners (AIT) Market Size [$M] by Region – 2016-2025  193

Figure 67 – Global Full Body Scanners (AIT) Market Share [%] by Region – 2016-2025  194

Figure 68 – X-ray Security Systems Market: Barriers to Entry, Supplier Power, Buyer Power and Barriers to Substitution. 205

Figure 69 – Global Explosives & Weapons Detection X-ray Scanners (w/o AIT) Market Size [$M] by Region – 2016-2025. 207

Figure 70 – Global Explosives & Weapons Detection X-ray Scanners (w/o AIT) Market Share [%] by Region – 2016-2025. 208

Figure 71 – Global Big Data and Data Analytics, Homeland Security and Public Safety Market Size ($M) – 2015-2022. 210

Figure 72 – Main Data Sources for Explosives & Weapons Detection Big Data Projects  212

Figure 73 – Global Explosives & Weapons Detection Systems Big Data & Data Analytics Market Size [$M] by Region – 2016-2025. 216

Figure 74 – Global Explosives & Weapons Detection Systems Big Data & Data Analytics Market Share [%] by Region – 2016-2025. 217

Figure 75 – Global Explosives & Weapons Detection Systems Market Size [$M] by Region – 2016-2025. 219

Figure 76 – Global Explosives & Weapons Detection Systems Market Share [%] by Region – 2016-2025. 221

Volume 2 – List of Figures

Figure 1 – North America Explosives & Weapons Detection Systems Market [$M] by Vertical Market – 2016-2025. 27

Figure 2 – North America Explosives & Weapons Detection Systems Market Share [%] by Vertical Market – 2016-2025. 29

Figure 3 – North America Explosives & Weapons Detection Systems Market [$M] by Technology – 2016-2025. 30

Figure 4 – North America Explosives & Weapons Detection Systems Market Share [%] by Technology – 2016-2025. 32

Figure 5 – North America Explosives & Weapons Detection Systems Market [$M] by Country – 2016-2025. 33

Figure 6 – U.S. Explosives & Weapons Detection Systems Market Size [$M] by Revenue Segment – 2016-2025. 35

Figure 7 – U.S. Explosives & Weapons Detection Systems Market Share [%] by Revenue Segment – 2016-2025. 37

Figure 8 – Canada Explosives & Weapons Detection Systems Market Size [$M] by Revenue Segment – 2016-2025. 39

Figure 9 – Canada Explosives & Weapons Detection Systems Market Share [%] by Revenue Segment – 2016-2025. 41

Figure 10- Latin America Explosives & Weapons Detection Systems Market [$M] by Vertical Market – 2016-2025. 43

Figure 11 – Latin America Explosives & Weapons Detection Systems Market Share [%] by Vertical Market – 2016-2025. 45

Figure 12 – Latin America Explosives & Weapons Detection Systems Market [$M] by Technology – 2016-2025. 46

Figure 13 – Latin America Explosives & Weapons Detection Systems Market Share [%] by Technology – 2016-2025. 48

Figure 14 – Latin America Explosives & Weapons Detection Systems Market [$M] by Country – 2016-2025. 49

Figure 15 – Mexico Explosives & Weapons Detection Systems Market Size [$M] by Revenue Segment – 2016-2025. 51

Figure 16 – Mexico Explosives & Weapons Detection Systems Market Share [%] by Revenue Segment – 2016-2025. 53

Figure 17 – Colombia Explosives & Weapons Detection Systems Market Size [$M] by Revenue Segment – 2016-2025. 55

Figure 18 – Colombia Explosives & Weapons Detection Systems Market Share [%] by Revenue Segment – 2016-2025. 57

Figure 19 – Brazil Explosives & Weapons Detection Systems Market Size [$M] by Revenue Segment – 2016-2025. 59

Figure 20 – Brazil Explosives & Weapons Detection Systems Market Share [%] by Revenue Segment – 2016-2025. 61

Figure 21 – Argentina Explosives & Weapons Detection Systems Market Size [$M] by Revenue Segment – 2016-2025. 63

Figure 22 – Argentina Explosives & Weapons Detection Systems Market Share [%] by Revenue Segment – 2016-2025. 65

Figure 23 – Other Latin America Explosives & Weapons Detection Systems Market Size [$M] by Revenue Segment – 2016-2025. 67

Figure 24 – Other Latin America Explosives & Weapons Detection Systems Market Share [%] by Revenue Segment – 2016-2025. 69

Figure 25- Europe Explosives & Weapons Detection Systems Market [$M] by Vertical Market – 2016-2025. 71

Figure 26 – Europe Explosives & Weapons Detection Systems Market Share [%] by Vertical Market – 2016-2025. 73

Figure 27 – Europe Explosives & Weapons Detection Systems Market [$M] by Technology – 2016-2025. 74

Figure 28 – Europe Explosives & Weapons Detection Systems Market Share [%] by Technology – 2016-2025. 76

Figure 29 – Europe Explosives & Weapons Detection Systems Market [$M] by Country – 2016-2025. 78

Figure 30 – U.K. Explosives & Weapons Detection Systems Market Size [$M] by Revenue Segment – 2016-2025. 80

Figure 31 – U.K. Explosives & Weapons Detection Systems Market Share [%] by Revenue Segment – 2016-2025. 82

Figure 32 – Sweden Explosives & Weapons Detection Systems Market Size [$M] by Revenue Segment – 2016-2025. 84

Figure 33 – Sweden Explosives & Weapons Detection Systems Market Share [%] by Revenue Segment – 2016-2025. 86

Figure 34 – Denmark Explosives & Weapons Detection Systems Market Size [$M] by Revenue Segment – 2016-2025. 88

Figure 35 – Denmark Explosives & Weapons Detection Systems Market Share [%] by Revenue Segment – 2016-2025. 90

Figure 36 – Netherlands Explosives & Weapons Detection Systems Market Size [$M] by Revenue Segment – 2016-2025. 92

Figure 37 – Netherlands Explosives & Weapons Detection Systems Market Share [%] by Revenue Segment – 2016-2025. 94

Figure 38 – Belgium Explosives & Weapons Detection Systems Market Size [$M] by Revenue Segment – 2016-2025. 96

Figure 39 – Belgium Explosives & Weapons Detection Systems Market Share [%] by Revenue Segment – 2016-2025. 98

Figure 40 – Germany Explosives & Weapons Detection Systems Market Size [$M] by Revenue Segment – 2016-2025. 100

Figure 41 – Germany Explosives & Weapons Detection Systems Market Share [%] by Revenue Segment – 2016-2025. 102

Figure 42 – France Explosives & Weapons Detection Systems Market Size [$M] by Revenue Segment – 2016-2025. 104

Figure 43 – France Explosives & Weapons Detection Systems Market Share [%] by Revenue Segment – 2016-2025. 106

Figure 44 – Spain Explosives & Weapons Detection Systems Market Size [$M] by Revenue Segment – 2016-2025. 108

Figure 45 – Spain Explosives & Weapons Detection Systems Market Share [%] by Revenue Segment – 2016-2025. 110

Figure 46 – Italy Explosives & Weapons Detection Systems Market Size [$M] by Revenue Segment – 2016-2025. 112

Figure 47 – Italy Explosives & Weapons Detection Systems Market Share [%] by Revenue Segment – 2016-2025. 114

Figure 48 – Austria Explosives & Weapons Detection Systems Market Size [$M] by Revenue Segment – 2016-2025. 116

Figure 49 – Austria Explosives & Weapons Detection Systems Market Share [%] by Revenue Segment – 2016-2025. 118

Figure 50 – Czech Republic Explosives & Weapons Detection Systems Market Size [$M] by Revenue Segment – 2016-2025. 120

Figure 51 – Czech Republic Explosives & Weapons Detection Systems Market Share [%] by Revenue Segment – 2016-2025. 122

Figure 52 – Poland Explosives & Weapons Detection Systems Market Size [$M] by Revenue Segment – 2016-2025. 124

Figure 53 – Poland Explosives & Weapons Detection Systems Market Share [%] by Revenue Segment – 2016-2025. 126

Figure 54 – Russia Explosives & Weapons Detection Systems Market Size [$M] by Revenue Segment – 2016-2025. 128

Figure 55 – Russia Explosives & Weapons Detection Systems Market Share [%] by Revenue Segment – 2016-2025. 130

Figure 56 – Other European Countries Explosives & Weapons Detection Systems Market Size [$M] by Revenue Segment – 2016-2025. 132

Figure 57 – Other European Countries Explosives & Weapons Detection Systems Market Share [%] by Revenue Segment – 2016-2025. 134

Figure 58- Middle East & Africa Explosives & Weapons Detection Systems Market [$M] by Vertical Market – 2016-2025. 136

Figure 59 – Middle East & Africa Explosives & Weapons Detection Systems Market Share [%] by Vertical Market – 2016-2025. 138

Figure 60 – Middle East & Africa Explosives & Weapons Detection Systems Market [$M] by Technology – 2016-2025. 139

Figure 61 – Middle East & Africa Explosives & Weapons Detection Systems Market Share [%] by Technology – 2016-2025. 141

Figure 62 – MEA Explosives & Weapons Detection Systems Market [$M] by Country – 2016-2025. 143

Figure 63 – Turkey Explosives & Weapons Detection Systems Market Size [$M] by Revenue Segment – 2016-2025. 144

Figure 64 – Turkey Explosives & Weapons Detection Systems Market Share [%] by Revenue Segment – 2016-2025. 146

Figure 65 – Israel Explosives & Weapons Detection Systems Market Size [$M] by Revenue Segment – 2016-2025. 148

Figure 66 – Israel Explosives & Weapons Detection Systems Market Share [%] by Revenue Segment – 2016-2025. 150

Figure 67 – Saudi Arabia Explosives & Weapons Detection Systems Market Size [$M] by Revenue Segment – 2016-2025. 152

Figure 68 – Saudi Arabia Explosives & Weapons Detection Systems Market Share [%] by Revenue Segment – 2016-2025. 154

Figure 69 – UAE Explosives & Weapons Detection Systems Market Size [$M] by Revenue Segment – 2016-2025. 156

Figure 70 – UAE Explosives & Weapons Detection Systems Market Share [%] by Revenue Segment – 2016-2025. 158

Figure 71 – Qatar Explosives & Weapons Detection Systems Market Size [$M] by Revenue Segment – 2016-2025. 160

Figure 72 – Qatar Explosives & Weapons Detection Systems Market Share [%] by Revenue Segment – 2016-2025. 162

Figure 73 – Kuwait Explosives & Weapons Detection Systems Market Size [$M] by Revenue Segment – 2016-2025. 164

Figure 74 – Kuwait Explosives & Weapons Detection Systems Market Share [%] by Revenue Segment – 2016-2025. 166

Figure 75 – Iraq Explosives & Weapons Detection Systems Market Size [$M] by Revenue Segment – 2016-2025. 168

Figure 76 – Iraq Explosives & Weapons Detection Systems Market Share [%] by Revenue Segment – 2016-2025. 170

Figure 77 – Nigeria Explosives & Weapons Detection Systems Market Size [$M] by Revenue Segment – 2016-2025. 172

Figure 78 – Nigeria Explosives & Weapons Detection Systems Market Share [%] by Revenue Segment – 2016-2025. 174

Figure 79 – South Africa Explosives & Weapons Detection Systems Market Size [$M] by Revenue Segment – 2016-2025. 176

Figure 80 – South Africa Explosives & Weapons Detection Systems Market Share [%] by Revenue Segment – 2016-2025. 178

Figure 81 – Other MEA Countries Explosives & Weapons Detection Systems Market Size [$M] by Revenue Segment – 2016-2025. 180

Figure 82 – Other MEA Countries Explosives & Weapons Detection Systems Market Share [%] by Revenue Segment – 2016-2025. 182

Figure 83- Asia-Pacific Explosives & Weapons Detection Systems Market [$M] by Vertical Market – 2016-2025. 184

Figure 84 – Asia-Pacific Explosives & Weapons Detection Systems Market Share [%] by Vertical Market – 2016-2025. 186

Figure 85 – Asia-Pacific Explosives & Weapons Detection Systems Market [$M] by Technology – 2016-2025. 187

Figure 86 – Asia-Pacific Explosives & Weapons Detection Systems Market Share [%] by Technology – 2016-2025. 189

Figure 87 – APAC Explosives & Weapons Detection Systems Market [$M] by Country – 2016-2025. 191

Figure 88 – Azerbaijan Explosives & Weapons Detection Systems Market Size [$M] by Revenue Segment – 2016-2025. 193

Figure 89 – Azerbaijan Explosives & Weapons Detection Systems Market Share [%] by Revenue Segment – 2016-2025. 195

Figure 90 – Kazakhstan Explosives & Weapons Detection Systems Market Size [$M] by Revenue Segment – 2016-2025. 197

Figure 91 – Kazakhstan Explosives & Weapons Detection Systems Market Share [%] by Revenue Segment – 2016-2025. 199

Figure 92 – Pakistan Explosives & Weapons Detection Systems Market Size [$M] by Revenue Segment – 2016-2025. 201

Figure 93 – Pakistan Explosives & Weapons Detection Systems Market Share [%] by Revenue Segment – 2016-2025. 203

Figure 94 – India Explosives & Weapons Detection Systems Market Size [$M] by Revenue Segment – 2016-2025. 205

Figure 95 – India Explosives & Weapons Detection Systems Market Share [%] by Revenue Segment – 2016-2025. 207

Figure 96 – China Explosives & Weapons Detection Systems Market Size [$M] by Revenue Segment – 2016-2025. 209

Figure 97 – China Explosives & Weapons Detection Systems Market Share [%] by Revenue Segment – 2016-2025. 211

Figure 98 – Taiwan Explosives & Weapons Detection Systems Market Size [$M] by Revenue Segment – 2016-2025. 213

Figure 99 – Taiwan Explosives & Weapons Detection Systems Market Share [%] by Revenue Segment – 2016-2025. 215

Figure 100 – South Korea Explosives & Weapons Detection Systems Market Size [$M] by Revenue Segment – 2016-2025. 217

Figure 101 – South Korea Explosives & Weapons Detection Systems Market Share [%] by Revenue Segment – 2016-2025. 219

Figure 102 – Japan Explosives & Weapons Detection Systems Market Size [$M] by Revenue Segment – 2016-2025. 221

Figure 103 – Japan Explosives & Weapons Detection Systems Market Share [%] by Revenue Segment – 2016-2025. 223

Figure 104 – Singapore Explosives & Weapons Detection Systems Market Size [$M] by Revenue Segment – 2016-2025. 225

Figure 105 – Singapore Explosives & Weapons Detection Systems Market Share [%] by Revenue Segment – 2016-2025. 227

Figure 106 – Malaysia Explosives & Weapons Detection Systems Market Size [$M] by Revenue Segment – 2016-2025. 229

Figure 107 – Malaysia Explosives & Weapons Detection Systems Market Share [%] by Revenue Segment – 2016-2025. 231

Figure 108 – Indonesia Explosives & Weapons Detection Systems Market Size [$M] by Revenue Segment – 2016-2025. 233

Figure 109 – Indonesia Explosives & Weapons Detection Systems Market Share [%] by Revenue Segment – 2016-2025. 235

Figure 110 – Australia Explosives & Weapons Detection Systems Market Size [$M] by Revenue Segment – 2016-2025. 237

Figure 111 – Australia Explosives & Weapons Detection Systems Market Share [%] by Revenue Segment – 2016-2025. 239

Figure 112 – Other APAC Countries Explosives & Weapons Detection Systems Market Size [$M] by Revenue Segment – 2016-2025. 241

Figure 113 – Other APAC Countries Explosives & Weapons Detection Systems Market Share [%] by Revenue Segment – 2016-2025

Volume 4 – List of Figures

Figure 1 – U.S. Federal Homeland Security Organogram.. 22

Figure 2 – Department of Homeland Security –Organizational Structure. 24

Figure 3 – Canada Homeland Security & Public Safety Agencies Organogram.. 56

Figure 4 – Canada Aviation Security Infrastructure. 59

Figure 5 – Canada Aviation Security: Key Data. 59

Figure 6 – Canada Aviation Security Mandated Activities. 60

Figure 7 – Canadian Air-Cargo Security Screening Process. 61

Figure 8 – Mexico Homeland Security & Public Safety Agencies Organogram.. 72

Figure 9 – Brazil Homeland Security & Public Safety Agencies Organogram.. 88

Figure 10 – Percentage of UK Muslim Population Vs. Other EU Countries. 109

Figure 11 – UK Homeland Security & Public Safety Agencies Organogram.. 116

Figure 12 – Police Officers 31 March 2006 to 2015, England and Wales. 119

Figure 13 – Allocation of MI5 Resources by Core Activity (2015) 124

Figure 14 – UK Aviation Security Layers. 128

Figure 15 – A UK Airport Security Process. 129

Figure 16 – UK 2015 Passengers Share [%] by Airport 131

Figure 17 – Percentage of France Muslim Population Vs. Other EU Countries. 135

Figure 18 – France Counter Terror & Public Safety Agencies Organogram.. 139

Figure 19 – France Aviation Security Layers. 149

Figure 20 – France Borders. 155

Figure 21 – Netherlands Counter Terror & Public Safety Agencies Organogram.. 160

Figure 22 – Belgium Counter Terror & Public Safety Agencies Organogram.. 177

Figure 23 – The Balkan Migration Route to Germany. 195

Figure 24 – Percentage of Germany Muslim Population in Germany Vs. Other EU Countries  208

Figure 25 – Main Migrant Routes to Germany. 211

Figure 26 – Germany Homeland Security & Public Safety Agencies Organogram.. 213

Figure 27 – Italy Homeland Security & Public Safety Agencies Organogram.. 231

Figure 28 – Spain Homeland Security & Public Safety Agencies Organogram.. 237

Figure 29 – Turkey Homeland Security & Public Safety Agencies Organogram.. 263

Figure 30 – Israel West Bank Separation Barrier 271

Figure 31 – Israel Homeland Security & Public Safety Agencies Organogram.. 276

Figure 32 – Three Tiers of Saudi Security Infrastructure. 287

Figure 33 – Saudi Government Security Organogram.. 289

Figure 34 – UAE Homeland Security & Public Safety Agencies Organogram.. 317

Figure 35 – Dubai Police Organization Chart 319

Figure 36 – India Homeland Security & Public Safety Agencies Organogram.. 362

Figure 37 – China Homeland Security & Public Safety Agencies Organogram.. 379

Figure 38 – South Korea Homeland Security & Public Safety Agencies Organogram   396

Figure 39 – Japan Security & Public Safety Agencies Organogram.. 403

Figure 40 – Australia Homeland Security & Public Safety Agencies Organogram.. 411

Figure 41 – Indonesia Homeland Security & Public Safety Agencies. 448

Volume 5 – List of Figures

Figure 1 – Explosives Classification Tree. 15

Figure 2 – Explosive Train.. 16

Figure 3 – Black Powder 17

Figure 4 – Smokeless Powder 17

Figure 5 – Nitrocellulose. 18

Figure 6 – Flash Powder 18

Figure 7 – High Explosives Tree. 19

Figure 8 – Lead Azide. 20

Figure 9 – Lead Styphnate. 20

Figure 10 – Mercury Fulminate Salt 20

Figure 11 – Diazodinitrophenol (DDNP) 21

Figure 12 – Pentaerythrite Tetranitrate (PETN) 22

Figure 13 – Cyclotrimethylenetrinitramine (RDX) 22

Figure 14 – Dynamite (EGDN) 23

Figure 15 – Plastic Bottles Containing Unidentified Binary Explosives. 23

Figure 16 – Water Gel in a Glass Bubble Sensitizer 24

Figure 17 – Tubes of Emulsion Explosives. 24

Figure 18 – Yellow TNT Solids. 25

Figure 19 – Ammonium Nitrate and Fuel Oil (ANFO) 25

Figure 20 – Dinitrotoluene (DNT) 25

Figure 21 – High Melting Point Explosive (HMX) 26

Figure 22 – Hexamethylene Triperoxide Diamine (HMTD) 27

Figure 23 -TATP (Crude and Dry) and Preparation Ingredients. 27

Figure 24 – Explosive Materials Classification. 29

Figure 25 – Major Explosives Detection Technologies: Bulk vs. Trace. 31

Figure 26 – X-ray Conveyor-Based Screening Systems – Principles of Operation.. 34

Figure 27 – Conventional X-ray. 38

Figure 28 – Dual Energy X-ray. 39

Figure 29 – Material Differentiation by Dual Energy X-ray. 40

Figure 30 – Dual Energy Z Map. 41

Figure 31 – Quasi-Dual Energy X-ray. 41

Figure 32 – Variable View X-ray Option.. 42

Figure 33 – Multi-View Dual Energy X-ray Explosives & Weapons Screening. 43

Figure 34 – Convectional 2D Image (Left) vs. Quasi 3D Image (Right) 43

Figure 35 – The Rapiscan 620DV AT – Dual View Advanced Technology
X-ray System.. 45

Figure 36 – Smiths Detection HI-SCAN 6040aX.. 46

Figure 37 – Backscatter Cargo Screening X-ray. 47

Figure 38 – MMwave AIT. 48

Figure 39- MMwave VS. X-Ray AIT Systems. 48

Figure 40 – Dose Comparison : Environmental Radiation vs. Backscatter AIT Scan.. 49

Figure 41 – AIT Screening Procedure. 50

Figure 42 – Coherent X-ray Scheme. 51

Figure 43 – Cast and Artificial Limbs Screening System.. 52

Figure 44 – A Prosthetic Limbs Backscatter Image Showing a Gun Hidden  Underneath a Cast 53

Figure 45 – Rapiscan Mobile Check ES002 Contains Two Screening Lanes a Mobile Container. 53

Figure 46 – Global Risks Landscape 2017. 58

Figure 47 – Top Global Risks by Impact and Likelihood. 59

Figure 48 – The Global Risks Interconnections Map. 60

Figure 49 – Global Risks: A Regional Perceptive – Most Likely Global Risk. 61

Figure 50 – Spectrum of Evolving PBIED, VBIED & IED Detection Technologies. 63

Figure 51 – Standoff Electromagnetic Concealed Weapons Detection.. 64

Figure 52 – Magnetic Signature Analysis System: Functional Block Diagram.. 65

Figure 53 – Covert MMWave Sensor at a Door 66

Figure 54 – Screening of Hand-held Baggage. 66

Figure 55 – Focal Plane Array Passive Standoff MMWave System.. 67

Figure 56 – A Walk-by Passive MMWave Imaging System.. 67

Figure 57 – Covert Walk-by Passive MMWave Images. 68

Figure 58 – Example of FTIR Application at Border Checkpoint Facilities. 70

Figure 59 – Biometric PBIED Detection Corridor 71

Figure 60 – Field of View of a Fused Video Surveillance and Biometrics. 72

Figure 61 – Active MMWave HSR Bi-portal 73

Figure 62 – Active MMWave HSR Bi-Portal on Mass Transit Object 74

Figure 63 – Automatic PBIED Detection of Multiple Persons, Test Ground. 75

Figure 64 – Cobham Antenna Systems Standoff IED, PVIED & VBIED UGV IED Detection System.. 86

Figure 65 – Cobham Antenna Systems Standoff IED, PVIED & VBIED UGV IED Detection Operation.. 87

Figure 66 – IAI CIMS System.. 88

Figure 67 – IAI CIMS System Performance. 89

Figure 68 – Multi-Modal Fused Standoff Explosives Detection System.. 91

Figure 69 – The CounterBomber® System.. 93

Figure 70 – Atmospheric Transmission Windows of Electromagnetic Radiation.. 97

Figure 71 – Active Standoff MMWave Imaging Technologies Using Separate and Integrated Sources of Scene Illumination. 98

Figure 72 – Standoff Open Space Threat Detection.. 99

Figure 73 – Active Standoff MMWave Imaging Experiment 100

Figure 74 – A Passive MMWave Imager 101

Figure 75 – Standoff MMWave Technology Used in a Tactical  Checkpoint Environment 103

Figure 76 – Passive MM-Wave Image of a Person with a Concealed Weapon.. 104

Figure 77 – CCTV, IR & MMWave Images. 105

Figure 78 – PMC-2 Imager, System Architecture. 105

Figure 79 – PMC-2 Imager System Flowchart 106

Figure 80 – Standoff Infrared Radiation Measurement from a Human.. 109

Figure 81 – Open-Path FTIR Method. 110

Figure 82 – The Electromagnetic Spectrum Showing the THz-Region.. 111

Figure 83 – “Terahertz Fingerprints” of Explosives. 112

Figure 84 – “Terahertz Fingerprints” of Clothing. 112

Figure 85 – Ceiling Mounted Standoff Passive Terahertz Imager 113

Figure 86 – Illustration of a Terahertz Standoff Imaging System at 50m Target Distance  113

Figure 87 – Basic Terahertz Standoff Person-borne Explosives & Weapon Detection Technology Concept 114

Figure 88 – Block Diagram of Frequency Modulate Continuous Wave  (FMCW) RADAR   116

Figure 89 – The Sub MMWave Multiplier and Mixer 117

Figure 90 – Radar Photograph and Optics Schematic. 117

Figure 91 – Active Terahertz Concealed Explosives & Weapons  Standoff Detection   117

Figure 92 – A Standoff Passive Terahertz Weapons and Explosives System.. 120

Figure 93 – Short Range Standoff Vehicle-Borne Explosives Detection Setup. 121

Figure 94 – Vapor Pressure of Important Explosives. 122

Figure 95 – LIBS Principle of Operation.. 124

Figure 96 – Standoff Laser-Induced Breakdown Spectroscopy Real-time Explosive Detection   125

Figure 97 – LIBS Emission Temporal Resolution as a Tool to Discriminate Between Different Explosives. 126

Figure 98 – Absorbance Spectra of Various Explosives and Tuning Range  of External Cavity Quantum Cascade Laser Source. 130

Figure 99 – PLP/LIF Technology: Principle of Operation.. 131

Figure 100 – Fluorescence Energy Levels. 131

Figure 101 – Micro Raman Spectroscopy. 133

Figure 102 – Example of Raman Spectroscopy Systems. 134

Figure 103 – Comparison of Excitation Wavelengths for TNT. 136

Figure 104 – Comparison Between 4- Nitrotoluene & 2,4,6-Trinitrotoluene. 136

Figure 105 – Some LIDAR Measurement Techniques Distances are not Applicable to Explosives. 138

Figure 106 – Apex Checkpoint of the Future. 142

Figure 107 – TSA RDT&E Strategic Vision.. 143

Figure 108 – The 2D X-ray Performance Criteria. 144

Figure 109 – Remote Cargo Tele-Screening. 145

Figure 110 – World Passenger Traffic vs. GDP.. 191

Figure 111 – RPK Traffic by Airline Domicile [Billions] 192

Figure 112 – Single Queue Serving Multiple Explosives & Weapons Detection Security Checkpoints. 195

Figure 113 – A Single Queue Serving Multiple Screening Positions. 195

Figure 114 – Two Single Lanes Serving Multiple Screening Positions. 196

Figure 115 – Separated Lines in Single Queue Serving Multiple Screening Positions  196

Figure 116 – Checkpoint Staff Allocation.. 197

Figure 117 – Big Data Technology Platforms and Solutions Ecosystem.. 226

Figure 118 – Big Data Collection and Analysis Flow Chart 227

Figure 119 – Digital vs. Analog Forms of Data. 228

Figure 120 – Data Exploration Vs. Machine Learning Model 231


Questions about this report?

Contact Sales: 1-571-527-1010 or Analysts: 1-202-455-0966

  • Have a question about Explosives & Weapons Detection Systems Market, Technologies & Industry - 2020-2025
    Please fill out all fields in the form below and click "Submit" to send your question.
    Our representative will review your question and contact you with an answer as soon as possible.
  • 2+2=
  • This field is for validation purposes and should be left unchanged.
1
Interested in this report? Need more information?

You may also like…

X
Powered By