Top
HSRCWeapons & Explosives Detection Markets in Europe – 2017-2022
Placeholder

Weapons & Explosives Detection Markets in Europe - 2017-2022

Market Surge Forecast: 2015-2020 CAGR: 20.2%. Granulated Into 51 Submarkets

  • May 2017 Edition
  • 254
  • 126
    • 4450 $
    • 5450 $
    • 6950 $
    • 10000 $

    Small Businesses, Startups & Academia - Up to 50% Off

Quantity
IBM
Amazon
Sandia National Lab
HITACHI
Thales
Smiths Detection
Nuctech
Korea Internet & Security Agency
L3Harris
Huawei
Leidos
NEC
Toshiba
Deloitte
MAG

Want to customize this report?

If you purchase this report, you are entitled to a 30% discount towards customizing it, to better fit your market research and strategic needs. Our Custom Research and Industry Insights Department will work with you to better understand your information gaps and strategic needs and will provide you with a tailor-made market research report within a short period of time.

Why Choose Us?

30+ Years of Experience
We are a multidisciplinary team of Transformational Technologies industry experts with over 30 years of experience.
Gold Standard
With over 950 private sector clients (73% repeat customers), including major defense and security vendors, and Forbes Global 2000 companies, HSRC earned the reputation as the industry’s Gold Standard for Transformational Technologies Market Reports.
Tailored Research Services
Provide you with clear, actionable recommendations designed to empower decision making and to help you exploit emerging opportunities in the Transformational Technologies industries.
Information Security
Your personal information is safe and secure.

From: $4,450

SKU: 8752 Category:

Description

European Explosives & Weapons Detection Technologies Market - 2016-2022

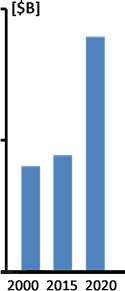
European Explosives & Weapons Detection Technologies Market [$B] 2000, 2015 & 2020

The explosives detection and weapon detection market will grow at a CAGR of 20.2% in 2015-2020, a 5-fold hike from the 3.9% CAGR during 2000-2015. Europe is facing a surge of ISIS-inspired explosives and weapon borne terror attacks and threats representing challenges with a far greater reach than their economic ones. This issue impacts airport security, stadium security, public transportation security and other safety measures in populated areas. This alarming situation shows no signs of declining. Europeans are experiencing a new disturbing reality in which explosives and weapon borne terror is their “new normal”. An increase in orders for weapon and explosives detection products had already commenced after the November 2015 Paris carnage (e.g., France manufacturers of weapon detectors reported a 300% sales hike after the Paris carnage).

Based on 6 months of the “Europe’s Terror & Migration Crisis Series” research, and over 110 face-to-face interviews and analyses, we forecast that the 2015-2020 market will grow at a CAGR of 20.2%, a 5-fold hike from the 3.9% CAGR during 2000-2015. Such a growth rate has not been seen in the European market since the 2002-2008 years, following 9/11.

The “European Explosives & Weapons Detection Technologies Market Forecast – 2017-2022” report + the bonus* “Global Homeland Security & Public Safety Industry – 2016 Edition” report are the only comprehensive reviews of the market available today. The objective of this study is to provide a detailed, time-sensitive and reasoned intelligence report.

European Explosives & Weapons Detection Technologies Market - 2016-2022

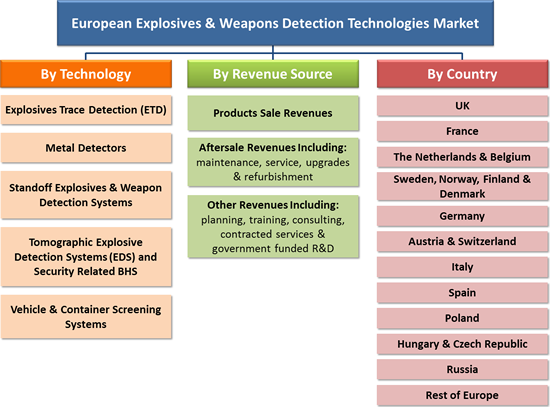
European Explosives & Weapons Detection Technologies Market Report Core Submarkets

The explosives detection market will undergo a major transformation from 2016-2022 through the following drivers:

  • The ISIS-inspired complex and well-planned Paris and Brussels carnage (162 killed and 668 injured) sent shockwaves across the continent.
  • The jihadists used both military grade weapons as well as hard-to-detect homemade improvised explosives (i.e. TATP) which pose a threat to existing weapon detection measures
  • The attacks shook the European governments and their security agencies unlike any other terror attacks since 9/11, paving the way to new strategies regarding explosives detection capabilities and needs
  • The west European security forces are ill-equipped in terms of weapon detection and explosives detection to encounter 21st century ISIS-inspired and trained terrorists who use hard-to-detect improvised explosives, cutting-edge encrypted communication, make a remarkable use of social networks to recruit and train jihadists and conduct efficient pre-attack intelligence.
  • European security bodies will have to replace or upgrade their explosive screening systems to new systems capable of detecting improvised explosives like those used in Paris and Brussels (e.g., TATP).
  • With no “Magic Bullet” technology in sight, the challenge that remains unresolved is to find out how to stop terrorists from detonating explosives in crowded, unscreened public areas.
  • The terrorists were trained by ISIS ex-Iraqi military officers on planning and conducting modern day guerrilla warfare. Europol estimates that up to 5,000 European jihadists have returned to the EU after obtaining combat experience on the battlefields of the Middle East.
  • The EU and most of the rest of the European market for homeland security and public safety products are served by local companies. Even with a preference for locally manufactured products, foreign products can usually strongly compete on the basis of cost-performance. They do not encounter any EU direct trade barriers or quotas. Non-tariff, indirect trade barriers may be the approval process of dual use goods, which include many security market products.

This report is a resource for executives with interests in the market. It has been explicitly customized for the security industry and government decision-makers in order to enable them to identify business opportunities, developing technologies, market trends and risks, as well as to benchmark business plans.

Questions answered in this 254-page report + one* report include:

  • What will the market size and trends be during 2016-2022?
  • Which submarkets provide attractive business opportunities?
  • Who are the decision-makers?
  • What drives the customers to purchase solutions and services?
  • What are the customers looking for?
  • What are the present and pipeline technologies?
  • What is the market SWOT (Strengths, Weaknesses, Opportunities & Threats)?
  • What are the challenges to market penetration & growth?

With 254 pages, 40 tables and 86 figures, this report + one* report covers 12 Countries and Regions 5 technologies and 3 revenue source submarkets, offering for each of them 2015 data and assessments, and 2016-2022 forecasts and analyses.

Why Buy this Report?

A. A. Market data and forecast on weapon and explosives detection is analyzed via 3 key independent perspectives:

With a highly fragmented market we address the “money trail” – each dollar spent – via the following 3 viewpoints:

  • By 12 Country Markets including:
    1. UK
    2. France
    3. The Netherlands & Belgium
    4. Sweden, Norway, Finland & Denmark
    5. Germany
    6. Austria & Switzerland
    7. Italy
    8. Spain
    9. Poland
    10. Hungary & Czech Republic
    11. Russia
    12. Rest of Europe
  • By 3 Revenue Sources including:
    1. Weapon and explosives detection Products Sales Revenues
    2. After Sale Revenues Including: Maintenance, Service, Upgrades & Refurbishment
    3. Other Revenues Including: Planning, Training, Consulting, Contracted Services & Government Funded R&D
  • By 5 Technology Markets including:
    1. Explosives Trace Detection (ETD)
    2. Metal Detectors
    3. Standoff Explosives & Weapon Detection Systems
    4. Tomographic Explosive Detection Systems (EDS) & Security related BHS
    5. Vehicle & Container Screening Systems

B. Detailed market analysis frameworks for the market sectors, including:

  1. Market drivers & inhibitors
  2. Business opportunities
  3. SWOT analysis
  4. Competitive analysis
  5. Business environment

C. The report discusses directly or indirectly the following current and pipeline technologies:

  1. Backscatter X-Ray Container-Vehicle Screening Systems
  2. Coherent Scatter 2D X-Ray Systems
  3. Desktop ETD Devices
  4. Hand Held ETD Devices
  5. Dual Energy LINAC X-Ray Container-Vehicle Screening Systems
  6. Dual-View LINAC X-Ray Container-Vehicle Screening Systems
  7. Gamma Ray Systems Container-Vehicle Screening Systems
  8. Hybrid Tomographic EDS & 2D X-Ray Screening
  9. IED Placement Detection
  10. Ion Mobility Spectroscopy (IMS) technologies
  11. Liquid Explosives Detection Devices
  12. Luggage, Baggage & Mail Screening Systems
  13. Metal detection Portals
  14. Multimodal Biometric Systems
  15. Narcotics Trace Detection Devices
  16. Natural & Manmade Disaster Early Warning systems
  17. People Screening MMWave (AIT) Portals
  18. People Screening X-Ray Backscatter (AIT) Portals
  19. Shoe Scanners
  20. Standoff Explosives & Weapon Detection Systems
  21. Standoff Suicide Bombers Detection
  22. Suicide Bombers Borne IED (PBIED) Detectors
  23. Suicide Bombers Detonation Neutralization
  24. Tomographic Explosive Detection Systems (EDS)
  25. Transportable X-Ray Screening Checkpoints
  26. VBIED Detonation Neutralization
  27. Vehicle & Container Screening Systems
  28. Vehicle Borne IED (VBIED) Detectors
  29. Vehicle Screening ETD Systems
  30. X-Ray Container-Vehicle Screening Systems
  31. X-ray Screening systems

D. The report includes the following 4 appendices:

  1. Appendix A: European Homeland Security & Public Safety Related Product Standards
  2. Appendix B: The European Union Challenges and Outlook
  3. Appendix C: Europe Migration Crisis & Border Security
  4. Appendix D: Abbreviations

E. The report addresses over 300 European Homeland Security and Public Safety standards (including links)

F. The supplementary* “Homeland Security and Public Safety Industry – 2016 Edition” report provides the following insights and analysis of the industry including:

  • The Global Industry 2016 status
  • Effects of Emerging Technologies on the Industry
  • The Market Trends
  • Vendor – Government Relationship
  • Geopolitical Outlook 2016-2022
  • The Industry Business Models & Strategies
  • Market Entry Challenges
  • The Industry: Supply-Side & Demand-Side Analysis
  • Market Entry Strategies
  • Price Elasticity
  • Past Mergers & Acquisitions (M&A) Events

G. The supplementary* “Global Homeland Security and Public Safety Industry – 2016 Edition” report provides a May 2016 updated extensive data (including Company Profile, Recent Annual Revenues, Key Executives, homeland Security and Public Safety Products, and Contact Info.) of the leading 119 Homeland Security and Public Safety Vendors including:

  1. 3M
  2. 3i-MIND
  3. 3VR
  4. 3xLOGIC
  5. ABB
  6. Accenture
  7. ACTi Corporation
  8. ADT Security Services
  9. AeroVironment Inc.
  10. Agent Video Intelligence
  11. Airbus Defence and Space
  12. Alcatel-Lucent (Nokia Group)
  13. ALPHAOPEN
  14. American Science & Engineering Inc.
  15. Anixter
  16. Aralia Systems
  17. AT&T Inc.
  18. Augusta Systems
  19. Austal
  20. Avigilon Corporation
  21. Aware
  22. Axis
  23. AxxonSoft
  24. Ayonix
  25. BAE Systems
  26. BioEnable Technologies Pvt Ltd.
  27. BioLink Solutions
  28. Boeing
  29. Bollinger Shipyards, Inc
  30. Bosch Security Systems
  31. Bruker Corporation
  32. BT
  33. Camero
  34. Cassidian
  35. CelPlan
  36. China Security & Surveillance, Inc.
  37. Cisco Systems
  38. Citilog
  39. Cognitec Systems GmbH
  40. Computer Network Limited (CNL)
  41. Computer Sciences Corporation
  42. CrossMatch
  43. Diebold
  44. DRS Technologies Inc.
  45. DVTel
  46. Elbit Systems Ltd.
  47. Elsag Datamat
  48. Emerson Electric
  49. Ericsson
  50. ESRI
  51. FaceFirst
  52. Finmeccanica SpA
  53. Firetide
  54. Fulcrum Biometrics LLC
  55. G4S
  56. General Atomics Aeronautical Systems Inc.
  57. General Dynamics Corporation
  58. Getac Technology Corporation
  59. Hanwha Techwin
  60. Harris Corporation
  61. Hewlett Packard Enterprise
  62. Hexagon AB
  63. Honeywell International Inc.
  64. Huawei Technologies Co., Ltd.
  65. IBM
  66. IndigoVision
  67. Intel Security
  68. IntuVision Inc
  69. iOmniscient
  70. IPConfigure
  71. IPS Intelligent Video Analytics
  72. Iris ID Systems, Inc.
  73. IriTech Inc.
  74. Israel Aerospace Industries Ltd.
  75. ISS
  76. L-3 Security & Detection Systems
  77. Leidos, Inc.
  78. Lockheed Martin Corporation
  79. MACROSCOP
  80. MDS
  81. Mer group
  82. Milestone Systems A/S
  83. Mirasys
  84. Motorola Solutions, Inc.
  85. National Instruments
  86. NEC Corporation
  87. NICE Systems
  88. Northrop Grumman Corporation
  89. Nuance Communications, Inc.
  90. ObjectVideo
  91. Panasonic Corporation
  92. Pelco
  93. Pivot3
  94. Proximex
  95. QinetiQ Limited
  96. Rapiscan Systems, Inc.
  97. Raytheon
  98. Rockwell Collins, Inc.
  99. Safran S.A.
  100. Salient Sciences
  101. Schneider Electric
  102. SeeTec
  103. Siemens
  104. Smart China (Holdings) Limited
  105. Smiths Detection Inc.
  106. Sony Corp.
  107. Speech Technology Center
  108. Suprema Inc.
  109. Synectics Plc
  110. Tandu Technologies & Security Systems Ltd.
  111. Texas Instruments
  112. Textron Inc.
  113. Thales Group
  114. Total Recall
  115. Unisys Corporation
  116. Verint
  117. Vialogy LLC
  118. Vigilant Technology
  119. Zhejiang Dahua Technology

Table of Contents

Download TOC as PDF

1 Europe’s Terror & Migration Crisis: Key Findings
2 Europe’s Terror & Migration Crisis: Key Conclusions
3 European Explosives Trace Detection (ETD) Market – 2016-2022
3.1 European Explosives Trace Detection: Major Findings
3.2 European Explosives Trace Detection: Major Conclusions
3.3 ETD Technologies and Market Background
3.3.1 ETD Background
3.3.2 Ion Mobility Spectroscopy (IMS)
3.3.3 Current Explosives & Narcotics Detection Technologies Map
3.3.4 ETD vs. Bulk Explosives & Narcotics Detection: Pros & Cons
3.3.5 Handheld and Desktop ETD
3.3.6 Airport Boarding Gate Explosives Scanners
3.3.7 Vehicle Screening ETD Systems
3.4 Pipeline ETD Technologies
3.4.1 Nanotechnology Explosives and Narcotics Trace Detection: Challenges
3.4.2 Receptor-based ETD
3.4.3 Molecularly Imprinted Polymers Based ETD
3.4.4 Nano-mechanical Sensor Based ETD
3.4.5 Electronic Nose Based ETD
3.4.6 Silica Micro-cantilever Based ETD
3.4.7 Surface Enhanced Raman Scattering Based ETD
3.4.8 Hybrid Nano-sensor Based ETD
3.4.9 Protein Coated Carbon Nanotubes, Nano Based ETD
3.4.10 Piezo-resistive Polymer Cantilever Nano Based ETD
3.4.11 Inkjet Based Wireless Sensor ETD Technology
3.4.12 Amino-silane Coated Nanowires Arrays Based ETD
3.4.13 Free-surface Microfluidic Control of Surface-Enhanced Raman Spectroscopy Based ETD
3.4.14 Trace Chemical Vapor Detection Cartridge
3.4.15 Free Surface Microfluidic Chip
3.4.16 Continuous Pre-concentrator
3.4.17 Raman Chemical Specific Signatures
3.4.18 Molecularly Imprinted Polymers Explosives and Narcotics Detection Kit
3.4.19 Quantum Sniffer™ Portable ETD
3.4.20 Cantilever Nano-Mechanical Sensors
3.4.21 Sensor Array and Neural Network Based ETD
3.4.22 Temperature-stepped Desorption Based ETD
3.4.23 Trace Detection of Nitrogen-Based Explosives with UV-PLF
3.4.24 Non-Contact Explosives and Narcotics Harvesting ETD
3.4.24.1 Non-Contact Harvesting
3.4.24.2 ETD Transport
3.4.24.3 ETD Analysis
3.4.24.4  ETD Reporting
3.4.25 Check Point Explosives and Narcotics Detection System
3.4.26 Trace Detection of Small Molecules by Pulsed-Ultraviolet Laser Raman Spectroscopy
3.4.27 Sensing Trace Amounts of Nitro-Aromatic Explosives and Narcotics Using Nanowire-Nanocluster Hybrids
3.4.28 Detection of Explosives and Narcotics at Trace Levels by Laser-Induced Breakdown Spectroscopy (LIBS)
3.4.29 Universal Explosive Detection System
3.4.30 MEMS-Based Explosive Particle Detection and Remote Particle Stimulation
3.4.31 Laser Vaporization of Trace Explosives and Narcotics for Enhanced Non-Contact Detection
3.4.32 Advanced Materials and Sensor Platforms
3.5 Explosives Trace Detection (ETD): Business Opportunities & Challenges
3.6 Explosives Trace Detection (ETD) Industry: SWOT Analysis
3.6.1 Strengths
3.6.2 Weaknesses
3.6.3 Opportunities
3.6.4 Threats
3.7 European Explosives Trace Detection (ETD) Market – 2015-2022
4 European Metal Detectors Market – 2016-2022
4.1 Metal Detectors Technologies and Market Background
4.1.1 European Metal Detectors Market Background
4.1.2 Hand-Held (HH) Metal Detectors
4.1.3 Single Zone Metal Detection Portals
4.1.4 Multi-Zone Metal Detection Portals
4.1.5 Enhanced (Matrix) Metal Detection Portals
4.2 Major Metal Detector Vendors
4.3 Metal Detectors: Business Opportunities & Challenges
4.4 Metal Detectors Market: SWOT Analysis
4.4.1 Strengths
4.4.2 Weaknesses
4.4.3 Opportunities
4.4.4 Threats
4.5 European Metal Detectors Market – 2015-2022
5 European Standoff Explosives & Weapon Detection Market – 2016-2022
5.1 Market & Technology Background
5.1.1 Suicide Bombers & Vehicle Borne IEDs
5.2 Standoff Explosives & Weapon Detection: Business Opportunities & Challenges
5.2.1 Business Opportunities
5.2.2 PBIED & VBIED Detection: Technological Challenges
5.3 Standoff Person-Borne and Vehicle-Borne Explosives & Weapon Detection SWOT Analysis
5.3.1 Strengths
5.3.2 Weaknesses
5.3.3 Opportunities
5.3.4 Threats
5.4 European Standoff Explosives & Weapon Detection Market – 2015-2022
6 European Tomographic Explosive Detection Systems (EDS) & BHS Market – 2016-2022
6.1 Explosive Detection Systems: Technology Background
6.1.1 Explosive Detection Systems: Throughput
6.1.2 EDS Principle of Operation
6.1.3 Hybrid Tomographic EDS & 2D X-Ray Screening
6.1.4 EDS EU Standard-3 Certification
6.1.5 EDS Throughput vs. Price
6.1.6 Aviation Security: EDS Checked Luggage Screening
6.2 Security-related Airport Baggage Handling Systems (BHS)
6.3 Baggage Handling Systems
6.3.1 High-Volume In-Line Checked Luggage BHS Systems
6.3.2 Checked Luggage BHS: Mini In-Line Checked Luggage Screening System
6.3.3 Stand-alone EDS
6.4 EDS Market Background
6.5 Aviation Security Explosive Detection Systems (EDS) and BHS Industry: SWOT Analysis
6.5.1 Strengths
6.5.2 Weaknesses
6.5.3 Opportunities
6.5.4 Threats
6.6 European Tomographic Explosive Detection Systems & BHS Market – 2015-2022
7 European Vehicle & Container Screening Systems Market – 2016-2022
7.1 Vehicle & Container Screening Portals Technologies
7.1.1 Comparison of Container-Vehicle Screening Technologies
7.1.2 X-Ray Container-Vehicle Screening Systems
7.1.3 Dual Energy X-Ray Container-Vehicle Screening
7.1.4 Dual-View X-Ray Container-Vehicle Screening
7.1.5 Backscatter X-Ray Container-Vehicle Screening
7.1.6 Gamma Ray Systems Container-Vehicle Screening
7.1.7 Linac Based X-Ray Container-Vehicle Screening systems
7.1.8 Neutron Activation Container-Vehicle Screening Systems
7.2 Vehicle & Container Screening Portals: Market Background
7.3 Vehicle & Container Screening Portals Industry: SWOT Analysis
7.3.1 Strengths
7.3.2 Weaknesses
7.3.3 Opportunities
7.3.4 Threats
7.4 European Vehicle & Container Screening Systems Market – 2015-2022
8 European X-Ray Scanners Market – 2016-2022
8.1 X-Ray Screening Technology Background
8.1.1 2D X-Ray, EDS & ETD Explosives Detection Technologies – Pros & Cons
8.1.2 X-Ray Systems – Characteristics
8.2 X-Ray Screening Technologies
8.2.1 Luggage, Baggage & Other Items Screening Technologies
8.2.2 People Screening X-Ray Backscatter (AIT) Technology
8.2.3 Coherent Scatter 2D X-ray
8.2.4 Cast and Artificial Limbs X-ray Backscatter Screening Technologies
8.2.5 Transportable X-RAY Screening Checkpoints
8.2.6 X-ray Technologies: Performance Comparison
8.3 X-Ray Screening Market Background
8.3.1 Airports and Secured Facilities
8.3.2 Europe’s Rail Stations X-Ray Screening
8.3.3 The European Air Cargo Explosive Screening
8.3.3.1 ACES: The European Air Cargo Explosive Screening
8.3.3.2 The European RA3 and ACC3 Regulations
8.4 X-Ray Screening: Business Opportunities & Challenges
8.5 X-Ray Security Industry: SWOT Analysis
8.5.1 Strengths
8.5.2 Weaknesses
8.5.3 Opportunities
8.5.4 Threats
8.6 European X-Ray Scanners Market – 2015-2022
9 European Explosives & Weapons Detection Technologies Market – 2015-2022
9.1 European Explosives & Weapons Detection Technologies Market by Country – 2015-2022
9.1.1 2015 National Markets & 2016-2022 Forecast
9.1.2 Market Dynamics by Country – 2016-2022
9.1.3 Market Breakdown by Country – 2015-2022
9.2 Market by Revenue Source – 2015-2022
9.2.1 2015 Market & 2016-2022 Forecast
9.2.2 Market Dynamics by Revenue Source – 2016-2022
9.2.3 Market Breakdown by Revenue Source – 2015-2022
9.3 UK Explosives & Weapons Detection Technologies Market – 2016-2022
9.4 France Explosives & Weapons Detection Technologies Market – 2016-2022
9.5 Belgium Explosives & Weapons Detection Technologies Market – 2016-2022
9.6 Sweden, Norway, Finland & Denmark: Explosives & Weapons Detection Technologies Market – 2016-2022
9.7 Germany Explosives & Weapons Detection Technologies Market – 2016-2022
9.8 Austria & Switzerland: Explosives & Weapons Detection Technologies Market – 2016-2022
9.9 Italy Explosives & Weapons Detection Technologies Market – 2016-2022
9.1 Spain Explosives & Weapons Detection Technologies Market – 2016-2022
9.11 Poland Explosives & Weapons Detection Technologies Market – 2016-2022
9.12 Hungary & Czech Republic: Explosives & Weapons Detection Technologies Market – 2016-2022
9.13 Russia Explosives & Weapons Detection Technologies Market – 2016-2022
9.14 Rest of Europe: Explosives & Weapons Detection Technologies Market – 2016-2022
10 Appendix A: European Homeland Security & Public Safety Related Product Standards
10.1 European Committee for Standardization (CEN)
10.2 European Homeland Security and Public Safety Standards
10.3 EU Buildings & Perimeter Security Standards & Specifications
11 Appendix B: The European Union Challenges and Outlook
11.1 Summary
11.2 The EU Economy
11.3 Anti-EU Trends
11.4 The EU Frail Leadership and Poor Strategic Vision
11.5 Migration and Refugee Crisis
11.6 European Security Worries
11.7 Terrorism
11.8 EU Future Scenarios
12 Appendix C: Europe Migration Crisis & Border Security
12.1 Introduction
12.2 EU Migration: Background
12.3 The European Borders Security
12.3.1 Introduction
12.3.2 The Schengen Area
12.3.3 The European Integrated Border Management System (IBM)
12.3.4 The EU Smart Borders Initiative
12.3.5 The Schengen Zone: Passenger Name Record (PNR) System Outlook
12.3.6 Temporary Reintroduction of Border Control
12.4 European Smart & Secure Border Market
13 Appendix D: Abbreviations
14 Scope, Methodology & Disclaimer
14.1 Research Scope
14.2 Research Methodology
15 Disclaimer & Copyright

Tables

Table 1 European Population, Muslim-Population, GDP, GDP/Capita and Defense-Budget 2014 Data by 17 Countries
Table 2 European Police Forces, 1st Responders, Airports & Air-Passengers Statistics by Country
Table 3 ETD vs. Bulk Explosives and Narcotics Detection Technologies
Table 4 Quantum Sniffer: Features & Benefits
Table 5 Explosives Trace Detection (ETD) Market: Business Opportunities
Table 6 European Explosives Trace Detection (ETD) Market [$M] and AGR [%] – 2015-2022
Table 7 Metal Detectors Market: Business Opportunities
Table 8 European Metal Detectors Market [$M] and AGR [%] – 2015-2022
Table 9 Comparison of Open Space Explosives & Weapon Detection Technologies
Table 10 PBIED & VBIED Detection Technologies: Performance Criteria
Table 11 European Standoff Explosives & Weapon Detection Market [$M] and AGR [%] – 2015-2022
Table 12 Product Comparison of High-Volume EDS Machines
Table 13 European Tomographic Explosive Detection Systems & BHS Market [$M] and AGR [%] – 2015-2022
Table 14 Container-Vehicle Screening – Technologies Comparison
Table 15 European Vehicle & Container Screening Systems Market [$M] and AGR [%] – 2015-2022
Table 16 EDS, ETD and 2D X-Ray Technologies – Pros and Cons
Table 17 Comparison of X-ray Detection Technologies
Table 18 X-Ray Screening Market: Business Opportunities
Table 19 European X-Ray Scanners Market [$M] and AGR [%] – 2015-2022
Table 20 European Explosives & Weapons Detection Technologies Security Market* [$M] by Country – 2015-2022
Table 21 European Explosives & Weapons Detection Technologies Market* AGRs [%] by Country – 2016-2022
Table 22 European Explosives & Weapons Detection Technologies Market* Shares [%] by Country – 2015-2022
Table 23 European Explosives & Weapons Detection Technologies Security Market [$M] by Revenue Source (Sales, Aftersale and Other Revenues) – 2015-2022
Table 24 European Explosives & Weapons Detection Technologies Market AGRs [%] by Revenue Source – 2016-2022
Table 25 European Explosives & Weapons Detection Technologies Security Market Share [%] by Revenue Source – 2015-2022
Table 26 UK Explosives & Weapons Detection Technologies Market [$M] by Revenue Source – 2015-2022
Table 27 France Explosives & Weapons Detection Technologies Market [$M] by Revenue Source – 2015-2022
Table 28 Belgium Explosives & Weapons Detection Technologies Market [$M] by Revenue Source – 2015-2022
Table 29 Sweden, Norway, Finland & Denmark: Explosives & Weapons Detection Technologies Market [$M] by Revenue Source – 2015-2022
Table 30 Germany Explosives & Weapons Detection Technologies Market [$M] by Revenue Source – 2015-2022
Table 31 Austria & Switzerland: Explosives & Weapons Detection Technologies Market [$M] by Revenue Source – 2015-2022
Table 32 Italy Explosives & Weapons Detection Technologies Market [$M] by Revenue Source – 2015-2022
Table 33 Spain Explosives & Weapons Detection Technologies Market [$M] by Revenue Source – 2015-2022
Table 34 Poland Explosives & Weapons Detection Technologies Market [$M] by Revenue Source – 2015-2022
Table 35 Hungary & Czech Republic: Explosives & Weapons Detection Technologies Market [$M] by Revenue Source – 2015-2022
Table 36 Russia Explosives & Weapons Detection Technologies Market [$M] by Revenue Source – 2015-2022
Table 37 Rest of Europe: Explosives & Weapons Detection Technologies Market [$M] by Revenue Source – 2015-2022
Table 38 European Homeland Security and Public Safety Standards
Table 39  Membership in the EU, Eurozone, and Schengen Area

Figures

Figure 1 Europe Three-Key Challenges
Figure 2 Number of European ISIS-Da’esh Fighters by Country
Figure 3 2015 Refugee Applications to Europe by Month
Figure 4 2015 Migrant Applications to Europe by Country of Origin
Figure 5 Main Routes of Migration to Europe
Figure 6 European Asylum-Seeker Decisions by Country
Figure 7 Refugee Acceptance by Country 2015
Figure 8 Asylum Claims per 100.000 Local Populations 2015
Figure 9 EU Defense Expenditure [%] Drop- 2007-2014 [Constant 2005 Euros]
Figure 10 A Multi-lane People Screening Site
Figure 11 Explosive Trace Detection: Principle of Operation
Figure 12 ETD Operational Workflow
Figure 13 Explosive Materials Classification
Figure 14 The Most Commonly Used Explosives Classification
Figure 15 Explosives Detection Technologies: Bulk vs. Trace Detection
Figure 16 Explosives Trace Detection Configuration: Hand Held ETD, & Tabletop ETD,
Figure 17 Stand-Alone Checked Luggage ETD System
Figure 18 Boarding Card ETD Reader
Figure 19 Airport Boarding Gate with Built-in ETD Screening Technology
Figure 20 ETD Based Vehicle Screening System
Figure 21 Free-surface Microfluidic Control of Surface-enhanced Raman Spectroscopy Based ETD
Figure 22 Surface Enhanced Raman Spectroscopy System
Figure 23 Microfluidic Control Surface-Enhanced Raman Spectroscopy Based ETD Process
Figure 24 Falcon First Responder Kit
Figure 25 Cantilever (a) Without Detection. (b) With Detection of Molecules at its Surface
Figure 26 Schematic of Basic Sensor Design
Figure 27 Schematic Diagram of an ETD Based on a Sensor Array and Neural Network
Figure 28 Non-Contact ETD Explosives and Narcotics Harvesting, Transport, Analysis and Reporting Process
Figure 29 European Explosives Trace Detection (ETD) Market [$M] – 2015-2022
Figure 30 Passengers Walk through a Metal Detector at the Gare du Nord Train Station in Paris
Figure 31 Metal Detection Portals Technologies
Figure 32 Hand-Held Weapon Detector – Proper Scanning Path
Figure 33 Enhanced (Matrix) Metal Detection Portal
Figure 34 European Metal Detectors Market [$M] – 2015-2022
Figure 35 Suicide Attack Sequence
Figure 36 Evacuation Distance by Threat and Explosive Mass
Figure 37 Spectrum of Evolving Standoff People Screening Technologies
Figure 38 European Standoff Explosives & Weapon Detection Market [$M] – 2015-2022
Figure 39 Whole-Object EDS Scheme
Figure 40 EDS Throughput [BPH] vs. System Price [$K]
Figure 41 Aviation Security: “100% EDS” Screening Flow Scheme
Figure 42 Checked Luggage ETD, EDS & X-ray Screening
Figure 43 Checked Luggage ETD, EDS & X-ray Screening
Figure 44 Schematic Visualization of a Mini In-Line System
Figure 45 Checked Luggage ETD, EDS & X-ray Screening Mini In-Line System with Light Integration
Figure 46 Checked Luggage ETD, EDS & X-ray Screening Configuration 4 – Stand-alone EDS
Figure 47 European Tomographic Explosive Detection Systems & BHS Market [$M] – 2015-2022
Figure 48 Container/Vehicle Screening Technologies
Figure 49 X-Ray Screening – Block Diagram
Figure 50 Dual Energy X-Ray
Figure 51 Dual View X-Ray – Principles of Operation
Figure 52 Backscatter X-Ray + Penetrating X-Ray
Figure 53 Gamma Ray Screening – Block Diagram
Figure 54 Linac Screening System Block Diagram
Figure 55 Pulsed Fast Neutron Activation Container/Vehicle Screening System Block Diagram
Figure 56 European Vehicle & Container Screening Systems Market [$M] – 2015-2022
Figure 57 Major Explosives Detection Technologies: Bulk vs. Trace
Figure 58 X-Ray Conveyor-Based Screening Systems – Principles of Operation
Figure 59 Multi-View Dual Energy X-Ray Screening
Figure 60 X-Ray Backscatter (AIT) Principle of Operation
Figure 61 Backscatter People Screening Portal
Figure 62 Coherent X-ray Scheme
Figure 63 Cast and Artificial Limbs Screening System
Figure 64 A Prosthetic Limbs Backscatter Image Showing a Gun Hidden Underneath a Cast
Figure 65 Rapiscan Mobile Check ES002 Contains Two Screening Lanes
Figure 66 X-Ray Screening of Checked Luggage and Cabin Baggage as part of a Layered Aviation Security Infrastructure
Figure 67 European X-Ray Scanners Market [$M] – 2015-2022
Figure 68 European Explosives & Weapons Detection Technologies Security Market* [$M] by Country – 2015-2022
Figure 69 European Explosives & Weapons Detection Technologies Security Market* Shares [%] by Country – 2015-2022
Figure 70 European Explosives & Weapons Detection Technologies Security Market [$M] by Revenue Source (Sales, Aftersale and Other Revenues) – 2015-2022
Figure 71 European Explosives & Weapons Detection Technologies Market Share [%] by Revenue Source – 2015-2022
Figure 72 The European Union: Member States and Candidate Countries
Figure 73 EU Countries Currency Status- 2016
Figure 74 European 2015-2016 GDP Growth Forecast [%] By Country
Figure 75 Europe GDP per Capita By Country
Figure 76 2015 Refugee Applications to Europe by Month
Figure 77 2015 Migrant Applications to Europe by Country of Origin
Figure 78 Main Routes of Migration
Figure 79 European Asylum-Seeker Decisions by Country
Figure 80 Refugee Acceptance by Country 2015
Figure 81 Asylum Claims per 100.000 Local Populations 2015
Figure 82 Fragility and Instability in Europe Neighborhood MEA Countries
Figure 83 Europe Inflows of Threats
Figure 84 European Borders
Figure 85 The 2016 Schengen Border Map
Figure 86 The Advanced Passenger Analysis (APA) System
Figure 87  Migrant Arrivals by Sea and Land Borders in 2015

Questions about this report?

Contact Sales: 1-571-527-1010 or Analysts: 1-202-455-0966

  • Have a question about Weapons & Explosives Detection Markets in Europe - 2017-2022
    Please fill out all fields in the form below and click "Submit" to send your question.
    Our representative will review your question and contact you with an answer as soon as possible.
  • 2+2=
  • This field is for validation purposes and should be left unchanged.
1
Interested in this report? Need more information?

You may also like…

X
Powered By