Top
HSRCUK Public Safety & Homeland Security Market – 2017-2022
Placeholder

UK Public Safety & Homeland Security Market - 2017-2022

UK HLS and Counter Terror Market Surge: 2015 2020 CAGR 11.4%. Granulated Into 51 Submarkets

  • May 2017 Edition
  • 485
  • 216
    • 3450 $
    • 4450 $
    • 6950 $
    • 8000 $

    Small Businesses, Startups & Academia - Up to 50% Off

Quantity
IBM
Amazon
Sandia National Lab
HITACHI
Thales
Smiths Detection
Nuctech
Korea Internet & Security Agency
L3Harris
Huawei
Leidos
NEC
Toshiba
Deloitte
MAG

Want to customize this report?

If you purchase this report, you are entitled to a 30% discount towards customizing it, to better fit your market research and strategic needs. Our Custom Research and Industry Insights Department will work with you to better understand your information gaps and strategic needs and will provide you with a tailor-made market research report within a short period of time.

Why Choose Us?

30+ Years of Experience
We are a multidisciplinary team of Transformational Technologies industry experts with over 30 years of experience.
Gold Standard
With over 950 private sector clients (73% repeat customers), including major defense and security vendors, and Forbes Global 2000 companies, HSRC earned the reputation as the industry’s Gold Standard for Transformational Technologies Market Reports.
Tailored Research Services
Provide you with clear, actionable recommendations designed to empower decision making and to help you exploit emerging opportunities in the Transformational Technologies industries.
Information Security
Your personal information is safe and secure.

From: $3,450

SKU: 8703 Category:

Description


Britain Homeland Security & Public Safety Market - 2016-2022
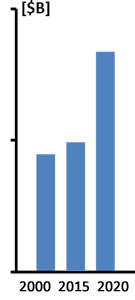
UK Homeland Security & Public Safety Market 2010, 2015 & 2020

Checkout our updated Global Homeland Security & Public Safety 2019-2024 report. 

The UK is facing security problems with a far greater reach than its economic ones. ISIS terror threats are alarming and show no signs of declining.

The present UK security measures, which have been effective in the past, cannot meet the 21st century ISIS-inspired terror tactics (following 5 years of security agencies’ budget and personnel cuts). A revision of the UK security infrastructure and funding is already underway.

The transformation of the UK security infrastructure and HLS budgets is best expressed in the words of David Cameron, UK Prime Minister, in the aftermath of the Brussels carnage: “They could just as well be attacks in Britain or in France or Germany, or elsewhere in Europe and we need to stand together against these appalling terrorists and make sure they can never win“.

Following a 5-year CAGR of 2-3%, this UK Homeland Security Market research forecasts a 4-fold increase in the 2015-2020 market, at a CAGR of 11.3% .

The two-volume (*) + one “UK Homeland Security & Public Safety Market – 2016-2022” report is the most comprehensive review of the UK HLS market available today. It provides a detailed and reasoned roadmap of this growing market.

The UK Security Market Forecast covers the Homeland Security Immigration Enforcement & Public Safety markets since, in most cases, products and services have dual or triple use applications and present the same business opportunities (e.g., biometric modalities are used for the following three sectors: counter-crime, immigration enforcement and counter terror).

The UK Homeland security market is set to undergo a major transformation from 2016-2022 through the following drivers:

  • According to the British intelligence organizations (March 2016), at least 800 people from the UK have traveled to support or fight for jihadist organizations in Syria and Iraq. Approximately 400 have since returned to the UK. A further 600 British citizens have been caught trying to join ISIS.
  • The 2015 Paris, and the March 2016 Brussels terrorist attacks have focused greater attention on the threats posed by international terrorists and acted as a spur for UK authorities to enhance emergency planning and response capabilities.
  • UK, the 5th largest economy in the world with a 2015 GDP of approximately $2.9 trillion, can invest “whatever it takes” to protect its citizens from the looming risks of terrorism and immigration.
  • While the UK has a tradition of quite effective coordination among its competing counter terror and public safety agencies, some inter-agencies coordination problems are an obstacle to harmonized efforts to carry out the country counter terror and public safety missions. This phenomenon increases the national markets due to duplication of purchased systems.
  • The UK market for security & safety products is sophisticated and well served. Local defense and security companies are well entrenched in the UK security market. Even with a preference for locally manufactured products, foreign products can usually strongly compete on the basis of price and innovation. They do not encounter any direct trade barriers or quotas. Non-tariff, indirect trade barriers may be the approval process of dual use goods, which include many security market products.

This report is a resource for executives with interests in the UK Homeland security industry. It has been explicitly customized for the security industry and government decision-makers in order to identify business opportunities, developing technologies, market trends and risks, as well as to benchmark business plans.

Questions answered in this 485-page two-volume + one (*) market report include:

  • What will the UK HLS market size and trends be during 2016-2022?
  • Which submarkets provide attractive business opportunities?
  • Who are the decision-makers?
  • What drives the UK Homeland Security & Public Safety managers to purchase solutions and services?
  • What are the customers looking for?
  • What are the technology & services trends?
  • What is the market SWOT (Strengths, Weaknesses, Opportunities and Threats)?
  • What are the challenges to market penetration & growth?

UK Homeland Security & Public Safety Market - 2016-2022

UK Homeland Security & Public Safety Market Report Submarkets

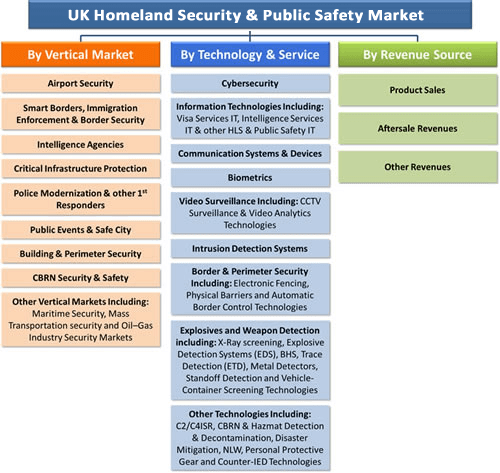
With 485 Pages, 65 Tables and 151 Figures, this 2-volume + one(*) report covers 9 Vertical, 9 Technology and 3 Revenue Source Submarkets, offering for each of them 2015 data and assessments, and 2016-2022 forecasts and analyses.

* The “Global Homeland Security & Public Safety Industry – 2016 Edition” report is a free of charge Bonus for multi-reader license customers and is offered at half price to single-reader customers.

Why Buy this Report?

A. This is the only report that addresses the HLS & Public Safety dual-use markets:
76% of the UK market revenues emanate from dual-use products. For example, cybersecurity systems are used to address both cyber-crime and cyber-terror. Decision-makers forming their strategy need a complete view of this overlapping market both independently and in their intersections.

B. Market data is analyzed via 3 key perspectives:

With a highly fragmented HLS & Public Safety market we address the “money trail” – each dollar spent – via the following 3 viewpoints:

  • By 9 Vertical Markets including:
    1. Airport Security
    2. Smart Borders, Immigration Enforcement & Border Security
    3. Intelligence Agencies
    4. Critical Infrastructure Protection
    5. Police Modernization & Other 1st Responders
    6. Public Events & Safe City
    7. Building & Perimeter Security
    8. CBRN Security & Safety
    9. Other Vertical Markets
  • By 3 Revenue Sources including:
    1. Products Sales
    2. Maintenance & Service, Upgrades, Refurbishment
    3. Planning, Training and Consulting
  • By 8 Technology Markets including:
    1. Cybersecurity
    2. Counter Terror & Crime IT
    3. Communication Systems & Devices
    4. Biometrics
    5. Video Surveillance Technologies
    6. Intrusion Detection Systems
    7. Border & Perimeter Security Technologies
    8. Explosives & Weapons Detection Technologies

C. Detailed market analysis frameworks for each of the market sectors, including:

  1. Market drivers & inhibitors
  2. Business opportunities
  3. SWOT analysis
  4. Competitive analysis
  5. Business environment
  6. The 2015-2022 market segmented by 51 submarkets

D. The UK homeland security and public safety market report includes the following 5 appendices:

  1. Appendix A: UK Counter Terror & Public Safety Agencies
  2. Appendix B: European Security Related Product Standards
  3. Appendix C: The European Union Challenges and Outlook
  4. Appendix D: The European Migration Crisis
  5. Appendix E: Abbreviations

E. The UK HLS market report addresses over 90 technologies including:

  1. Access Control Systems
  2. Automated Border Control (ABC) Gates
  3. Backscatter X-Ray Container-Vehicle Screening Systems
  4. Bio-Agents & Infectious Disease Detection
  5. Biometrics
  6. Biosecurity and Biosafety Devices & Systems
  7. Bio-Terror & Infectious Disease Early Alert System Devices & Systems
  8. Boarding Gate Explosives Scanners
  9. Border & Perimeter Barriers
  10. C2/C4ISR Systems
  11. Capacitance Sensors Fence
  12. CBRN and Hazmat Personal Protective Gear
  13. Cell Broadcast Mass Emergency Notification
  14. Chemical Agent Detection
  15. Chemical, HAZMAT & Nuclear Detection
  16. Coherent Scatter 2D X-Ray Systems
  17. Communication Systems & Devices
  18. Cybersecurity
  19. Decontamination of CBRN & HAZMAT Incidents
  20. Desktop ETD Devices
  21. Dual Energy LINAC X-Ray Container-Vehicle Screening Systems
  22. Dual-View LINAC X-Ray Container-Vehicle Screening Systems
  23. Dumb Fences
  24. Electronic Fencing
  25. Emergency Management IT Systems
  26. Emergency Medical Services (EMS) Devices & Systems
  27. E-Passports
  28. Fiber Optic Fence
  29. Gamma Ray Systems Container-Vehicle Screening Systems
  30. Hand Held Metal Detectors
  31. Handheld ETD Devices
  32. Homeland Security & Public Safety IT Systems
  33. Human Portable Radiation Detection Systems (HPRDS)
  34. Hybrid Tomographic EDS & 2D X-Ray Screening
  35. IED Placement Detection
  36. Infrastructure as a Service (IaaS) IT
  37. Intelligence Community Big Data IT
  38. Intelligence Community Cloud Infrastructure IT
  39. Intelligence Community Software as a Service (SaaS)
  40. Intelligence Services IT
  41. Interoperable Communication Systems
  42. Intrusion Detection Systems
  43. Ion Mobility Spectroscopy (IMS)
  44. Liquid Explosives Detection Devices
  45. Luggage, Baggage & Mail Screening Systems
  46. Maritime Awareness Global Network (MAGNET)
  47. Mass Emergency Notification Devices & Systems
  48. Metal detection Portals
  49. Multimodal Biometric Systems
  50. Narcotics Trace Detection Devices
  51. Natural & Manmade Disaster Early Warning systems
  52. Non-Lethal Weapons(NLW)
  53. Nuclear/Radiological Detection Devices & Systems
  54. Other Security Technologies
  55. People Screening MMWave (AIT) Portals
  56. People Screening X-Ray Backscatter (AIT) Portals
  57. Perimeter Security Technologies
  58. Personal (Ballistic & CBRNE) Protective Gear
  59. Personal Body Armor
  60. Platform as a Service (PaaS)
  61. Police Modernization Systems and Devices
  62. Ported Coax Buried Line Fence
  63. Rescue & Recovery Equipment
  64. Respiratory Protective Equipment
  65. Satellite Based Maritime Tracking
  66. Shoe Scanners
  67. Siren Systems
  68. SkyBitz Global Locating System
  69. Standoff Explosives & Weapon Detection Systems
  70. Standoff Suicide Bombers Detection
  71. Strain Sensitive Cables Fence
  72. Suicide Bombers Borne IED (PBIED) Detectors
  73. Suicide Bombers Detonation Neutralization
  74. Taut Wire Fence
  75. Text Alert Systems
  76. The Advanced Spectroscopic Portals (ASP)
  77. Tomographic Explosive Detection Systems (EDS)
  78. Transportable X-Ray Screening Checkpoints
  79. VBIED Detonation Neutralization
  80. Vehicle & Container Screening Systems
  81. Vehicle Borne IED (VBIED) Detectors
  82. Vehicle Screening ETD Systems
  83. Vibration Sensors Mounted on Fence
  84. Video Analytics
  85. Video Surveillance
  86. Visa & Passport related IT
  87. Voice Alert Systems
  88. Wide Area Communications and Tracking Technology
  89. X-Ray Container-Vehicle Screening Systems
  90. X-ray Screening systems

F. The UK HLS market report addresses over 300 European Homeland Security and Public Safety standards (including links)

G. The UK HLS Market analysis provides the number of passengers and number of screened cabin & checked-in baggage and luggage at each of the major airports by 2016 & 2020

H. The supplementary (*) “Global Homeland Security and Public Safety Industry – 2016 Edition” report (updated by May 2016) provides the following insights and analysis of the industry including:

  • The Global Industry 2016 status
  • Effects of Emerging Technologies on the Industry
  • The Market Trends
  • Vendor – Government Relationship
  • Geopolitical Outlook 2016-2022
  • The Industry Business Models & Strategies
  • Market Entry Challenges
  • The Industry: Supply-Side & Demand-Side Analysis
  • Market Entry Strategies
  • Price Elasticity
  • Past Mergers & Acquisitions (M&A) Events

I. The supplementary (*) “Global Homeland Security and Public Safety Industry – 2016 Edition” report provides updated (May 2016) and extensive information (including company profile, recent annual revenues, key executives, homeland security and public safety products, and contact info.) on the 119 leading vendors in the industry, namely:

  1. 3M
  2. 3i-MIND
  3. 3VR
  4. 3xLOGIC
  5. ABB
  6. Accenture
  7. ACTi Corporation
  8. ADT Security Services
  9. AeroVironment Inc.
  10. Agent Video Intelligence
  11. Airbus Defence and Space
  12. Alcatel-Lucent (Nokia Group)
  13. ALPHAOPEN
  14. American Science & Engineering Inc.
  15. Anixter
  16. Aralia Systems
  17. AT&T Inc.
  18. Augusta Systems
  19. Austal
  20. Avigilon Corporation
  21. Aware
  22. Axis
  23. AxxonSoft
  24. Ayonix
  25. BAE Systems
  26. BioEnable Technologies Pvt Ltd
  27. BioLink Solutions
  28. Boeing
  29. Bollinger Shipyards, Inc
  30. Bosch Security Systems
  31. Bruker Corporation
  32. BT
  33. Camero
  34. Cassidian
  35. CelPlan
  36. China Security & Surveillance, Inc.
  37. Cisco Systems
  38. Citilog
  39. Cognitec Systems GmbH
  40. Computer Network Limited (CNL)
  41. Computer Sciences Corporation
  42. CrossMatch
  43. Diebold
  44. DRS Technologies Inc.
  45. DVTel
  46. Elbit Systems Ltd.
  47. Elsag Datamat
  48. Emerson Electric
  49. Ericsson
  50. ESRI
  51. FaceFirst
  52. Finmeccanica SpA
  53. Firetide
  54. Fulcrum Biometrics LLC
  55. G4S
  56. General Atomics Aeronautical Systems Inc.
  57. General Dynamics Corporation
  58. Getac Technology Corporation
  59. Hanwha Techwin
  60. Harris Corporation
  61. Hewlett Packard Enterprise
  62. Hexagon AB
  63. Honeywell International Inc.
  64. Huawei Technologies Co., Ltd
  65. IBM
  66. IndigoVision
  67. Intel Security
  68. IntuVision Inc
  69. iOmniscient
  70. IPConfigure
  71. IPS Intelligent Video Analytics
  72. Iris ID Systems, Inc.
  73. IriTech Inc.
  74. Israel Aerospace Industries Ltd.
  75. ISS
  76. L-3 Security & Detection Systems
  77. Leidos, Inc.
  78. Lockheed Martin Corporation
  79. MACROSCOP
  80. MDS
  81. Mer group
  82. Milestone Systems A/S
  83. Mirasys
  84. Motorola Solutions, Inc.
  85. National Instruments
  86. NEC Corporation
  87. NICE Systems
  88. Northrop Grumman Corporation
  89. Nuance Communications, Inc.
  90. ObjectVideo
  91. Panasonic Corporation
  92. Pelco
  93. Pivot3
  94. Proximex
  95. QinetiQ Limited
  96. Rapiscan Systems, Inc.
  97. Raytheon
  98. Rockwell Collins, Inc.
  99. Safran S.A.
  100. Salient Sciences
  101. Schneider Electric
  102. SeeTec
  103. Siemens
  104. Smart China (Holdings) Limited
  105. Smiths Detection Inc.
  106. Sony Corp.
  107. Speech Technology Center
  108. Suprema Inc.
  109. Synectics Plc
  110. Tandu Technologies & Security Systems Ltd
  111. Texas Instruments
  112. Textron Inc.
  113. Thales Group
  114. Total Recall
  115. Unisys Corporation
  116. Verint
  117. Vialogy LLC
  118. Vigilant Technology
  119. Zhejiang Dahua Technology

Table of Contents

Download TOC as PDF

2 Volumes:

UK Homeland Security & Public Safety Market 2017-2022 – Volume 1

UK Homeland Security & Public Safety Market 2017-2022 – Volume 2


UK Homeland Security & Public Safety Market 2017-2022 – Volume 1

1 Summary
2 UK Homeland Security & Public Safety: Market Background
3 Terror Challenges
4 The UK Terror Threats & Counter Terror Strategy
4.1 The New Realities of Terror
4.2 National Security Risk Assessment 2016
4.3 The United Kingdom Counter Terror Strategy
4.4 Countering International Terrorism
4.5 The UK Homeland Security and Public Safety Tactics
4.6 UK Counter Terror Legislation
4.7 Countering Terrorism Financing
4.8 UK Intelligence Agencies Funding
4.9 2015-2016 Counter Terror Policy Transformation
4.1 UK Public Safety Challenges
4.11 UK Counter Terror Legislation
4.12 Countering Terrorism Financing
5 UK Homeland Security & Public Safety Market: SWOT Analysis
5.1 Strengths
5.2 Weaknesses
5.3 Opportunities
5.4 Threats
6 UK Homeland Security & Public Safety: Market – 2015-2022
6.1 UK Homeland Security & Public Safety: Market By Revenue Category – 2015-2022
6.1.1 Market Forecast
6.1.2 Market Dynamics
6.1.3 Market Breakdown
6.2 UK Homeland Security, Immigration Enforcement & Public Safety Vertical Markets – 2015-2022
6.2.1 Market Forecast
6.2.2 Market Dynamics
6.2.3 Market Breakdown
6.3 UK Homeland Security, Immigration Enforcement & Public Safety Technology Markets – 2015-2022
6.3.1 Market Forecast
  VERTICAL MARKETS
7 UK Airport Security Market- 2016-2022
7.1 Market Definition
7.2 Aviation Security Threats
7.3 Aviation Cybersecurity
7.4 The UK Aviation Security: Market Background
7.5 UK Airports Passengers & Baggage Screening Statistics by Airport – 2016 & 2020
7.6 Aviation Security Screening Technologies
7.6.1 X-ray Screening
7.6.2 Explosive Detection Systems (EDS)
7.6.3 Explosives Trace Detection (ETD)
7.6.4 Biological, Radioactive and Nuclear Detection System
7.6.4.1 Millimeter Wave Imaging Systems
7.6.5 Freight Forwarders
7.6.6 Customs
7.6.7 Aviation Passenger Screening Technologies Outlook: 2014-2022
7.6.8 Checked Baggage Screening Market
7.6.9 Counter-MANPAD Market
7.7 Air Cargo Screening Technologies & Markets
7.7.1 Air Cargo Outlook
7.7.2 Air Cargo Related Security Risks
7.7.3 Air-Cargo Supply Chain Security
7.7.4 Airport Perimeter Security Technologies & Markets
7.7.5 UK Aviation Security Market Business Opportunities & Challenges
7.8 UK Airport Security Market- 2015-2022
7.8.1 Market Size & Dynamics
7.8.2 Market Breakdown
8 UK Smart Border, Immigration Enforcement & Border Security Market – 2016-2022
8.1 Market Definition
8.2 Migration to the UK
8.2.1 The Home Office Border Force
8.2.2 UK Immigration Data
8.2.3 Migration from Eastern Europe
8.2.4 The UK 2015 Immigration Data
8.2.5 Immigration Legislation
8.2.6 Points-Based Migration
8.2.7 Automated Border Control (ABC) Gates
8.2.8 Immigration Enforcement
8.2.9 UK Border Security
8.2.10 The UK-France Eurotunnel
8.3 UK Smart Border, Immigration Enforcement & Border Security Market-2015-2022
8.3.1 Market Size & Dynamics
8.3.2 Market Breakdown
9 UK Counter Terror & Counter Crime Intelligence Agencies Market – 2016-2022
9.1 Market Definition
9.2 UK Intelligence Agencies: Market Background
9.3 Anti-terror Intelligence Industry Business Opportunities & Challenges
9.4 UK Intelligence Agencies
9.4.1 Security Service – MI5
9.4.2 National Domestic Extremism & Disorder Intelligence Unit (NDEDIU)
9.4.3 National Crime Agency (NCA)
9.4.4 National Ballistics Intelligence Service (NBIS)
9.4.5 National Fraud Intelligence Bureau (NFIB)
9.4.6 MI6, Secret Intelligence Service
9.4.7 Defense Intelligence (DI)
9.4.8 Communications Headquarters (GCHQ)
9.4.9 The Joint Intelligence Organization
9.5 The Parliament Intelligence and Security Committee
9.6 UK Intelligence Agencies Budgets
9.7 UK Counter Terror & Counter Crime Intelligence Agencies Market – 2015-2022
9.7.1 Market Size & Dynamics
9.7.2 Market Breakdown
10 UK Critical Infrastructure Protection Market -2016-2022
10.1 Market Definition
10.2 UK Critical Infrastructure Protection Market Background
10.3 Planning of Infrastructure Security
10.4 Information Sharing with the Private Sector
10.5 Critical Infrastructure Security Market: Business Opportunities
10.6 The UK CIP Cybersecurity
10.6.1 The UK CIP Cybersecurity Strategy
10.7 Critical Infrastructure CBRN Security
10.8 UK CIP Standards and Specifications
10.9 UK Critical Infrastructure Protection Market -2015-2022
10.9.1 Market Size & Dynamics
10.9.2 Market Breakdown
11 UK Police Modernization & Other 1st Responders Market – 2016-2022
11.1 Market Definition
11.2 UK Police Force Modernization
11.3 The UK Police Forces Statistics (2015)
11.4 First Responders Emergency Communications
11.5 UK Fire Services and Emergency Medical Services
11.6 Police Modernization & 1st Responders Market
11.6.1 UK Police Modernization & 1st Responder Business Opportunities
11.7 UK Police Modernization & Other 1st Responders Market – 2015-2022
11.7.1 Market Size & Dynamics
11.7.2 Market Breakdown
12 UK Safe City & Public Events Security Market – 2016-2022
12.1 Market Definition
12.2 Safe City: Background
12.3 UK Safe City Industry
12.4 Urban Security in the United Kingdom
12.4.1 UK Urban Security Policy
12.4.2 Urban Crime Data
12.5 UK Safe City Market
12.5.1 UK Safe City Projects: Introduction
12.5.2 Case 1: London – A Safe City
12.5.3 Case 2: Glasgow – A Safe City
12.6 UK Public Events Security Market
12.6.1 The Private Sector Public Events Security
12.6.2 Communication Interoperability
12.6.3 Perimeter Security
12.6.4 Public Events Infrastructure Security
12.6.5 Public Events Emergency Services
12.6.6 Public Events WMD and Hazmat Detection and Response Market
12.6.6.1 Suicide Attacks
12.6.6.2  Threat level
12.6.7 UK Public Events Security Market: Business Opportunities & Challenges
12.7 UK Safe City & Public Events Security Market 2015-2022
12.7.1 Market Size & Dynamics
12.7.2 Market Breakdown
13 UK Building & Perimeter Security Market – 2016-2020
13.1 Market Definition
13.2 Buildings & Perimeter Security Technologies and Market
13.2.1 Building Security
13.2.2 Perimeter Security
13.3 UK Buildings & Perimeter Security Standards and Specifications
13.4 UK Building & Perimeter Security Market – 2015-2020
13.4.1 Market Size & Dynamics
13.4.2 Market Breakdown
   
   
14 UK CBRN Security & Safety Market – 2016-2022
14.1 Market Definition
14.2 Market-Background
14.3 UK CBRN Security & Safety Market – 2015-2022
14.3.1 Market Size & Dynamics
14.3.2 Market Breakdown
15 UK Other Homeland security & Public Safety Vertical Markets – 2016-2022
15.1 UK Maritime Security Market
15.1.1 UK Coast Guard
15.1.2 Satellite Based Maritime Tracking
15.1.3 Wide Area Communications and Tracking Technology
15.1.4 SkyBitz Global Locating System
15.1.5 PAR Cargo*Mate
15.1.6 TRI-MEX “Black Box”
15.1.7 Maritime Awareness Global Network (MAGNET)
15.1.8 Piracy Mitigation
15.1.9 The UK’s National Strategy for Maritime Security
15.2 UK Mass Transportation Security Market
15.3 UK Oil-Gas Industry Security Market
15.3.1 Market Background
15.3.2 Threats to the Oil-Gas Industry Infrastructure
15.3.3 UK Oil & Gas Industry Security Market: Business Opportunities
15.4 Other UK Homeland Security, Immigration Enforcement & Public Safety Vertical Markets – 2015-2022
15.4.1 Market Size & Dynamics
15.4.2 Market Breakdown


[Back to top]

UK Homeland Security & Public Safety Market 2017-2022 – Volume 2

  TECHNOLOGY MARKETS
1 UK Cybersecurity Market – 2016-2022
1.1 Scope
1.2 UK Cybersecurity Technologies & Market Background
1.2.1 European Cybersecurity Landscape – 2016
1.2.2 Cybersecurity Strategy: Conclusions
1.2.3 Business Related Cybersecurity: Conclusions
1.2.4 Cyber Terror & Crime
1.2.5 Cyber Warfare
1.2.6 Denial of Service
1.2.7 Deliberate Manipulation of Information
1.2.8 Detection of Unauthorized Activity
1.2.9 Anti-Malware Cyber-Security
1.2.10 Privacy Enhanced Technologies (PETs)
1.3 Key Cybersecurity Vendors
1.4 UK Cybersecurity: Business Opportunities
1.5 UK Cybersecurity Market – 2015-2022
1.5.1 Market Size & Dynamics
1.5.2 Market Breakdown
2 UK Homeland Security & Public Safety Information Technology (IT) Market – 2016-2022
2.1 Scope
2.2 Information Technologies (w/o Intel & Cyber)
2.3 Counter Terror & Public Safety: Data Center Systems
2.3.1 Overview
2.3.2 Counter Terror and Public Safety: Data Center Services
2.3.3 Counter Terror and Public Safety: Support Services
2.3.4 Counter Terror and Public Safety: Technical Consulting Services
2.3.5 Outsourcing Services
2.3.6 Application Services
2.4 Counter Terror and Public Safety: Enterprise Software
2.5 Counter Terror and Public Safety: IT Services
2.5.1 Counter Terror and Public Safety Agencies: Cloud Storage & Computing
2.6 Visa Issuance IT
2.6.1 UK Visa Policy
2.6.2 Key Facts
2.6.3 UK E-Passport
2.6.4 Immigration Legislation
2.6.5 UK Points-Based Migration
2.6.6 Automated Passport Control IT
2.7 Intelligence Agencies IT
2.7.1 Introduction
2.7.2 Counter Terror & Counter Crime Intelligence Community Software as a Service (SaaS)
2.7.3 Platform as a Service (PaaS)
2.7.4 Infrastructure as a Service (IaaS) IT
2.7.5 The Counter Terror & Counter Crime Intelligence Community Cloud Infrastructure IT
2.7.6 The Counter Terror & Counter Crime Intelligence Community Big Data IT
2.8 UK Homeland Security & Public Safety IT Market – 2015-2022
2.8.1 Market Size & Dynamics
2.8.2 Market Breakdown
3 UK Communication Systems & Devices Market – 2016-2022
3.1 Scope
3.2 Market and Technology Background
3.2.1 Emergency Communication
3.2.2 UK Counter Terror & Public Safety Communication Equipment: Business Opportunities
3.3 UK Communication Systems & Devices Market – 2015-2022
3.3.1 Market Size & Dynamics
3.3.2 Market Breakdown
4 UK Biometrics Market – 2016-2022
4.1 Scope
4.2 Technology and Market Background
4.3 Multimodal Biometric Systems
4.3.1 Homeland Security & Perimeter Security Applications
4.3.2 UK Biometric Passport
4.3.3 UK National Biometric ID card
4.3.4 The UK Foreign Nationals Biometric Cards
4.4 UK Biometrics: Business Opportunities & Challenges
4.5 UK Biometrics Market – 2015-2022
4.5.1 Market Size & Dynamics
4.5.2 Market Breakdown
5 UK Video Surveillance Technologies Market – 2016-2022
5.1 Scope
5.2 Video Surveillance Market
5.2.1 Video Surveillance Technologies
5.2.2 Video Surveillance: HLS & Public Safety Applications
5.2.3 UK Video Surveillance Market: Business Opportunities & Challenges
5.2.4 UK Video Surveillance Market Background
5.3 Video Analytics: Market Background
5.4 UK Video Surveillance Technologies Market – 2015-2022
5.4.1 Market Size & Dynamics
5.4.2 Market Breakdown
6 UK Intrusion Detection Systems Market – 2016-2022
6.1 Scope
6.2 Technology and Market Background
6.2.1 Access Control Systems
6.3 Intrusion Detection Systems: Business Opportunities & Challenges
6.3.1 Challenges
6.3.2 UK Intrusion Detection Systems Market: Business Opportunities
6.4 UK Intrusion Detection Systems Market – 2015-2022
6.4.1 Market Size & Dynamics
6.4.2 Market Breakdown
7 UK Border & Perimeter Security Technologies Market – 2016 -2022
7.1 Scope
7.2 Border & Perimeter Barriers
7.3 Electronic Fencing
7.3.1 Vibration Sensors Mounted on Fence
7.3.2 Capacitance Sensors Fence
7.3.3 Strain Sensitive Cables Fence
7.3.4 Fiber Optic Fence
7.3.5 Taut Wire Fence
7.3.6 Ported Coax Buried Line Fence
7.3.7 Fence
7.3.8 Electronic Fencing: Business Opportunities & Challenges
7.4 Automatic Border Control (ABC) Systems
7.5 UK Border & Perimeter Security Technologies Market – 2015-2022
7.5.1 Market Size & Dynamics
7.5.2 Market Breakdown
8 UK Explosives & Weapons Detection Technologies Market – 2015-2022
8.1 Scope
8.2 Market Background
8.3 X-ray Scanners
8.3.1 Background
8.3.2 X-ray Screening Technologies
8.3.2.1 Luggage, Baggage & Other Items Screening Technologies
8.3.2.2 People Screening X-ray Backscatter (AIT) Technology
8.3.2.3 Coherent Scatter 2D X-ray
8.3.2.4 Transportable X-RAY Screening Checkpoints
8.3.2.5 X-ray Technologies: Performance Comparison
8.3.3 X-ray Screening Market Background
8.3.3.1 Airports and Secured Facilities
8.3.3.2 Rail Stations X-ray Screening
8.3.3.3 Air Cargo Explosive Screening
8.3.3.4 ACES: The European Air Cargo Explosive Screening
8.3.3.5 The European RA3 and ACC3 Regulations
8.3.4 UK X-ray Screening: Business Opportunities & Challenges
8.4 Tomographic Explosive Detection Systems & BHS
8.4.1 Explosives Detection Systems: Technology Background
8.4.2 Explosive Detection Systems: Throughput
8.4.3 EDS Principle of Operation
8.4.4 EU Standard – 3 Approved Tomographic EDS Products
8.4.5 Hybrid Tomographic EDS & 2D X-ray Screening
8.4.6 EDS EU Standard-3 Certification
8.4.7 Aviation Security: EDS Checked Luggage Screening
8.5 Security-related Airport Baggage Handling Systems (BHS)
8.6 Baggage Handling Systems
8.6.1 High-Volume In-Line Checked Luggage BHS Systems
8.6.2 Checked Luggage BHS: Mini In-Line Checked Luggage Screening System
8.6.3 Stand-alone EDS
8.7 EDS Market Background
8.8 Explosives Trace Detection (ETD)
8.8.1 Introduction
8.8.2 ETD Technologies
8.8.2.1 Technology Overview
8.8.2.2 Ion Mobility Spectroscopy (IMS)
8.8.2.3 Current Explosives & Narcotics Detection Technologies
8.8.2.4 Handheld and Desktop ETD
8.8.2.5 Airport Boarding Gate Explosives Scanners
8.8.2.6 Vehicle Screening ETD Systems
8.8.3 EU Approved ETD Products: By Manufacturer, Model and Version
8.8.4 UK Business Opportunities & Challenges
8.9 Metal Detectors
8.9.1 Hand-Held Metal Detectors
8.9.2 Walk Through Metal Detection Portals
8.1 UK Metal Detectors Market: Business Opportunities & Challenges
8.11 Standoff Explosives & Weapon Detection
8.11.1 Technology and Market Background
8.11.2 Suicide Bombers & Vehicle Borne IEDs
8.12 UK Standoff Explosives & Weapon Detection: Business Opportunities & Challenges
8.12.1 Business Opportunities
8.12.2 PBIED & VBIED Detection: Technological Challenges
8.13 Vehicle & Container Screening Systems
8.13.1 Vehicle & Container Screening Portals Technologies
8.13.2 Comparison of Container-Vehicle Screening Technologies
8.13.3 X-ray Container-Vehicle Screening Systems
8.13.4 Dual Energy X-ray Container-Vehicle Screening
8.13.5 Dual-View X-ray Container-Vehicle Screening
8.13.6 Backscatter X-ray Container-Vehicle Screening
8.13.7 Gamma Ray Systems Container-Vehicle Screening
8.13.8 Linac Based X-ray Container-Vehicle Screening systems
8.13.9 Market Background
8.14 UK Explosives & Weapons Detection Technologies Market – 2015-2022
8.14.1 Market Size & Dynamics
8.14.2 Market Breakdown
9 UK Other Security Technologies Market – 2015-2022
9.1 Scope
9.2 UK C2/C4ISR Systems
9.2.1 C2/C4ISR Market & Technology Background
9.2.2 UK C2/C4ISR Systems: Business Opportunities
9.3 UK Bio-Agents & Infectious Disease Mitigation
9.3.1 Market Background
9.3.2 European Biosecurity
9.3.2.1 European Bio-Terror & Infectious Disease Detection and Mitigation Standards
9.3.2.2 Biosecurity and Biosafety
9.3.2.3 European CBRN Defense Strategy
9.3.2.4 European Commission Bio-Preparedness Actions
9.3.2.5 European Bio-Terror & Infectious Disease Detection and Mitigation Legislation
9.3.2.6 EU Biosafety and Biosecurity Initiatives
9.3.2.7 Europe Infectious Diseases Threat Perception
9.3.2.8 European Bio-Surveillance Strategy
9.3.2.9 Bio-Terror & Infectious Disease Early Alert System
9.3.2.10 Management Structure
9.3.2.11  Early Response to Major Pandemics
9.3.3 Bio-Detection Technologies and Market Background
9.3.3.1 Sampling the Environment
9.3.3.2 Bio-Detectors in a Multitude of Ambient Settings
9.3.4 Bio-Agents & Infectious Disease Detection: Homeland Security & Public Safety Applications
9.4 UK Bio-Agents & Infectious Disease Detection: Business Opportunities
9.5 UK Chemical, Hazmat & Nuclear Detection
9.5.1 Scope
9.5.2 Chemical Agent Detection Technologies
9.5.3 Nuclear/Radiological Detection Technologies
9.5.3.1 The Advanced

Tables

[Click here for Figures]

2 Volumes:

UK Homeland Security & Public Safety Market 2017-2022 – Volume 1

UK Homeland Security & Public Safety Market 2017-2022 – Volume 2


UK Homeland Security & Public Safety Market 2017-2022 – Volume 1

Table 1 UK Facts & Figures
Table 2 UK Homeland Security & Public-Safety Market [$M] and AGR [%] – 2015-2022
Table 3 UK Counter Immigration Enforcement & Public Safety: Market [$M] by Revenue Category – 2015-2022
Table 4 UK Homeland Security & Public Safety: Market AGR [%] by Revenue Category – 2015-2022
Table 5 UK Homeland Security & Public Safety: Market [$M] by Vertical Markets – 2015-2022
Table 6 UK Homeland Security & Public Safety: Market AGR [%] by Vertical Markets – 2015-2022
Table 7 UK Homeland Security, Immigration Enforcement & Public Safety Technology Markets [$M] – 2015-2022
Table 8 UK Major Airports: Number of Screened Passengers & Screened Baggage (Carry-on & Checked Baggage) [M] by Airport – 2016 & 2020
Table 9 UK Aviation Security Market: Business Opportunities
Table 10 UK Airport Security Homeland Security & Public Safety Market [$M] (incl. Sales, Aftersale & Other Revenues) & AGR [%] – 2015-22
Table 11 Migrant Stock in the UK by Country of Origin
Table 12 UK Smart Borders, Immigration Enforcement & Border Security Market [$M] (incl. Sales, Aftersale and Other Revenues) and AGR [%] – 2015-2022
Table 13 Counter Terror & Crime Intelligence Market: Business Opportunities
Table 14 UK Counter Terror & Counter Crime Intelligence Agencies Market [$M] (incl. Sales, Aftersale and Other Revenues) and AGR [%] – 2015-2022
Table 15 Critical Infrastructure Security Market: Business Opportunities by Technology
Table 16 Critical Infrastructure Security Submarkets Growth Outlook
Table 17 UK Critical Infrastructure Protection Market [$M] (incl. Sales, Aftersale and Other Revenues) and AGR [%] – 2015-2022
Table 18 Ranking of Manmade & Natural Disasters, Crime and Terror Threats as a Market Driver
Table 19 UK Police Modernization & 1st Responder Market: Business Opportunities
Table 20 UK Police Modernization & Other 1st Responders Market [$M] (incl. Sales, Aftersale and Other Revenues) and AGR [%] – 2015-2022
Table 21 Threat Level Definitions
Table 22 UK Public Events Security Market: Business Opportunities Sectors
Table 23 UK Public Events Security & Safe City Market [$M] (incl. Sales, Aftersale and Other Revenues) and AGR [%] – 2015-2022
Table 24 UK Building & Perimeter Security Market [$M] (incl. Sales, Aftersale and Other Revenues) and AGR [%] – 2015-2022
Table 25 UK CBRN Security & Safety Market [$M] (incl. Sales, Aftersale and Other Revenues) and AGR [%] – 2015-2022
Table 26 UK Oil & Gas Industry Security Market: Business Opportunities
Table 27  UK Other Vertical Markets Market [$M] (incl. Sales, Aftersale and Other Revenues) and AGR [%] – 2015-2022


[Back to top]

UK Homeland Security & Public Safety Market 2017-2022 – Volume 2

Table 1 EU Cyber-Threats: Ranking & Trends – 2013-2015
Table 2 UK Cybersecurity Market: Business Opportunities
Table 3 UK Cybersecurity Market [$M] (incl. Sales, Aftersale and Other Revenues) and AGR [%] – 2015-2022
Table 4 UK Information Technologies Market [$M] (incl. Sales, Aftersale and Other Revenues) and AGR [%] – 2015-2022
Table 5 UK Communication Systems & Devices Market: Business Opportunities
Table 6 UK Communication Systems & Devices Market [$M] (incl. Sales, Aftersale and Other Revenues) and AGR [%] – 2015-2022
Table 7 Strengths and Weaknesses of Biometric Systems
Table 8 Comparison of Biometric Modalities
Table 9 UK Biometrics Market: Business Opportunities
Table 10 UK Biometrics Market [$M] (incl. Sales, Aftersale and Other Revenues) and AGR [%] – 2015-2022
Table 11 Video Surveillance Market: Business Opportunities
Table 12 UK Video Surveillance Technologies Market [$M] (incl. Sales, Aftersale and Other Revenues) and AGR [%] – 2015-2022
Table 13 Intrusion Detection Systems Market: Business Opportunities
Table 14 UK Intrusion Detection Systems Market [$M] (incl. Sales, Aftersale and Other Revenues) and AGR [%] – 2015-2022
Table 15 UK Electronic Fencing Market: Business Opportunities
Table 16 UK Border & Perimeter Security Technologies Market [$M] (incl. Sales, Aftersale and Other Revenues) and AGR [%] – 2015-2022
Table 17 Comparison of X-ray Detection Technologies
Table 18 UK X-ray Screening Market: Business Opportunities
Table 19 Explosive Detection Systems vs. Other Luggage Screening Technologies
Table 20 64 EU Standard-3 Approved EDS Products: By Manufacturer, Model & Version
Table 21 EU Approved ETD Products: By Manufacturer, Model & Version
Table 22 UK Explosives Trace Detection (ETD) Market: Business Opportunities
Table 23 UK Metal Detectors Market: Business Opportunities
Table 24 Comparison of Open Space Explosives & Weapon Detection Technologies
Table 25 Container-Vehicle Screening – Technologies Comparison
Table 26 UK Explosives & Weapons Detection Technologies Market [$M] (incl. Sales, Aftersale and Other Revenues) and AGR [%] – 2015-2022
Table 27 UK Counter Terror & Public Safety C2/C4ISR Business Opportunities
Table 28 UK Bio-Agents & Infectious Disease Detection Market: Business Opportunities
Table 29 Nuclear Terror Detection Roadmap
Table 30 Typical Goals of an EMS System: Daily vs. Disaster
Table 31 Notification Systems Technologies Characteristics
Table 32 UK Mass Emergency Notification Market: Business Opportunities
Table 33 Non-Lethal Weapons Counter-Personnel Means
Table 34 Electromagnetic NLW Technologies
Table 35 Mechanical & Kinetic, Acoustic, Ancillary & Chemical NLW Technologies
Table 36 Non-Lethal Weapons Market: Business Opportunities
Table 37 European Homeland Security and Public Safety Standards
Table 38  Membership in the EU, Eurozone, and Schengen Area

Figures

2 Volumes:

UK Homeland Security & Public Safety Market 2017-2022 – Volume 1

UK Homeland Security & Public Safety Market 2017-2022 – Volume 2


[Back to top]

UK Homeland Security & Public Safety Market 2017-2022 – Volume 1

Figure 1 UK Market Report Organogram
Figure 2 UK Counter Terror & Public Safety Agencies Organogram
Figure 3 UK Homeland Security & Public-Safety Market [$M] – 2015-2022
Figure 4 Europe Major Terror Attacks-2001 to March 2016
Figure 5 Percentage of UK Muslim Population Vs. Other EU Countries
Figure 6 UK Homeland Security & Public Safety: Market [$M] by Revenue Category – 2015-2022
Figure 7 UK Homeland Security & Public Safety: Market Shares [%] by Revenue Category – 2015-2022
Figure 8 UK Homeland Security & Public Safety: Market [$M] by Vertical Markets – 2015-2022
Figure 9 UK Homeland Security & Public Safety Vertical Market Shares [%] – 2015-2022
Figure 10 The UK Aviation Security Layers
Figure 11 A UK Airport Security Process
Figure 12 UK 2015 Passengers Share [%] by Airport
Figure 13 Airport Passengers Screening – Segments
Figure 14 UK Airport Security Market Share [%] by Revenue Category – 2015-2022
Figure 15 Immigration by Nationality – Dec 1991 – Jun 2015
Figure 16 Immigration Trends by Main Reason
Figure 17 Long-term International Migration in the UK 1991-2014
Figure 18 An Automatic Border Control (ABC) Gate
Figure 19 UK Borders Map
Figure 20 UK Smart Borders, Immigration Enforcement & Border Security Market [$M] by Revenue Category (Sales, Aftersale and Other Revenues) – 2015-2022
Figure 21 UK Smart Borders, Immigration Enforcement & Border Security Market Share [%] by Revenue Category – 2015-2022
Figure 22 Allocation of MI5 Resources by Core Activity (2015)
Figure 23 UK Counter Terror & Counter Crime Intelligence Agencies Market [$M] by Revenue Category (Sales, Aftersale and Other Revenues) – 2015-2022
Figure 24 UK Counter Terror & Counter Crime Intelligence Agencies Market Share [%] by Revenue Category – 2015-2022
Figure 25 Critical Infrastructure Security, Layers of Security
Figure 26 Hierarchy of Critical Infrastructures
Figure 27 The UK Critical Infrastructure Investment Priorities Scheme
Figure 28 UK Critical Infrastructure Protection Market [$M] by Revenue Category (Sales, Aftersale and Other Revenues) – 2015-2022
Figure 29 UK Critical Infrastructure Protection Market Share [%] by Revenue Category – 2015-2022
Figure 30 Police Officers 31 March 2006 to 2015, England and Wales
Figure 31 Future 1st Responders Communications Services
Figure 32 First Responders’ Mobile Devices Network
Figure 33 UK Police Modernization & Other 1st Responders Market [$M] by Revenue Category (Sales, Aftersale and Other Revenues) – 2015-2022
Figure 34 UK Police Modernization & Other 1st Responders Market Share [%] by Revenue Category – 2015-2022
Figure 35 Safe City ICT Flow
Figure 36 UK Public Events Security & Safe City Market [$M] by Revenue Category (Sales, Aftersale and Other Revenues) – 2015-2022
Figure 37 UK Public Events Security & Safe City Market Share [%] by Revenue Category – 2015-2022
Figure 38 UK Building & Perimeter Security Market [$M] by Revenue Category (Sales, Aftersale and Other Revenues) – 2015-2022
Figure 39 UK Building & Perimeter Security Market Share [%] by Revenue Category – 2015-2022
Figure 40 UK CBRN Security & Safety Market [$M] by Revenue Category (Sales, Aftersale and Other Revenues) – 2015-2022
Figure 41 UK CBRN Security & Safety Market Share [%] by Revenue Category – 2015-2022
Figure 42 UK Other Vertical Markets Market [$M] by Revenue Category (Sales, Aftersale and Other Revenues) – 2015-2022
Figure 43  UK Other Vertical Markets Market Share [%] by Revenue Category – 2015-2022


[Back to top]

UK Homeland Security & Public Safety Market 2017-2022 – Volume 2

Figure 1 The European “Computer Emergency Response Teams & Command Centre” (CERTs. CERT/CCs)
Figure 2 UK Cybersecurity Market [$M] by Revenue Category (Sales, Aftersale and Other Revenues) – 2015-2022
Figure 3 UK Cybersecurity Market Share [%] by Revenue Category – 2015-2022
Figure 4 UK Information Technologies Market [$M] by Revenue Category (Sales, Aftersale and Other Revenues) – 2015-2022
Figure 5 UK Information Technologies Market Share [%] by Revenue Category – 2015-2022
Figure 6 UK Communication Systems & Devices Market [$M] by Revenue Category (Sales, Aftersale and Other Revenues) – 2015-2022
Figure 7 UK Communication Systems & Devices Market Share [%] by Revenue Category – 2015-2022
Figure 8 Elements and Flowchart of a Biometric System
Figure 9 UK Biometric Passport
Figure 10 Biometric Residence Permit
Figure 11 A UK Foreign Nationals Biometric Card
Figure 12 UK Biometrics Market [$M] by Revenue Category (Sales, Aftersale and Other Revenues) – 2015-2022
Figure 13 UK Biometrics Market Share [%] by Revenue Category – 2015-2022
Figure 14 Video Surveillance Technologies Timeline
Figure 15 A Wireless Video Surveillance System
Figure 16 UK Video Surveillance Technologies Market [$M] by Revenue Category (Sales, Aftersale and Other Revenues) – 2015-2022
Figure 17 UK Video Surveillance Technologies Market Share [%] by Revenue Category – 2015-2022
Figure 18 Multi-Modal Intrusion Detectors
Figure 19 Example of Intrusion Detection System Architecture
Figure 20 UK Intrusion Detection Systems Market [$M] by Revenue Category (Sales, Aftersale and Other Revenues) – 2015-2022
Figure 21 UK Intrusion Detection Systems Market Share [%] by Revenue Category – 2015-2022
Figure 22 Diagram of Physical Security Fence Functions
Figure 23 Automated Border Controls Technology
Figure 24 Automated Border Control Gates at Heathrow Airport
Figure 25 UK Border & Perimeter Security Technologies Market [$M] by Revenue Category (Sales, Aftersale and Other Revenues) – 2015-2022
Figure 26 UK Border & Perimeter Security Technologies Market Share [%] by Revenue Category – 2015-2022
Figure 27 Major Explosives Detection Technologies: Bulk vs. Trace
Figure 28 X-ray Conveyor-Based Screening Systems – Principles of Operation
Figure 29 Multi-View Dual Energy X-ray Screening
Figure 30 X-ray Backscatter (AIT) Principle of Operation
Figure 31 Backscatter People Screening Portal
Figure 32 Coherent X-ray Scheme
Figure 33 Rapiscan Mobile Check ES002 Contains Two Screening Lanes
Figure 34 Whole-Object EDS Scheme
Figure 35 EDS Based Luggage Screening System at Heathrow Airport
Figure 36 Aviation Security: “100% EDS” Screening Flow Scheme
Figure 37 Checked Luggage ETD, EDS & X-ray Screening
Figure 38 Checked Luggage ETD, EDS & X-ray Screening
Figure 39 Schematic Visualization of a Mini In-Line System
Figure 40 Checked Luggage ETD, EDS & X-ray Screening Mini In-Line System with Light Integration
Figure 41 Checked Luggage ETD, EDS & X-ray Screening Configuration 4 – Stand-alone EDS
Figure 42 Explosive Trace Detection: Principle of Operation
Figure 43 ETD Operational Workflow
Figure 44 Explosive Materials Classification
Figure 45 The Most Commonly Used Explosives Classification
Figure 46 Explosives Detection Technologies: Bulk vs. Trace Detection
Figure 47 Explosives Trace Detection Configuration: Hand Held ETD, & Tabletop ETD,
Figure 48 Boarding Card ETD Reader
Figure 49 Airport Boarding Gate with Built-in ETD Screening Technology
Figure 50 Hand-held Weapon Metal Detector “Wands”
Figure 51 A Metal Detection Portal at a Sport Stadium
Figure 52 A Walk Through Mobile Metal Detector
Figure 53 Suicide Attack Sequence
Figure 54 Spectrum of Evolving Standoff People Screening Technologies
Figure 55 PBIED & VBIED Detection Technologies: Performance Criteria
Figure 56 Container/Vehicle Screening Technologies
Figure 57 X-ray Screening – Block Diagram
Figure 58 Dual Energy X-ray
Figure 59 Dual View X-ray – Principles of Operation
Figure 60 Backscatter X-ray + Penetrating X-ray
Figure 61 Gamma Ray Screening – Block Diagram
Figure 62 Linac Screening System Block Diagram
Figure 63 UK Explosives & Weapons Detection Technologies Market Share [%] by Revenue Category – 2015-2022
Figure 64 A Seaport Security C2/C4ISR System Block diagram
Figure 65 Biosecurity and Safety Agencies & Processes Roadmap
Figure 66 Airborne Bacterial Concentration Fluctuation in a Single Day
Figure 67 The European Bio-Detection Surveillance and Situational Awareness: Areas of Responsibility
Figure 68 Multi-Tiered Chemical, Hazmat & Nuclear Detection and Mitigation
Figure 69 Nuclear-Radiological Threats Weapon Sophistication vs. Consequence
Figure 70 The Three-tiered Port of Entry Nuclear Threat Screening Architecture
Figure 71 Comparison in Weight of Pathogens between BW Agents and CW Agents [mg]
Figure 72 Closed Area (e.g., Building) Decontamination Boundaries
Figure 73 Open Area Decontamination Boundaries
Figure 74 Decontamination Corridor
Figure 75 Decontamination Core Technologies Overview
Figure 76 The Decontamination Cycle
Figure 77 Decontamination Strategy: from Sample Collection to Decontamination Clearance
Figure 78 Basic Phases of Response and Recovery to a CBRN & HAZMAT Incident
Figure 79 The Bio Attack Response Timeline
Figure 80 Multimodal Mass Emergency Notification
Figure 81 Near Term Counter-Personnel NLW
Figure 82 Less-Lethal Weapons Clinical Effects
Figure 83 Mid-Term Counter-Personnel Non-Lethal Weapons
Figure 84 Far-Term Counter-Personnel Non-Lethal Weapons
Figure 85 Personal Body Armor
Figure 86 Respiratory Protective Equipment Segments
Figure 87 CBRN Personal Protective Gear
Figure 88 IED Ready for Detonation
Figure 89 IED “Kill Chain” and its Relevant Time Frame
Figure 90 UK Counter Terror & Public Safety Agencies Organogram
Figure 91 The European Union: Member States and Candidate Countries
Figure 92 EU Countries Currency Status – 2016
Figure 93 European 2015-2016 GDP Growth Forecast [%] By Country
Figure 94 Europe GDP per Capita By Country
Figure 95 2015 Refugee Applications to Europe by Month
Figure 96 2015 Migrant Applications to Europe by Country of Origin
Figure 97 Main Routes of Migration
Figure 98 European Asylum-Seeker Decisions by Country
Figure 99 Refugee Acceptance by Country 2015
Figure 100 Asylum Claims per 100.000 Local Populations 2015
Figure 101 Fragility and Instability in Europe Neighborhood MEA Countries
Figure 102 Europe Inflows of Threats
Figure 103 European Borders
Figure 104 The 2016 Schengen Border Map
Figure 105 The Advanced Passenger Analysis (APA) System
Figure 106  Migrant Arrivals by Sea and Land Borders in 2015


Questions about this report?

Contact Sales: 1-571-527-1010 or Analysts: 1-202-455-0966

  • Have a question about UK Public Safety & Homeland Security Market - 2017-2022
    Please fill out all fields in the form below and click "Submit" to send your question.
    Our representative will review your question and contact you with an answer as soon as possible.
  • 2+2=
  • This field is for validation purposes and should be left unchanged.
1
Interested in this report? Need more information?
X
Powered By