Top
HSRCU.S. Financial Services Cyber Security Market – 2016-2020
Placeholder

U.S. Financial Services Cyber Security Market - 2016-2020

Cyber Security Market – Focus on Financial Services’ Demand Side, ýCumulative 2016-2020 Market > $68 Billion

  • May 2016 Edition
  • 663
  • 259
    • 4450 $
    • 5450 $
    • 6950 $
    • 10000 $

    Small Businesses, Startups & Academia - Up to 50% Off

Quantity
IBM
Amazon
Sandia National Lab
HITACHI
Thales
Smiths Detection
Nuctech
Korea Internet & Security Agency
L3Harris
Huawei
Leidos
NEC
Toshiba
Deloitte
MAG

Want to customize this report?

If you purchase this report, you are entitled to a 30% discount towards customizing it, to better fit your market research and strategic needs. Our Custom Research and Industry Insights Department will work with you to better understand your information gaps and strategic needs and will provide you with a tailor-made market research report within a short period of time.

Why Choose Us?

30+ Years of Experience
We are a multidisciplinary team of Transformational Technologies industry experts with over 30 years of experience.
Gold Standard
With over 950 private sector clients (73% repeat customers), including major defense and security vendors, and Forbes Global 2000 companies, HSRC earned the reputation as the industry’s Gold Standard for Transformational Technologies Market Reports.
Tailored Research Services
Provide you with clear, actionable recommendations designed to empower decision making and to help you exploit emerging opportunities in the Transformational Technologies industries.
Information Security
Your personal information is safe and secure.

From: $4,450

Description

U.S. Financial Services: Cybersecurity Systems & Services Market - 2016-2020

Steps Involved in Financial Account Takeovers

Source: U.S. Congress GAO July 2015

This cyber security market report focuses on the U.S. financial services demand side of cyber security products, systems & services. It is based on hundreds of interviews with financial institutions’ cyber security customers, CEOs, CISOs and CIOs as well as cyber security industry executives and world-class experts.

The surge and sophistication of “successful” cyber crimes against the U.S. financial services enterprises, major retail chains, and banks during 2013-2015, when over 600 million customers’ bank records and payment cards were compromised, shook the board rooms of the U.S. financial institutions.

Considering the economic and business implications of cyber attacks, it has now become mandatory for the financial industry to significantly increase its investments in state-of-the-art cyber security technologies, solutions, and outsourced services to detect, prevent, analyze and resolve the epidemic of financial cyber crime.

According to the Cyber Security Market Report “U.S. Financial Services: U.S. Financial Services: Cybersecurity Systems & Services Market – 2016-2020” report, the U.S. financial institutions cyber security market is the largest and fastest growing private sector cyber security market. Its cumulative 2016-2020 market size is forecasted to exceed $68 Billion.

We corroborated our findings by conducting a meta study which integrated the results of eight individual surveys performed by others (e.g., Verizon, IBM, SANS survey for: Blue Coat, FireEye, ForeScout, Raytheon, Sourcefire Tenable Network, N.Y. State Department of Financial Services, Accenture, Zurich Insurance and more) with thousands of combined responders.

This report is a resource for executives with interests in the cyber security industry. It has been explicitly customized for the cyber security industry and financial services decision-makers to identify business opportunities, developing technologies, market trends and risks, as well as to benchmark business plans.

Questions answered in this 663-page report include:

  • What will the market size and trends of the cyber security market for financial institutions be during 2016-2020?
  • Which are the submarkets that provide attractive business opportunities in this cyber security segment?
  • What is the U.S. financial institutions industry structure?
  • Who are the decision-makers?
  • What drives the U.S. banking & financial services managers to purchase cyber security solutions and services?
  • What are the customers looking for?
  • What are the technology & services trends?
  • Where and what are the market opportunities?
  • What are the market drivers and inhibitors?
  • Who are the key cyber security vendors?
  • What are the challenges to market penetration & growth?

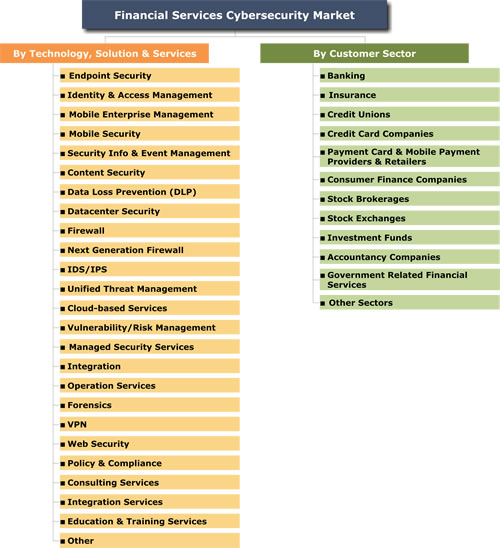
The report examines each dollar spent in the market via two orthogonal money trails: Technology & Service sectors and the Financial Services sectors that procure the products & services. Within these trails, the report is further granulated into: 25 technologies, solutions & services and 12 financial industry sectors as shown below:

Cyber security market in finance

Also included with this report: a roster of 21,653 banking and financial services enterprises that are potential cyber security customers. 87% of the listed enterprises include corporate contact information. Provided in an Excel file, the roster is segmented into 10 U.S. financial industry sectors (Banks, Credit Card Issuers, Credit Unions, Insurance Companies, Pension Funds, Accounting Companies, Stock Brokerage Companies, Stock Exchanges, Mortgage Companies and Real Estate Investment Companies).

We particularly look into the retail industry primes and the payment cards industry commitment to replace the 1970s security technology magnetic stripe cards and point of sale cash card scanners by new chip & pin cards and POS reading equipment.

The report presents in 663 pages, 259 tables & figures, analysis of 23 current and pipeline cyber security services & technologies and 193 leading cyber security vendors. It is explicitly tailored for both the cyber security industry and banking & financial services industry decision-makers. The report details market & cyber security legislation trends, and enables the two communities to identify business opportunities, present pipeline technologies, cyber security market size, legislation trends, drivers and inhibitors. It also provides for each submarket 2013 -2014 data, analyses, and projects the 2015-2020 market and technologies from several perspectives, including:

  • Business opportunities and challenges
  • SWOT analysis
  • Market analysis (e.g., market dynamics, market drivers and inhibitors)
  • 2013-2020 market size data & forecasts, current & emerging technologies & services, key facts, sector background and analysis of the following 18 submarkets: 
    1. Endpoint Security 
    2. Identity and Access Management 
    3. Mobile Enterprise Management 
    4. Mobile Security 
    5. Security Information and Event Management 
    6. Content Security 
    7. Data Loss Prevention (DLP) 
    8. Datacenter Security
    9. Firewall
    10. Next Generation Firewall 
    11. IDS/IPS 
    12. Unified Threat Management 
    13. Cloud-Based Services 
    14. Vulnerability/Risk Management & Managed Security Services
    15. Consulting Services 
    16. Integration Services 
    17. Education and Training Services
    18. Forensics, VPN, Web Security, Policy & Compliance and Other Services 
  • 2013-2020 market size data & forecasts, key facts and analysis of 7 banking & financial services sectors: 
    1. U.S. Banking Industry 
    2. U.S. Insurance Industry 
    3. U.S. Credit Card Companies & Mobile Payment Providers industry
    4. U.S. Government Related Financial Services industry
    5. U.S. Stock Brokerages & Exchanges 
    6. U.S. Pension Funds industry
    7. U.S. Credit Unions, Investment Funds, Accountancy Companies & Other financial sectors

The report includes:

  • 8 Appendices: 

Appendix A: Other Banking & Financial Services Cybersecurity Solutions 
Appendix B: Techno-Tactical Trends
Appendix C: Cyberspace Layers
Appendix D: Cybersecurity Standards
Appendix E: The E.U. Banking and Financial Services Security Regulations
Appendix F: Payment Card Transactions & Security Systems
Appendix G: Financial Sector Acronyms & Glossary
Appendix H: NIST – Framework for Improving Critical Infrastructure Cybersecurity

  • Data on 191 Cybersecurity companies operating in the market (profiles, contact information & management personnel) including:
    41st Parameter, Accenture, Agiliance, AhnLab, Airbus, AirWatch, Akamai, Alert Logic, AlertEnterprise, AlienVault, Alt-N Technologies, Application Security, AppSense Limited, Arbor Networks, Attachmate, Authentify, AVAST Software, Aveksa, AVG Technologies, Avira, Barracuda Networks, Beyond Security, BeyondTrust, Bit9, Bitdefender, BlackBerry, BlackStratus, Blue Coat Systems, BoxTone, Bromium, BullGuard, Cassidian Communications Inc., Catbird Networks, Centrify, Cenzic, Check Point, CipherCloud, Cisco Systems Inc, Clearswift, Click Security, CloudFlare, CloudLock, Code Green Networks, Commtouch Software, Comodo, CORE Security, Corero Network Security, Courion, Covisint, CrowdStrike Holdings, CSID, Cyber Operations, Cyber-Ark, CyberArk Software, Cyberoam, Cyren, Damballa, DigiCert, Digital Info Security Company, EdgeWave, EiQ Networks, Elbit Systems, Enterasys Networks, Entrust, ESET, Exobox Technologies Corp, Extreme Networks, Faronics Technologies, Fast facts, Fiberlink, Fidelis Security Systems, FireEye, FireMon, ForeScout Technologies, FoxGuard Solutions, F-Secure, Fulcrum IT Services Company. LLC, G2 Web Services, Gemalto, General Dynamics, GFI Software, Good Technology, Guardian Analytics, Guidance Software, Hewlett-Packard Co, HyTrust, ID Analytics, Igloo Security Inc, Imprivata, Intel Security Group, International Business Machines Corp, Intrusion Inc, IOActive, Iovation, Juniper Network, Kaspersky Lab, L-3 Communications, Lacoon Security Ltd, Lancope, LANDesk Software, LogRhythm, Lookingglass Cyber Solutions, Lookout Mobile, Lumension Security, M5 Network Security, Mandiant, Mantech International Corp, Memento, Merlin International, MessageLabs, MetricStream, Mobile Active Defense, Mobile Vault, MobileIron, Mobilityone Ltd, Mocana, MU Dynamics, N-Dimension Solutions, NetCentrics Corporation, Network Security Systems, Nics Tech Co. Ltd., NIKSUN, NSS Labs Inc., Odyssey Technologies, Okta, OpenDNS, Palantir Technologies Inc, Palo Alto Networks Inc, Panda Security, ParetoLogic, Perimeter Internetworking Corp., PerspecSys, Ping Identity, Prolexic Technologies, Proofpoint, Qualys Inc., Quick Heal Technologies (P) Ltd., QUMAS, QuoVadis, Radware Ltd, Rapid7, Raytheon Pikewerks Corporation, Red Lambda Inc., ReD plc, RedSeal Networks Inc., Retail Decisions Plc, RLM Communications Inc., RSA Security LLC, SafeNet Inc., SailPoint Technologies Inc., SAINT Corporation, Salient Federal Solutions Inc., SecurityMetrics, Senetas Corp Ltd, SilverSky, Skybox Security Inc., SolarWinds, Solera Networks Inc., Sophos Ltd., Sotera Defense Solutions Inc., Splunk Inc., Stormshield Network Security (Formerly: NETASQ S.A.), Strikeforce Technologies, Symantec Corporation, Sympli ied Inc., Synectics Plc, Tangoe, TeleSign Corp., Tenable Network Security, Thales, The KEYW Holding Corporation, ThreatMetrix, TIBCO Software, TraceSecurity, Trend Micro Inc, Tripwire, Trusteer, Trustwave, Utimaco Safeware Inc., Vanguard Integrity Professionals Inc., Varonis Systems, VASCO Data Security International, Venafi, Veracode, Verdasys, Verint Systems Inc, WatchGuard Technologies, Webroot, WhiteHat Security, Workshare Technology, Zix Corporation, Zscaler
  • Contact Info of 87% of the following U.S. Financial Institutions (in an attached Excel file):
Financial Sector # of Firms
Banks 6665
Credit Card Issuers 770
Credit Unions 6977
Insurance Companies 944
Pension Funds 252
Accounting Companies 1277
Stock Brokerage Companies 3817
Stock Exchanges 18
Mortgage Companies 831
Real Estate Investment Companies  92
   
Total 21,643

For more research on Cyber Security see in our Big Data Market in HLS in our site

Table of Contents

Download TOC as PDF

2 Volumes:

Financial Services Cybercrime Mitigation Technologies & U.S. Market 2016-2020 – Volume 1

Financial Services Cybercrime Mitigation Technologies & U.S. Market 2016-2020 – Volume 2


Financial Services Cybercrime Mitigation Technologies & U.S. Market 2016-2020 – Volume 1

1 Executive Summary
1.1 Major Findings
1.2 U.S. Financial Services Cybersecurity Mitigation Market
1.2.1 Market by Cybersecurity Technology & Service – 2016-2020
1.2.2 U.S. Financial Services Cybercrime Mitigation Market by Sector – 2016-2020
1.3 Major Conclusions
  MARKET BACKGROUND
2 The Global Banking & Financial Services Industry
2.1 Payment Cards & Mobile Payment Providers & Retailers
2.2 Electronic Money
2.2.1 E-Money Security
2.2.2 E-Money Regulation
2.2.3 Electronic Money Systems
2.2.4 Centralized Systems
2.3 Global Non-Cash Transactions
2.3.1 Non-Cash Transactions: Facts, Figures and Trends
2.3.2 Global Non-Cash Growth Drivers
2.4 Global Mobile Devices Services
2.4.1 Overview
2.4.2 NFC Payments from Mobile Phones
2.5 Cryptocurrency Cybersecurity
2.6 Cybersecurity of the Future: Quantum Computing Encryption & Code-Breaking
2.7 The Global “Financial Services Information Sharing & Analysis Center”
2.8 The Global Largest Banking & Financial Services Corporations
2.9 The U.S. Banking & Financial Services Industry
2.9.1 Facts & Figures
2.9.2 Roster of 21,643 Banking and Financial Services Enterprises (Incl. Corporate Contact Info)
2.9.3 International Linkages and Coordination
2.9.4 U.S. Regulatory Environment
3 Cyber Attacks Against Financial Institutions
3.1 Scope
3.2 Depository Institutions I.T. Security Methods
3.3 Theft of Financial Assets
3.4 Business Information Theft
3.5 Insurance Sector Cybercrime
4 U.S. Banking & Financial Services Cyber-Threats Landscape
4.1 Introduction
4.2 Cybercrime in the U.S.
4.2.1 Overview
4.2.2 Consumer & Identity Theft
4.3 U.S. Cyber-crime Statistical Data
5 The U.S. Financial Services Cybersecurity Market Outlook
6 Republican Congress Cybersecurity Legislation Outlook
7 Financial Services Cybercrime Mitigation Market: SWOT Analysis
7.1 Strengths
7.2 Weaknesses
7.3 Opportunities
7.4 Threats
  MARKET BY TECHNOLOGY & SERVICE
8 U.S. Financial Institutions Endpoint Security Submarket – 2016-2020
8.1 Endpoint Security Overview
8.2 Market Drivers
8.3 U.S. Financial Institutions Endpoint Security Market – 2016-2020
8.3.1 Market Size – 2016-2020
8.3.2 Market Dynamics
8.3.3 Market Share
9 U.S. Financial Institutions Identity and Access Management Submarket – 2016-2020
9.1 Identity and Access Management Overview
9.1.1 Overview
9.2 Market Drivers
9.3 U.S. Financial Institutions Identity and Access Management Market – 2016-2020
9.3.1 Market Size
9.3.2 Market Dynamics
9.3.3 Market Share
10 U.S. Financial Institutions Mobile Enterprise Management Submarket- 2016-2020
10.1 Mobile Enterprise Management Overview
10.2 Market Background
10.3 Market Drivers
10.4 U.S. Financial Institutions Mobile Enterprise Management Market – 2016-2020
10.4.1 Market Size
10.4.2 Market Dynamics
10.4.3 Market Share
11 U.S. Financial Institutions Mobile Security Submarket- 2016-2020
11.1 Mobile Security Overview
11.2 U.S. Banking, Financial Services, Retail & Payment Mobile Security Market – 2016-2020
11.2.1 Market Size
11.2.2 Market Dynamics
11.2.3 Market Share
12 U.S. Financial Institutions Security Information & Event Management Submarket – 2016-2020
12.1 Security Information and Event Management (SIEM): Market Background
12.2 Security Information Overload
12.3 Market Drivers
12.4 U.S. Financial Institutions Security Information and Event Management Market – 2016-2020
12.4.1 Market Size
12.4.2 Market Dynamics
12.4.3 Market Share
13 U.S. Financial Institutions Content Security Submarket- 2016-2020
13.1 Content Security Overview
13.2 Malware Mitigation
13.3 Market Trends
13.4 Market Drivers
13.5 U.S. Financial Institutions Content Security Market – 2016-2020
13.5.1 Market Size
13.5.2 Market Dynamics
13.5.3 Market Share
14 U.S. Financial Institutions Data Loss Prevention (DLP) Submarket- 2016-2020
14.1 Data Loss Prevention Overview
14.2 Market Drivers
14.3 U.S. Financial Institutions Data Loss Prevention (DLP) Market – 2016-2020
14.3.1 Market Size
14.3.2 Market Dynamics
14.3.3 Market Share
15 U.S. Financial Institutions Datacenter Security Submarket- 2016-2020
15.1 Datacenter Security Overview
15.2 Market Drivers
15.3 Datacenter Security Market Drivers
15.4 U.S. Financial Institutions Datacenter Security Market – 2016-2020
15.4.1 Market Size
15.4.2 Market Dynamics
15.4.3 Market Share
16 U.S. Financial Institutions Firewall Submarket – 2016-2020
16.1 Firewalls – Background
16.2 U.S. Banking, Financial Services, Retail & Payment Firewall Market – 2016-2020
16.2.1 Market Size
16.2.2 Market Dynamics
16.2.3 Market Share
17 U.S. Financial Institutions Next Generation Firewall Submarket -2016-2020
17.1 Next Generation Firewall Market Background
17.2 U.S. Banking, Financial Services, Retail & Payment Next Generation Firewall Market – 2016-2020
17.2.1 Market Size
17.2.2 Market Dynamics
17.2.3 Market Share
18 U.S. Financial Institutions IDS/IPS Submarket – 2016-2020
18.1 Intrusion Prevention Systems and Intrusion Detection Systems – Overview
18.2 IDS/IPS Market Ecosystem
18.3 Market Drivers
18.4 U.S. Financial Institutions IDS/IPS Market – 2016-2020
18.4.1 Market Size
18.4.2 Market Dynamics
18.4.3 Market Share
19 U.S. Financial Institutions Unified Threat Management (UTM) Submarket – 2016-2020
19.1 Unified Threat Management Overview
19.2 Market Drivers
19.3 Market Inhibitors
19.4 U.S. Financial Institutions Unified Threat Management Market – 2016-2020
19.4.1 Market Size
19.4.2 Market Dynamics
19.4.3 Market Share
20 U.S. Financial Institutions Cloud-Based Security Services Submarket – 2016-2020
20.1 Cloud-Based Services Overview
20.2 Hybrid Cloud
20.3 Market Drivers
20.4 U.S. Banking, Financial Services, Retail & Payment Cloud-Based Services Market – 2016-2020
20.4.1 Market Size
20.4.2 Market Dynamics
20.4.3 Market Share
21 U.S. Financial Institutions Vulnerability/Risk Management & Managed Security Services Submarket – 2016-2020
21.1 Vulnerability/Risk Management & Managed Security Services Overview
21.1.1 Vulnerability Management
21.1.2 Vulnerability Assessment
21.2 Vulnerability/Risk Management & Managed Cybersecurity Services Market Drivers
21.3 U.S. Financial Institutions Vulnerability/Risk Management & Managed Security Services Market – 2016-2020
21.3.1 Market Size
21.3.2 Market Dynamics
21.3.3 Market Share
22 U.S. Financial Institutions Cybersecurity Consulting Market – 2016-2020
22.1 Market Size
22.2 Market Dynamics
22.3 Market Share
23 U.S. Banking, Financial Services, Retail & Payment Cybersecurity Integration Services Market – 2016-2020
23.1 Market Size
23.2 Market Dynamics
23.3 Market Share
24 U.S. Banking, Financial Services, Retail & Payment Education and Training Services Market – 2016-2020
24.1 Market Size
24.2 Market Dynamics
24.3 Market Share
25 U.S. Financial Institutions Forensics, VPN, Web Security, Policy & Compliance and Other Cybersecurity Services Market – 2016-2020
25.1 Market Size
25.2 Market Dynamics
25.3 Market Share
26 U.S. Financial Institutions Cybersecurity Technology/ Service Submarkets Analysis – 2016-2020
26.1 Technology/Service Submarkets Outlook – 2016-2020
26.1.1 Market Size – 2016-2020
26.1.2 Market Dynamics – 2016-2020
26.1.3 Market Breakdown – 2016-2020
26.2 Major Banking, Financial Services, Retail & Payment Cybersecurity Markets
26.2.1 Overview – 2016-2020
26.2.2 Software Security U.S. Financial Services Market – 2016-2020
26.2.3 Network Security U.S. Financial Services Market – 2016-2020
  MARKET BY FINANCIAL INDUSTRY SECTOR
27 U.S. Financial Industry Cybersecurity Market Outlook by Financial Industry Sector
27.1 Overview
27.1.1 Market Size – 2016-2020
27.1.2 Market Dynamics – 2016-2020
27.1.3 Market Breakdown – 2016-2020
28 U.S. Banking Industry Cybersecurity Submarket – 2016-2020
28.1 U.S. Banking Industry Market Background
28.2 U.S. Banking Industry Cybersecurity Market – 2016-2020
28.2.1 Market Size
28.2.2 Market Dynamics
28.2.3 Market Share
29 U.S. Insurance Industry Cybersecurity Submarket- 2016-2020
29.1 The U.S. Insurance Industry Market Background
29.2 U.S. Insurance Industry Cybersecurity Market – 2016-2020
29.2.1 Market Size
29.2.2 Market Dynamics
29.2.3 Market Share
30 U.S. Payment Card & Mobile Payment Providers and Retailers Cybersecurity Submarket- 2016-2020
30.1 U.S. Payment Card Companies & Mobile Payment Providers industry Market Background
30.2 The U.S. Chip and PIN Cards Transformation Program
30.3 U.S. Payment Card & Mobile Payment Providers and Retailers Cybersecurity Market – 2016-2020
30.3.1 Market Size
30.3.2 Market Dynamics
30.3.3 Market Share
31 U.S. Government Related Financial Services Sector Cybersecurity Submarket – 2016-2020
31.1 Government Related Financial Services Market Background
31.2 U.S. Government Related Financial Services Sector Cybersecurity Market – 2016-2020
31.2.1 Market Size
31.2.2 Market Dynamics
31.2.3 Market Share
32 U.S. Stock Brokerages Industry & Exchanges Cybersecurity Submarket -2016-2020
32.1 Stock Brokerages Industry & Exchanges Market Background
32.1.1 Overview
32.1.2 Auction Exchanges – NYSE
32.1.3 Nasdaq (an Electronic Exchange)
32.1.4 Electronic Communication Networks (ECNs)
32.1.5 Over-the-Counter (OTC)
32.1.6 Stock Brokers and Exchanges Cybersecurity Vulnerabilities
32.1.7 Threat Profile for Securities Markets
32.2 U.S. Stock Brokerages Industry & Exchanges Cybersecurity Market – 2016-2020
32.2.1 Market Size
32.2.2 Market Dynamics
32.2.3 Market Share
33 U.S. Pension Funds Industry Cybersecurity Submarket – 2016-2020
33.1 U.S. Pension Funds Industry Market Background
33.1.1 Overview
33.1.2 Social Security Trust Funds
33.1.3 U.S. Social Security Cybersecurity Vulnerabilities
33.2 U.S. Pension Funds Industry Cybersecurity Market – 2016-2020
33.2.1 Market Size
33.2.2 Market Dynamics
33.2.3 Market Share
34 U.S. Credit Unions, Investment Funds, Accountancy Companies & Other Financial Sectors Cybersecurity Submarket- 2016-2020
34.1 Securities Sector Market Background
34.1.1 U.S. Asset Management Industry
34.1.2 U.S. Security Sector Cybersecurity Vulnerabilities
34.2 Accountancy Firms Market Background
34.3 U.S. Credit Unions, Investment Funds, Accountancy Companies & Other Financial Sectors Cybersecurity Market – 2016-2020
34.3.1 Market Size
34.3.2 Market Dynamics
34.3.3 Market Share
  EXPERTS OPINION, THE INDUSTRY
35 Experts Opinion
35.1 Ari M. Schwartz – Director for Cybersecurity,the White House (NSC ).
35.2 Luis A. Aguilar- Commissioner-U.S. Securities and Exchange Commission (SEC)
35.3 A. Belfiore – Head, Global Cybersecurity – J.P. Morgan
35.4 J. Routh – CISO, Aetna Cisco
35.5 Werner Vogels- Amazon’ CTO
35.6 Ed Powers-National Managing Partner, Cyber-risk Services, Deloitte & Touche LLP
35.7 Curt Aubley -Dirctor Cybersecurity , Lockheed Martin
35.8 Ed Schwartz – RSA, Security Division of EMC, Chairman, Cybersecurity Task Force at ISACA
35.9 M. Barzilay – Head of IT & Cybersecurity-Bank Hapoalim
35.1 Martin Borrett – Director-IBM Institute for Advanced Security Europe
35.11 Mark Gazit – CEO, President, Board Member- ThtaRay
35.12 Eugene Kaspersky – Chairman & CEO – Kaspersky Labs
35.13 Art Coviello – Executive Chairman, Executive VP, EMC Corporation, and RSA,
35.14 Tal Mozes – Advisory Services, Ernst & Young
35.15 Andrey Dulkin – Director -Cyber Innovation, Cyber-Ark
36 The Cybercrime Underground Market
37 Banking, Financial Services, Retail & Payment Services Trojans
37.1 Cybercrime Risk Assessment
37.2 Cybercrime, the Banking, Financial Services, Retail & Payment Services Perspective
38 Financial Institutions: Cyber-Risk Framework
38.1 Cybersecurity and Economic Security
38.2 Cyber Resilience vs. National Competitive Advantage
39 Four Cases of U.S. Banking, Financial Services & Retail Cyber Breaches, Facts, Costs, Analysis & Conclusions
39.1 The JP Morgan 2014 Breach
39.2 The Target Data Breach
39.2.1 The Target Breach
39.2.2 Target Breach: Total Cost Estimates
39.2.3  Target CRS Conclusions
39.3 Fidelity Investments Breach.
39.4 Kmart Breach
40 Cybercrime Insurance
40.1 Introduction
40.2 The U.S. Cyber-incident Data Repository
40.3 Enterprise Risk Management (ERM)
40.4 U.S. Cybersecurity Insurance
41 The Cybersecurity Supplier Industry
42 Cybersecurity Industry Mergers & Acquisitions
43 Recommendations for Banking, Financial Services, Retail & Payment Services Security Managers
43.1 Challenges of Financial Sector Complexity
43.2 How to Measure your Cybersecurity Risk
44 The International Treaty on Cybercrime


[Back to top]

Financial Services Cybercrime Mitigation Technologies & U.S. Market 2016-2020 – Volume 2

  VENDORS
1 CyberSecurity Vendors
1.1 41st Parameter
1.1.1 Contact Info
1.1.2 Company Profile
1.1.3 Key Executives
1.2 Accenture
1.2.1 Contact Info
1.2.2 Company Profile
1.2.3 Key Executives
1.3 Agiliance
1.3.1 Contact Info
1.3.2 Company Profile
1.3.3 Key Executives
1.4 AhnLab
1.4.1 Contact Info
1.4.2 Company Profile
1.5 Airbus
1.5.1 Contact Info
1.5.2 Company Profile
1.5.3 Key Executives
1.6 AirWatch
1.6.1 Contact Info
1.6.2 Company Profile
1.6.3 Key Executives
1.7 Akamai
1.7.1 Contact Info
1.7.2 Company Profile
1.7.3 Key Executives
1.8 AlertEnterprise
1.8.1 Contact Info
1.8.2 Company Profile
1.8.3 Key Executives
1.9 Alert Logic
1.9.1 Contact Info
1.9.2 Company Profile
1.9.3 Key Executives
1.1 AlienVault
1.10.1 Contact Info
1.10.2 Company Profile
1.10.3 Key Executives
1.11 Alt-N Technologies
1.11.1 Contact Info
1.11.2 Company Profile
1.11.3 Key Executives
1.12 Application Security
1.12.1 Contact Info
1.12.2 Company Profile
1.12.3 Key Executives
1.13 AppSense Limited
1.13.1 Contact Info
1.13.2 Company Profile
1.13.3 Key Executives
1.14 Arbor Networks
1.14.1 Contact Info
1.14.2 Company Profile
1.14.3 Key Executives
1.15 Attachmate
1.15.1 Contact Info
1.15.2 Company Profile
1.15.3 Key Executives
1.16 Authentify
1.16.1 Contact Info
1.16.2 Company Profile
1.16.3 Key Executives
1.17 AVAST Software
1.17.1 Contact Info
1.17.2 Company Profile
1.17.3 Key Executives
1.18 Aveksa
1.18.1 Contact Info
1.18.2 Company Profile
1.18.3 Key Executives
1.19 AVG Technologies
1.19.1 Contact Info
1.19.2 Company Profile
1.19.3 Key Executives
1.2 Avira
1.20.1 Contact Info
1.20.2 Company Profile
1.20.3 Key Executives
1.21 Barracuda Networks
1.21.1 Contact Info
1.21.2 Company Profile
1.21.3 Key Executives
1.22 Beyond Security
1.22.1 Contact Info
1.22.2 Company Profile
1.22.3 Key Executives
1.23 BeyondTrust
1.23.1 Contact Info
1.23.2 Company Profile
1.23.3 Key Executives
1.24 Bit9
1.24.1 Contact Info
1.24.2 Company Profile
1.24.3 Key Executives
1.25 Bitdefender
1.25.1 Contact Info
1.25.2 Company Profile
1.25.3 Key Executives
1.26 BlackBerry
1.26.1 Fast facts
1.26.2 Company Profile
1.26.3 Key Executives
1.27 BlackStratus
1.27.1 Contact Info
1.27.2 Company Profile
1.27.3 Key Executives
1.28 Blue Coat Systems
1.28.1 Contact Info
1.28.2 Company Profile
1.28.3 Key Executives
1.29 BoxTone
1.3 Bromium
1.30.1 Contact Info
1.30.2 Company Profile
1.30.3 Key Executives
1.31 BullGuard
1.31.1 Contact Info
1.31.2 Company Profile
1.31.3 Key Executives
1.32 Cassidian Communications, Inc.
1.32.1 Contact Info
1.32.2 Company Profile
1.32.3 Key Executives
1.33 Catbird Networks
1.33.1 Contact Info
1.33.2 Company Profile
1.33.3 Key Executives
1.34 Centrify
1.34.1 Contact Info
1.34.2 Company Profile
1.34.3 Key Executives
1.35 Cenzic
1.35.1 Contact Info
1.35.2 Company Profile
1.35.3 Key Executives
1.36 Check Point
1.36.1 Contact Info
1.36.2 Company Profile
1.36.3 Key Executives
1.37 CipherCloud
1.37.1 Contact Info
1.37.2 Company Profile
1.37.3 Key Executives
1.38 Cisco Systems Inc
1.38.1 Contact Info
1.38.2 Company Profile
1.38.3 Key Executives
1.39 Clearswift
1.39.1 Contact Info
1.39.2 Company Profile
1.39.3 Key Executives
1.4 Click Security
1.40.1 Contact Info
1.40.2 Company Profile
1.40.3 Key Executives
1.41 CloudFlare
1.41.1 Contact Info
1.41.2 Company Profile
1.41.3 Key Executives
1.42 CloudLock
1.42.1 Contact Info
1.42.2 Company Profile
1.42.3 Key Executives
1.43 Code Green Networks
1.43.1 Contact Info
1.43.2 Company Profile
1.43.3 Key Executives
1.44 Commtouch Software
1.45 Cyber Operations
1.45.1 Contact Info
1.45.2 Company Profile
1.45.3 Key Executives
1.46 CyberArk Software
1.46.1 Contact Info
1.46.2 Company Profile
1.46.3 Key Executives
1.47 Cyren
1.47.1 Contact Info
1.47.2 Company Profile
1.47.3 Key Executives
1.48 Comodo
1.48.1 Contact Info
1.48.2 Company Profile
1.48.3 Key Executives
1.49 CORE Security
1.49.1 Contact Info
1.49.2 Company Profile
1.49.3 Key Executives
1.5 Corero Network Security
1.50.1 Contact Info
1.50.2 Company Profile
1.50.3 Key Executives
1.51 Courion
1.51.1 Contact Info
1.51.2 Company Profile
1.51.3 Key Executives
1.52 Covisint
1.52.1 Contact Info
1.52.2 Company Profile
1.53 CrowdStrike Holdings
1.53.1 Contact Info
1.53.2 Company Profile
1.53.3 Key Executives
1.54 CSID
1.54.1 Contact Info
1.54.2 Company Profile
1.54.3 Key Executives
1.55 Cyber-Ark
1.55.1 Contact Info
1.55.2 Company Profile
1.55.3 Key Executives
1.56 Cyberoam
1.56.1 Contact Info
1.56.2 Company Profile
1.56.3 Key Executives
1.57 Damballa
1.57.1 Contact Info
1.57.2 Company Profile
1.57.3 Key Executives
1.58 DigiCert
1.58.1 Contact Info
1.58.2 Company Profile
1.58.3 Key Executives
1.59 Digital Info Security Company
1.59.1 Contact Info
1.59.2 Company Profile
1.59.3 Key Executives
1.6 EdgeWave
1.60.1 Contact Info
1.60.2 Company Profile
1.60.3 Key Executives
1.61 EiQ Networks
1.61.1 Contact Info
1.61.2 Company Profile
1.61.3 Key Executives
1.62 Elbit Systems
1.62.1 Contact Info
1.62.2 Company Profile
1.62.3 Key Executives
1.63 Enterasys Networks
1.64 Extreme Networks
1.64.1 Contact Info
1.64.2 Company Profile
1.65 Entrust
1.65.1 Contact Info
1.65.2 Company Profile
1.65.3 Key Executives
1.66 ESET
1.66.1 Contact Info
1.66.2 Company Profile
1.66.3 Key Executives
1.67 Exobox Technologies Corp
1.67.1 Contact Info
1.67.2 Company Profile
1.67.3 Key Executives
1.68 Faronics Technologies
1.68.1 Contact Info
1.68.2 Company Profile
1.68.3 Key Executives
1.69 Fiberlink
1.69.1 Contact Info
1.69.2 Company Profile
1.69.3 Key Executives
1.7 Fidelis Security Systems
1.70.1 Contact Info
1.70.2 Company Profile
1.70.3 Key Executives
1.71 FireEye
1.71.1 Contact Info
1.71.2 Company Profile
1.71.3 Key Executives
1.72 FireMon
1.72.1 Contact Info
1.72.2 Company Profile
1.72.3 Key Executives
1.73 ForeScout Technologies
1.73.1 Contact Info
1.73.2 Company Profile
1.73.3 Key Executives
1.74 FoxGuard Solutions
1.74.1 Contact Info
1.74.2 Company Profile
1.74.3 Key Executives
1.75 Fulcrum IT Services Company, LLC
1.75.1 Contact Info
1.75.2 Company Profile
1.75.3 Key Executives
1.76 F-Secure
1.76.1 Contact Info
1.76.2 Company Profile
1.76.3 Key Executives
1.77 G2 Web Services
1.77.1 Contact Info
1.77.2 Company Profile
1.77.3 Key Executives
1.78 Gemalto
1.78.1 Contact Info
1.78.2 Company Profile
1.78.3 Key Executives
1.79 General Dynamics
1.79.1 Contact Info
1.79.2 Company Profile
1.79.3 Key Executives
1.8 GFI Software
1.80.1 Contact Info
1.80.2 Company Profile
1.80.3 Key Executives
1.81 Good Technology
1.81.1 Contact Info
1.81.2 Company Profile
1.81.3 Key Executives
1.82 Guardian Analytics
1.82.1 Contact Info
1.82.2 Company Profile
1.82.3 Key Executives
1.83 Guidance Software
1.83.1 Contact Info
1.83.2 Company Profile
1.83.3 Key Executives
1.84 Hewlett-Packard Co
1.84.1 Contact Info
1.84.2 Company Profile
1.84.3 Key Executives
1.85 HyTrust
1.85.1 Contact Info
1.85.2 Company Profile
1.85.3 Key Executives
1.86 ID Analytics
1.86.1 Contact Info
1.86.2 Company Profile
1.86.3 Key Executives
1.87 Igloo Security Inc
1.87.1 Contact Info
1.87.2 Company Profile
1.87.3 Key Executives
1.88 Imprivata
1.88.1 Contact Info
1.88.2 Company Profile
1.88.3 Key Executives
1.89 Intel Security Group
1.89.1 Contact Info
1.89.2 Company Profile
1.89.3 Key Executives
1.9 International Business Machines Corp
1.90.1 Contact Info
1.90.2 Company Profile
1.90.3 Key Executives
1.91 Intrusion Inc
1.91.1 Contact Info
1.91.2 Company Profile
1.91.3 Key Executives
1.92 IOActive
1.92.1 Contact Info
1.92.2 Company Profile
1.92.3 Key Executives
1.93 Iovation
1.93.1 Contact Info
1.93.2 Company Profile
1.93.3 Key Executives
1.94 Juniper Network
1.94.1 Contact Info
1.94.2 Company Profile
1.94.3 Key Executives
1.95 Kaspersky Lab
1.95.1 Contact Info
1.95.2 Company Profile
1.95.3 Key Executives
1.96 The KEYW Holding Corporation
1.96.1 Contact Info
1.96.2 Company Profile
1.96.3 Key Executives
1.97 L-3 Communications
1.97.1 Contact Info
1.97.2 Company Profile
1.97.3 Key Executives
1.98 Lacoon Security Ltd
1.98.1 Contact Info
1.98.2 Company Profile
1.98.3 Key Executives
1.99 Lancope
1.99.1 Contact Info
1.99.2 Company Profile
1.99.3 Key Executives
1.1 LANDesk Software
1.100.1 Contact Info
1.100.2 Company Profile
1.100.3 Key Executives
1.101 LogRhythm
1.101.1 Contact Info
1.101.2 Company Profile
1.101.3 Key Executives
1.102 Lookingglass Cyber Solutions
1.102.1 Contact Info
1.102.2 Company Profile
1.102.3 Key Executives
1.103 Lookout Mobile
1.103.1 Contact Info
1.103.2 Company Profile
1.103.3 Key Executives
1.104 Lumension Security
1.104.1 Contact Info
1.104.2 Company Profile
1.104.3 Key Executives
1.105 M5 Network Security
1.105.1 Contact Info
1.105.2 Company Profile
1.105.3 Key Executives
1.106 Mandiant
1.106.1 Contact Info
1.106.2 Company Profile
1.107 Mantech International Corp
1.107.1 Contact Info
1.107.2 Company Profile
1.107.3 Key Executives
1.108 Memento
1.108.1 Contact Info
1.108.2 Company Profile
1.108.3 Key Executives
1.109 Merlin International
1.109.1 Contact Info
1.109.2 Company Profile
1.109.3 Key Executives
1.11 MessageLabs
1.110.1 Contact Info
1.110.2 Company Profile
1.110.3 Key Executives
1.111 MetricStream
1.111.1 Contact Info
1.111.2 Company Profile
1.111.3 Key Executives
1.112 Mobile Active Defense
1.112.1 Contact Info
1.112.2 Company Profile
1.112.3 Key Executives
1.113 Mobile Vault
1.113.1 Contact Info
1.113.2 Company Profile
1.113.3 Key Executives
1.114 MobileIron
1.114.1 Contact Info
1.114.2 Key Executives
1.115 Mobilityone Ltd
1.115.1 Contact Info
1.115.2 Company Profile
1.115.3 Key Executives
1.116 Mocana
1.116.1 Contact Info
1.116.2 Company Profile
1.116.3 Key Executives
1.117 MU Dynamics
1.117.1 Contact Info
1.117.2 Company Profile
1.117.3 Key Executives
1.118 N-Dimension Solutions
1.118.1 Contact Info
1.118.2 Company Profile
1.118.3 Key Executives
1.119 NetCentrics Corporation
1.119.1 Contact Info
1.119.2 Company Profile
1.119.3 Key Executives
1.12 Network Security Systems
1.120.1 Contact Info
1.120.2 Company Profile
1.120.3 Key Executives
1.121 Nics Tech Co., Ltd.
1.121.1 Contact Info
1.121.2 Company Profile
1.121.3 Key Executives
1.122 NIKSUN
1.122.1 Contact Info
1.122.2 Company Profile
1.122.3 Key Executives
1.123 NSS Labs, Inc.
1.123.1 Contact Info
1.123.2 Company Profile
1.123.3 Key Executives
1.124 Odyssey Technologies
1.124.1 Contact Info
1.124.2 Company Profile
1.124.3 Key Executives
1.125 Okta
1.125.1 Contact Info
1.125.2 Company Profile
1.125.3 Key Executives
1.126 OpenDNS
1.126.1 Contact Info
1.126.2 Company Profile
1.126.3 Key Executives
1.127 Panda Security
1.127.1 Contact Info
1.127.2 Company Profile
1.127.3 Key Executives
1.128 ParetoLogic
1.128.1 Contact Info
1.128.2 Company Profile
1.128.3 Key Executives
1.129 Perimeter Internetworking Corp.
1.13 PerspecSys
1.130.1 Contact Info
1.130.2 Company Profile
1.130.3 Key Executives
1.131 Ping Identity
1.131.1 Contact Info
1.131.2 Company Profile
1.131.3 Key Executives
1.132 Palantir Technologies Inc
1.132.1 Contact Info
1.132.2 Company Profile
1.132.3 Key Executives
1.133 Palo Alto Networks Inc
1.133.1 Contact Info
1.133.2 Company Profile
1.133.3 Key Executives
1.134 Prolexic Technologies
1.134.1 Contact Info
1.134.2 Company Profile
1.134.3 Key Executives
1.135 Proofpoint
1.135.1 Contact Info
1.135.2 Company Profile
1.135.3 Key Executives
1.136 Qualys, Inc.
1.136.1 Contact Info
1.136.2 Company Profile
1.136.3 Key Executives
1.137 QUMAS
1.137.1 Contact Info
1.137.2 Company Profile
1.138 QuoVadis
1.138.1 Contact Info
1.138.2 Company Profile
1.138.3 Key Executives
1.139 Quick Heal Technologies (P) Ltd.
1.139.1 Contact Info
1.139.2 Company Profile
1.139.3 Key Executives
1.14 Radware Ltd
1.140.1 Contact Info
1.140.2 Company Profile
1.140.3 Key Executives
1.141 Rapid7
1.141.1 Contact Info
1.141.2 Company Profile
1.141.3 Key Executives
1.142 Raytheon Pikewerks Corporation
1.142.1 Contact Info
1.142.2 Company Profile
1.142.3 Key Executives
1.143 Red Lambda Inc.
1.143.1 Contact Info
1.143.2 Company Profile
1.143.3 Key Executives
1.144 ReD plc
1.145 RedSeal Networks, Inc.
1.145.1 Contact Info
1.145.2 Company Profile
1.145.3 Key Executives
1.146 Retail Decisions Plc
1.146.1 Contact Info
1.146.2 Company Profile
1.146.3 Key Executives
1.147 RLM Communications, Inc.
1.147.1 Contact Info
1.147.2 Company Profile
1.147.3 Key Executives
1.148 RSA Security LLC
1.148.1 Contact Info
1.148.2 Company Profile
1.148.3 Key Executives
1.149 SafeNet, Inc.
1.149.1 Contact Info
1.149.2 Company Profile
1.149.3 Key Executives
1.15 SailPoint Technologies, Inc.
1.150.1 Contact Info
1.150.2 Company Profile
1.150.3 Key Executives
1.151 SAINT Corporation
1.151.1 Contact Info
1.151.2 Company Profile
1.151.3 Key Executives
1.152 Salient Federal Solutions, Inc.
1.152.1 Contact Info
1.152.2 Company Profile
1.152.3 Key Executives
1.153 SecurityMetrics
1.153.1 Contact Info
1.153.2 Company Profile
1.153.3 Key Executives
1.154 Senetas Corp. Ltd
1.154.1 Contact Info
1.154.2 Company Profile
1.154.3 Key Executives
1.155 SilverSky
1.155.1 Contact Info
1.155.2 Company Profile
1.155.3 Key Executives
1.156 Skybox Security Inc.
1.156.1 Contact Info
1.156.2 Company Profile
1.156.3 Key Executives
1.157 SolarWinds
1.157.1 Contact Info
1.157.2 Company Profile
1.157.3 Key Executives
1.158 Solera Networks Inc.
1.158.1 Contact Info
1.158.2 Company Profile
1.158.3 Key Executives
1.159 Sophos Ltd.
1.159.1 Contact Info
1.159.2 Company Profile
1.159.3 Key Executives
1.16 Sotera Defense Solutions, Inc.
1.160.1 Contact Info
1.160.2 Company Profile
1.160.3 Key Executives
1.161 Splunk Inc.
1.161.1 Contact Info
1.161.2 Company Profile
1.161.3 Key Executives
1.162 Stormshield Network Security (Formerly: NETASQ S.A.)
1.162.1 Contact Info
1.162.2 Company Profile
1.162.3 Key Executives
1.163 Strikeforce Technologies
1.163.1 Contact Info
1.163.2 Company Profile
1.163.3 Key Executives
1.164 Symantec Corporation
1.164.1 Contact Info
1.164.2 Company Profile
1.164.3 Key Executives
1.165 Synectics Plc
1.165.1 Contact Info
1.165.2 Company Profile
1.165.3 Key Executives
1.166 Symplified, Inc.
1.166.1 Contact Info
1.166.2 Company Profile
1.166.3 Key Executives
1.167 Tangoe
1.167.1 Contact Info
1.167.2 Company Profile
1.167.3 Key Executives
1.168 Thales
1.168.1 Contact Info
1.168.2 Company Profile
1.168.3 Key Executives
1.169 TeleSign Corp.
1.169.1 Contact Info
1.169.2 Company Profile
1.169.3 Key Executives
1.17 Tenable Network Security
1.170.1 Contact Info
1.170.2 Company Profile
1.170.3 Key Executives
1.171 ThreatMetrix
1.171.1 Contact Info
1.171.2 Company Profile
1.171.3 Key Executives
1.172 TIBCO Software
1.172.1 Contact Info
1.172.2 Company Profile
1.172.3 Key Executives
1.173 TraceSecurity
1.173.1 Contact Info
1.173.2 Company Profile
1.173.3 Key Executives
1.174 Trend Micro Inc
1.174.1 Contact Info
1.174.2 Company Profile
1.174.3 Key Executives
1.175 Tripwire
1.175.1 Contact Info
1.175.2 Company Profile
1.175.3 Key Executives
1.176 Trusteer
1.176.1 Contact Info
1.176.2 Company Profile
1.176.3 Key Executives
1.177 Trustwave
1.177.1 Contact Info
1.177.2 Company Profile
1.177.3 Key Executives
1.178 Utimaco Safeware, Inc.
1.178.1 Contact Info
1.178.2 Company Profile
1.178.3 Key Executives
1.179 Vanguard Integrity Professionals, Inc.
1.179.1 Contact Info
1.179.2 Company Profile
1.179.3 Key Executives
1.18 Varonis Systems
1.180.1 Contact Info
1.180.2 Company Profile
1.180.3 Key Executives
1.181 VASCO Data Security International
1.181.1 Contact Info
1.181.2 Company Profile
1.181.3 Key Executives
1.182 Venafi
1.182.1 Contact Info
1.182.2 Company Profile
1.182.3 Key Executives
1.183 Veracode
1.183.1 Contact Info
1.183.2 Company Profile
1.183.3 Key Executives
1.184 Verdasys
1.184.1 Contact Info
1.184.2 Company Profile
1.184.3 Key Executives
1.185 Verint Systems Inc
1.185.1 Contact Info
1.185.2 Company Profile
1.185.3 Key Executives
1.186 WatchGuard Technologies
1.186.1 Contact Info
1.186.2 Company Profile
1.186.3 Key Executives
1.187 Webroot
1.187.1 Contact Info
1.187.2 Company Profile
1.187.3 Key Executives
1.188 WhiteHat Security
1.188.1 Contact Info
1.188.2 Company Profile
1.188.3 Key Executives
1.189 Workshare Technology
1.189.1 Contact Info
1.189.2 Company Profile
1.189.3 Key Executives
1.19 Zix Corporation
1.190.1 Contact Info
1.190.2 Company Profile
1.190.3 Key Executives
1.191 Zscaler
1.191.1 Contact Info
1.191.2 Company Profile
1.191.3  Key Executives
2 Risk Posture of 3rd Party Suppliers
  APPENDICES
3 Appendix A: Other Banking and Financial Services Security Solutions
3.1 Scope and Analysis
3.2 Banking and Financial Services Security: from IT Security to Cybersecurity
3.3 Intelligence & Forensics
3.4 Cryptography
3.5 Artificial Intelligence
3.6 Behavioral Analytics
3.7 Identity Management
4 Appendix B: Techno-Tactical Trends
4.1 Risk Management
4.2 Vulnerability Management
4.3 Asset Discovery and Management
4.4 Mobile Device Security
4.5 SCADA Protection
4.6 Security-by-Design
4.7 Security Operation Centers (SOC)
4.8 Managed Security Services (MSS)
5 Appendix C: Cyberspace Layers
6 Appendix D: Cybersecurity Standards
6.1 Introduction
6.2 ISO 27001 and 27002 Standards
6.3 Standard of Good Practice
6.4 NERC Standards
6.5 NIST Standards
6.6 RFC 2196 Standards
6.7 ISA/IEC-62443 Standards
6.8 Planned and Published ISA-62443 IACS Security Standards.
6.8.1 ISA-62443 Standards
6.8.2 General Standards
6.8.3 Policy and Procedure Standards
6.8.4 System Integrator Standards
6.8.5 Component Provider Standards
6.9 ISA Security Compliance Institute
6.1 The U.K. IASME Standards
6.11 Payment Card Industry Security Standard (PCI DSS)
6.11.1 PCI DSS of Major Debit, Credit, Prepaid, E-Purse, ATM, and POS Cards
6.11.2 Requirements
6.11.3 Mandated Compliance
6.11.4 Compliance and Wireless LANs
6.12 IT Security Standards
6.12.1 ISO 27000 Series of Standards
7 Appendix E: The E.U. Banking and Financial Services Security Regulations
7.1 E.U. Regulations
7.1.1 Legislation in Force
7.1.2 FATF International Standard
7.1.3 Cybercrime, Money Laundering and Terrorist Financing Pipeline Legislation
8 Appendix F: Payment Card Transactions & Security Systems
8.1 Payment Card Transaction Process
8.2 Three-Party Transactions
8.3 The Retail Industry: Cybersecurity Breaches
8.4 Costs of Compromised Payment Cards
8.5 Who Foots the bill?
8.6 U.S. Legacy Payment Card Industry Security Practices
8.7 Pipeline Transaction Security Technologies
9 Appendix G: Financial Sector Acronyms & Glossary
9.1 Financial Sector Acronyms
9.2 Financial Sector Glossary
10 Appendix H: NIST – Framework for Improving Critical Infrastructure Cybersecurity
11 The Report Research Methodology
11.1 Report Structure
11.2 Assumptions
11.3 Research Methodology
11.4 Who Is This Report For?
11.5 Research Methods
12 Disclaimer and Copyright

Tables

[Click here for Figures]

2 Volumes:

U.S. Financial Services: Cybersecurity Systems & Services Market – 2016-2020 – Volume 1

U.S. Financial Services: Cybersecurity Systems & Services Market – 2016-2020 – Volume 2


U.S. Financial Services: Cybersecurity Systems & Services Market – 2016-2020 – Volume 1

Table 1 Sources of Adversarial Threats to Cybersecurity
Table 2 U.S. Banking & Financial Services Cyber Security Technology Submarkets [$M] – 2013-2020
Table 3 U.S. Banking & Financial Services Cyber Security Market by Sector [$M] – 2013-2020
Table 4 The Banking & Financial Services ICT Environmental Change Factors
Table 5 Worldwide Largest Banking & Financial Services Corporations by [$B] Revenue (2014)
Table 6 U.S. Banking & Financial Services Assets [$B] by Banking & Financial Services Sectors – 2010, 2011
Table 7 Top 10 U.S. Banking & Financial Services Firms by Revenues [$M] – 2011
Table 8 Distribution of the Number of Noncash Payments in the U.S. – 2006, 2009
Table 9 U.S. Automated Clearing House Electronic Payments 2002-2011
Table 10 Distribution of U.S. Banks by Cumulative Assets
Table 11 Cyber Attack: Why, Who & What?
Table 12 Top Cybercrime Types in the U.S. – 2011
Table 13 Top States for Cybercrime in the U.S. – 2011
Table 14 How Victims’ Information is Misused in the U.S. – 2011
Table 15 Identity Theft by State in the U.S. – 2011
Table 16 U.S. Financial Services Endpoint Security Submarket [$M] – 2013-2020
Table 17 U.S. Financial Services Endpoint Security Submarket AGR [%] – 2013-2020
Table 18 U.S. Financial Services Endpoint Security Submarket Share [%] – 2013-2020
Table 19 U.S. Financial Services Identity and Access Management Submarket [$M] – 2013-2020
Table 20 U.S. Financial Services Identity and Access Management Submarket AGR [%] – 2013-2020
Table 21 U.S. Financial Services Identity and Access Management Submarket Share [%] – 2013-2020
Table 22 U.S. Financial Services Mobile Enterprise Management Submarket [$M] – 2013-2020
Table 23 U.S. Financial Services Mobile Enterprise Management Submarket AGR [%] – 2013-2020
Table 24 U.S. Financial Services Mobile Enterprise Management Submarket Share [%] – 2013-2020
Table 25 U.S. Financial Services Mobile Security Submarket [$M] – 2013-2020
Table 26 U.S. Financial Services Mobile Security Submarket AGR [%] – 2013-2020
Table 27 U.S. Financial Services Mobile Security Submarket Share [%] – 2013-2020
Table 28 U.S. Financial Services Security Information and Event Management Submarket [$M] – 2013-2020
Table 29 U.S. Financial Services Security Information and Event Management Submarket AGR [%] – 2013-2020
Table 30 U.S. Financial Services Security Information and Event Management Submarket Share [%] – 2013-2020
Table 31 U.S. Financial Services Content Security Submarket [$M] – 2013-2020
Table 32 U.S. Financial Services Content Security Submarket AGR [%] – 2013-2020
Table 33 U.S. Financial Services Content Security Submarket Share [%] – 2013-2020
Table 34 U.S. Financial Services Data Loss Prevention (DLP) Submarket [$M] – 2013-2020
Table 35 U.S. Financial Services Data Loss Prevention (DLP) Submarket AGR [%] – 2013-2020
Table 36 U.S. Financial Services Data Loss Prevention (DLP) Submarket Share [%] – 2013-2020
Table 37 U.S. Financial Services Datacenter Security Submarket [$M] – 2013-2020
Table 38 U.S. Financial Services Datacenter Security Submarket AGR [%] – 2013-2020
Table 39 U.S. Financial Services Datacenter Security Submarket Share [%] – 2013-2020
Table 40 U.S. Financial Services Firewall Submarket [$M] – 2013-2020
Table 41 U.S. Financial Services Firewall Submarket AGR [%] – 2013-2020
Table 42 U.S. Financial Services Firewall Submarket Share [%] – 2013-2020
Table 43 U.S. Financial Services Next Generation Firewall Submarket [$M] – 2013-2020
Table 44 U.S. Financial Services Next Generation Firewall Submarket AGR [%] – 2013-2020
Table 45 U.S. Financial Services Next Generation Firewall Submarket Share [%] – 2013-2020
Table 46 U.S. Financial Services IDS/IPS Submarket [$M] – 2013-2020
Table 47 U.S. Financial Services IDS/IPS Submarket AGR [%] – 2013-2020
Table 48 U.S. Financial Services IDS/IPS Submarket Share [%] – 2013-2020
Table 49 U.S. Financial Services Unified Threat Management Submarket [$M] – 2013-2020
Table 50 U.S. Financial Services Unified Threat Management Submarket AGR [%] – 2013-2020
Table 51 U.S. Financial Services Unified Threat Management Submarket Share [%] – 2013-2020
Table 52 U.S. Financial Services Cloud-Based Services Submarket [$M] – 2013-2020
Table 53 U.S. Financial Services Cloud-Based Services Submarket AGR [%] – 2013-2020
Table 54 U.S. Financial Services Cloud-Based Services Submarket Share [%] – 2013-2020
Table 55 U.S. Financial Services Vulnerability/Risk Management & Managed Security Services Submarket [$M] – 2013-2020
Table 56 U.S. Financial Services Vulnerability/Risk Management & Managed Security Services Submarket AGR [%] – 2013-2020
Table 57 U.S. Financial Services Vulnerability/Risk Management & Managed Security Services Submarket Share [%] – 2013-2020
Table 58 U.S. Financial Services Consulting Market [$M] – 2013-2020
Table 59 U.S. Financial Services Consulting Market AGR [%] – 2013-2020
Table 60 U.S. Financial Services Consulting Market Share [%] – 2013-2020
Table 61 U.S. Financial Services Integration Services Market [$M] – 2013-2020
Table 62 U.S. Financial Services Integration Services Market AGR [%] – 2013-2020
Table 63 U.S. Financial Services Integration Services Market Share [%] – 2013-2020
Table 64 U.S. Financial Services Education and Training Services Market [$M] – 2013-2020
Table 65 U.S. Financial Services Education and Training Services Market AGR [%] – 2013-2020
Table 66 U.S. Financial Services Education and Training Services Market Share [%] – 2013-2020
Table 67 U.S. Financial Services Forensics, VPN, Web Security, Policy & Compliance and Other Services Market [$M] – 2013-2020
Table 68 U.S. Financial Services Forensics, VPN, Web Security, Policy & Compliance and Other Services Market AGR [%] – 2013-2020
Table 69 U.S. Financial Services Forensics, VPN, Web Security, Policy & Compliance and Other Services Market Share [%] – 2013-2020
Table 70 U.S. Financial Services Cybersecurity Technology Submarkets [$M] – 2013-2020
Table 71 U.S. Financial Services Cybersecurity Technology Submarkets AGR [%] – 2013-2020
Table 72 U.S. Financial Services Cybersecurity Technology Submarket Shares [%] – 2013-2020
Table 73 Major U.S. Financial Services Cybersecurity Markets [$M] – 2013-2020
Table 74 Major U.S. Financial Services Cybersecurity Markets AGR [%] – 2013-2020
Table 75 Major U.S. Financial Services Cybersecurity Market Shares [%] – 2013-2020
Table 76 U.S. Financial Services Cybersecurity Market by Sector [$M] – 2013-2020
Table 77 U.S. Financial Services Cybersecurity Market AGR [%] by Sector – 2013-2020
Table 78 U.S. Financial Services Cybersecurity Market Shares [%] by Sector – 2013-2020
Table 79 Top Ten U.S. Bank Owners of ATMs – 20121
Table 80 Withdrawals from U.S. ATMs by Type of Institution – 2010
Table 81 U.S. ATM Withdrawals
Table 82 Distribution of U.S. Banks Assets, Employees & Offices (July 1, 2014)
Table 83 U.S. Banking Industry Cybersecurity Submarket [$M] – 2013-2020
Table 84 U.S. Banking Industry Cybersecurity Submarket AGR [%] – 2013-2020
Table 85 U.S. Banking Industry Cybersecurity Submarket Share [%] – 2013-2020
Table 86 Top Ten Writers of Property/Casualty Insurance by Direct Premiums Written 2013
Table 87 Top Ten Writers of Life Insurance/Annuities by Direct Premiums Written 2013
Table 88 Top Ten Commercial Insurance Brokers of U.S. Business by Revenues [$M] – 20111
Table 89 U.S. Insurance Companies Cybersecurity Submarket [$M] – 2013-2020
Table 90 U.S. Insurance Companies Cybersecurity Submarket AGR [%] – 2013-2020
Table 91 U.S. Insurance Companies Cybersecurity Submarket Share [%] – 2013-2020
Table 92 U.S. 45 Top Payment Card Acquirers: Links, Territory of Operation and Contact Info.
Table 93 U.S. 22 Top Payment Card & 22 Top Debit Cards Issuers Data
Table 94 Payment Card Technologies: Magnetic Stripe vs. Chip $ PIN Cards
Table 95 U.S. Payment Card & Mobile Payment Providers and Retailers Cybersecurity Submarket [$M] – 2013-2020
Table 96 U.S. Payment Card & Mobile Payment Providers and Retailers Cybersecurity Submarket AGR [%] – 2013-2020
Table 97 U.S. Payment Card & Mobile Payment Providers and Retailers Cybersecurity Submarket Share [%] – 2013-2020
Table 98 U.S. Government Related Financial Services Sector Cybersecurity Submarket [$M] – 2013-2020
Table 99 U.S. Government Related Financial Services Sector Cybersecurity Submarket AGR [%] – 2013-2020
Table 100 U.S. Government Related Financial Services Sector Cybersecurity Submarket Share [%] – 2013-2020
Table 101 U.S. Stock Brokerages & Exchanges Sector Cybersecurity Submarket [$M] – 2013-2020
Table 102 U.S. Stock Brokerages & Exchanges Sector Cybersecurity Submarket AGR [%] – 2013-2020
Table 103 U.S. Stock Brokerages & Exchanges Sector Cybersecurity Submarket Share [%] – 2013-2020
Table 104 Participation in Defined Benefit and Defined Contribution Pension Plans [%] – 1990-20111
Table 105 U.S. Pension Funds Cybersecurity Submarket [$M] – 2013-2020
Table 106 U.S. Pension Funds Cybersecurity Submarket AGR [%] – 2013-2020
Table 107 U.S. Pension Funds Cybersecurity Submarket Share [%] – 2013-2020
Table 108 FINRA Member Firms Categorization (2009)
Table 109 U.S. Credit Unions, Investment Funds, Accountancy Companies & Other Sectors Cybersecurity Submarket [$M] – 2013-2020
Table 110 U.S. Credit Unions, Investment Funds, Accountancy Companies & Other Sectors Cybersecurity Submarket AGR [%] – 2013-2020
Table 111 U.S. Credit Unions, Investment Funds, Accountancy Companies & Other Sectors Cybersecurity Submarket Share [%] – 2013-2020
Table 112  The Banking, Financial Services, Retail & Payment Services ICT Environmental Change Factors


[Back to top]

U.S. Financial Services: Cybersecurity Systems & Services Market – 2016-2020 – Volume 2

Table 1 Control Objectives vs. PCI DSS Requirements
Table 2 ISO 27001 – 27006 Standards
Table 3 ISO/IEC Standards
Table 4  Compromised Payment Cards: Loss Estimates

Figures

2 Volumes:

U.S. Financial Services: Cybersecurity Systems & Services Market – 2016-2020 – Volume 1

U.S. Financial Services: Cybersecurity Systems & Services Market – 2016-2020 – Volume 2


[Back to top]

U.S. Financial Services: Cybersecurity Systems & Services Market – 2016-2020 – Volume 1

Figure 1 Steps Involved in Financial Account Takeovers
Figure 2 Depository Trust & Clearing Corporation (DTCC) Banking and Financial Services Risk Barometer Survey
Figure 3 Cybersecurity Ecosystem
Figure 4 Prompt Detection & Response is Key to Cybersecurity
Figure 5 Layout of Cybersecurity Solutions & Technologies Infrastructure
Figure 6 The Report Sub-Markets
Figure 7 Major U.S. Banking & Financial Services Cyber Security Market Shares [%] – 2013-2020
Figure 8 U.S. Banking & Financial Services Cyber Security Market Shares [%] by Sector – 2013-2020
Figure 9 Selected Sources of Cyber Threat Information, Based on the U.S. Congress GAO Interviews
Figure 10 E-Commerce Method Segmentation and Payment Mechanism Flow Chart
Figure 11 Payment Card Transaction Process
Figure 12 The Fraction of Non-cash Payments by 33 Countries
Figure 13 Comparison of Non-Cash Transactions [Billion] and Change in Payments’ Mix [%] by Geo. Region and Transaction Method
Figure 14 Cryptocurrency Hot List (12.1.2013)
Figure 15 U.S. Gross Domestic Product of Financial Services, Shares by Component, Excluding Real Estate – 2010
Figure 16 Assets [$B] & Assets Share [%] of the U.S. Banking & Financial Services Sectors
Figure 17 The U.S. Banking, Insurance & Securities Industries Infrastructure
Figure 18 United States: Financial System Linkages to the Rest of the World
Figure 19 Cybercrime Complaints Types in the U.S. – 2007-2011
Figure 20 Fraud, Consumer & Identity Theft Complaints in the U.S. – 2009-2011
Figure 21 Categories of Financial Services Share [%] of Cyber-attack Incidents
Figure 22 Banking & Financial Services [%] Reliance on Outsourcing vs. Other Industries in the U.S.
Figure 23 Banking & Financial Services Share [%] By Attacker Category in the U.S.
Figure 24 Banking & Financial Services Cybercrime: Share [%] By Motivation in the U.S.
Figure 25 Banking & Financial Services Breaches: Share [%] By Root Cause in the U.S.
Figure 26 Banking & Financial Services Average Cybercrime Cost/Annum [$M] per Enterprise in the U.S. – 2010-2013
Figure 27 Global Financial Services Firms’ Attacks Response Time Statistics
Figure 28 U.S. Financial Services Endpoint Security Submarket [$M] – 2013-2020
Figure 29 U.S. Financial Services Endpoint Security Submarket AGR [%] – 2013-2020
Figure 30 U.S. Financial Services Endpoint Security Submarket Share [%] – 2013-2020
Figure 31 U.S. Financial Services Identity and Access Management Submarket [$M] – 2013-2020
Figure 32 U.S. Financial Services Identity and Access Management Submarket AGR [%] – 2013-2020
Figure 33 U.S. Financial Services Identity and Access Management Submarket Share [%] – 2013-2020
Figure 34 U.S. Financial Services Mobile Enterprise Management Submarket [$M] – 2013-2020
Figure 35 U.S. Financial Services Mobile Enterprise Management Submarket AGR [%] – 2013-2020
Figure 36 U.S. Financial Services Mobile Enterprise Management Submarket Share [%] – 2013-2020
Figure 37 U.S. Financial Services Mobile Security Submarket [$M] – 2013-2020
Figure 38 U.S. Financial Services Mobile Security Submarket AGR [%] – 2013-2020
Figure 39 U.S. Financial Services Mobile Security Submarket Share [%] – 2013-2020
Figure 40 Security Information and Event Management (SIEM) Architecture
Figure 41 Security Information and Event Management Solutions
Figure 42 IBM QRadar Security Intelligence Platform
Figure 43 U.S. Financial Services Security Information and Event Management Submarket [$M] – 2013-2020
Figure 44 U.S. Financial Services Security Information and Event Management Submarket AGR [%] – 2013-2020
Figure 45 U.S. Financial Services Security Information and Event Management Submarket Share [%] – 2013-2020
Figure 46 U.S. Financial Services Content Security Submarket [$M] – 2013-2020
Figure 47 U.S. Financial Services Content Security Submarket AGR [%] – 2013-2020
Figure 48 U.S. Financial Services Content Security Submarket Share [%] – 2013-2020
Figure 49 U.S. Financial Services Data Loss Prevention (DLP) Submarket [$M] – 2013-2020
Figure 50 U.S. Financial Services Data Loss Prevention (DLP) Submarket AGR [%] – 2013-2020
Figure 51 U.S. Financial Services Data Loss Prevention (DLP) Submarket Share [%] – 2013-2020
Figure 52 U.S. Financial Services Datacenter Security Submarket [$M] – 2013-2020
Figure 53 U.S. Financial Services Datacenter Security Submarket AGR [%] – 2013-2020
Figure 54 U.S. Financial Services Datacenter Security Submarket Share [%] – 2013-2020
Figure 55 U.S. Financial Services Firewall Submarket [$M] – 2013-2020
Figure 56 U.S. Financial Services Firewall Submarket AGR [%] – 2013-2020
Figure 57 U.S. Financial Services Firewall Submarket Share [%] – 2013-2020
Figure 58 U.S. Financial Services Next Generation Firewall Submarket [$M] – 2013-2020
Figure 59 U.S. Financial Services Next Generation Firewall Submarket AGR [%] – 2013-2020
Figure 60 U.S. Financial Services Next Generation Firewall Submarket Share [%] – 2013-2020
Figure 61 U.S. Financial Services IDS/IPS Submarket [$M] – 2013-2020
Figure 62 U.S. Financial Services IDS/IPS Submarket AGR [%] – 2013-2020
Figure 63 U.S. Financial Services IDS/IPS Submarket Share [%] – 2013-2020
Figure 64 U.S. Financial Services Unified Threat Management Submarket [$M] – 2013-2020
Figure 65 U.S. Financial Services Unified Threat Management Submarket AGR [%] – 2013-2020
Figure 66 U.S. Financial Services Unified Threat Management Submarket Share [%] – 2013-2020
Figure 67 U.S. Financial Services Cloud-Based Services Submarket [$M] – 2013-2020
Figure 68 U.S. Financial Services Cloud-Based Services Submarket AGR [%] – 2013-2020
Figure 69 U.S. Financial Services Cloud-Based Services Submarket Share [%] – 2013-2020
Figure 70 U.S. Financial Services Vulnerability/Risk Management & Managed Security Services Submarket [$M] – 2013-2020
Figure 71 U.S. Financial Services Vulnerability/Risk Management & Managed Security Services Submarket AGR [%] – 2013-2020
Figure 72 U.S. Financial Services Vulnerability/Risk Management & Managed Security Services Submarket Share [%] – 2013-2020
Figure 73 U.S. Financial Services Consulting Market [$M] – 2013-2020
Figure 74 U.S. Financial Services Consulting Market AGR [%] – 2013-2020
Figure 75 U.S. Financial Services Consulting Market Share [%] – 2013-2020
Figure 76 U.S. Financial Services Integration Services Market [$M] – 2013-2020
Figure 77 U.S. Financial Services Integration Services Market AGR [%] – 2013-2020
Figure 78 U.S. Financial Services Integration Services Market Share [%] – 2013-2020
Figure 79 U.S. Financial Services Education and Training Services Market [$M] – 2013-2020
Figure 80 U.S. Financial Services Education and Training Services Market AGR [%] – 2013-2020
Figure 81 U.S. Financial Services Education and Training Services Market Share [%] – 2013-2020
Figure 82 U.S. Financial Services Forensics, VPN, Web Security, Policy & Compliance and Other Services Market [$M] – 2013-2020
Figure 83 U.S. Financial Services Forensics, VPN, Web Security, Policy & Compliance and Other Services Market AGR [%] – 2013-2020
Figure 84 U.S. Financial Services Forensics, VPN, Web Security, Policy & Compliance and Other Services Market Share [%] – 2013-2020
Figure 85 Major U.S. Financial Services Cybersecurity Markets [$M] – 2013-2020
Figure 86 Major U.S. Financial Services Cybersecurity Markets AGR [%] – 2013-2020
Figure 87 Major U.S. Financial Services Cybersecurity Market Shares [%] – 2013-2020
Figure 88 U.S. Financial Services Software Security Technology Submarkets [$M] – 2013-2020
Figure 89 U.S. Financial Services Software Security Technology Submarkets AGR [%] – 2013-2020
Figure 90 U.S. Financial Services Software Security Technology Submarket Shares [%] – 2013-2020
Figure 91 U.S. Financial Services Network Security Technology Submarkets [$M] – 2013-2020
Figure 92 U.S. Financial Services Network Security Technology Submarkets AGR [%] – 2013-2020
Figure 93 U.S. Financial Services Network Security Technology Submarket Shares [%] – 2013-2020
Figure 94 U.S. Financial Services Cybersecurity Market by Sector [$M] – 2013-2020
Figure 95 U.S. Financial Services Cybersecurity Market AGR [%] by Sector – 2013-2020
Figure 96 U.S. Financial Services Cybersecurity Market Shares [%] by Sector – 2013-2020
Figure 97 U.S. Banking Industry Cybersecurity Submarket [$M] – 2013-2020
Figure 98 U.S. Banking Industry Cybersecurity Submarket AGR [%] – 2013-2020
Figure 99 U.S. Banking Industry Cybersecurity Submarket Share [%] – 2013-2020
Figure 100 U.S. Insurance Companies Cybersecurity Submarket [$M] – 2013-2020
Figure 101 U.S. Insurance Companies Cybersecurity Submarket AGR [%] – 2013-2020
Figure 102 U.S. Insurance Companies Cybersecurity Submarket Share [%] – 2013-2020
Figure 103 Relationship between EMVCo Specifications, Payment System, & Payment System Products.
Figure 104 Chip and PIN Card and Point of Sale Reader
Figure 105 Global Adoption Rate of EMV (Chip and PIN) Cards by Region-Country
Figure 106 Chip and PIN Card Processing
Figure 107 U.S. Payment Card & Mobile Payment Providers and Retailers Cybersecurity Submarket [$M] – 2013-2020
Figure 108 U.S. Payment Card & Mobile Payment Providers and Retailers Cybersecurity Submarket AGR [%] – 2013-2020
Figure 109 U.S. Payment Card & Mobile Payment Providers and Retailers Cybersecurity Submarket Share [%] – 2013-2020
Figure 110 U.S. Government Related Financial Services Sector Cybersecurity Submarket [$M] – 2013-2020
Figure 111 U.S. Government Related Financial Services Sector Cybersecurity Submarket AGR [%] – 2013-2020
Figure 112 U.S. Government Related Financial Services Sector Cybersecurity Submarket Share [%] – 2013-2020
Figure 113 Threat Profile for Securities Markets
Figure 114 U.S. Stock Brokerages & Exchanges Sector Cybersecurity Submarket [$M] – 2013-2020
Figure 115 U.S. Stock Brokerages & Exchanges Sector Cybersecurity Submarket AGR [%] – 2013-2020
Figure 116 U.S. Stock Brokerages & Exchanges Sector Cybersecurity Submarket Share [%] – 2013-2020
Figure 117 U.S. Pension Funds Asset Allocation – 2013
Figure 118 IRA Market Share by Holder – 2011
Figure 119 Average Asset Allocation for all 401K Plan Balances – 2010
Figure 120 The U.S. Retirement Assets ($ trillions) by Market Share [%]
Figure 121 U.S. Pension Funds Cybersecurity Submarket [$M] – 2013-2020
Figure 122 U.S. Pension Funds Cybersecurity Submarket AGR [%] – 2013-2020
Figure 123 U.S. Pension Funds Cybersecurity Submarket Share [%] – 2013-2020
Figure 124 Asset Management Industry Overview
Figure 125 Top 20 Asset Management Firms by Assets [$B] Under Management (as of January 2013)
Figure 126 U.S. Leading accounting firms – 2014 by U.S. Revenue [$B]
Figure 127 U.S. Credit Unions, Investment Funds, Accountancy Companies & Other Sectors Cybersecurity Submarket [$M] – 2013-2020
Figure 128 U.S. Credit Unions, Investment Funds, Accountancy Companies & Other Sectors Cybersecurity Submarket AGR [%] – 2013-2020
Figure 129 U.S. Credit Unions, Investment Funds, Accountancy Companies & Other Sectors Cybersecurity Submarket Share [%] – 2013-2020
Figure 130 Diagram of the Cybercriminal Attack
Figure 131 Number of Institutions Targeted by Each Trojan
Figure 132 A Financial Service Enterprise Cybersecurity Platform
Figure 133 Cloud, Convergence, Consolidation and Mobility Infrastructure of a Bank
Figure 134 Banking, Financial Services, Retail & Payment Services Cybercrime Risk Frame
Figure 135 Cyber Risk Management Process
Figure 136 Common Gaps in Standard Policies
Figure 137 Cyber Insurance Coverage
Figure 138 The Differentiated Cyber-Security Ecosystem
Figure 139 Elements Required for a Financial Enterprise Premium Cybersecurity Set-up
Figure 140  The Financial Sector Cyber Risks Roadmap


[Back to top]

U.S. Financial Services: Cybersecurity Systems & Services Market – 2016-2020 – Volume 2

Figure 1 Three Layers of Cyberspace
Figure 2 Payment Card Transaction Process

Questions about this report?

Contact Sales: 1-571-527-1010 or Analysts: 1-202-455-0966

  • Have a question about U.S. Financial Services Cyber Security Market - 2016-2020
    Please fill out all fields in the form below and click "Submit" to send your question.
    Our representative will review your question and contact you with an answer as soon as possible.
  • 2+2=
  • This field is for validation purposes and should be left unchanged.
1
Interested in this report? Need more information?

You may also like…

X
Powered By