Top
HSRCNon-Lethal Weapons (NLW): Industry, Technologies & Global Market 2014-2020
Placeholder

Non-Lethal Weapons (NLW): Industry, Technologies & Global Market 2014-2020

Outcry From Social Networks and New Media Forces Governments to Invest Billions in Less Lethal Weapons

  • Q2 2014
  • 425
  • 257
    • 3450 $
    • 4450 $
    • 6950 $
    • 8000 $

    Small Businesses, Startups & Academia - Up to 50% Off

Quantity
IBM
Amazon
Sandia National Lab
HITACHI
Thales
Smiths Detection
Nuctech
Korea Internet & Security Agency
L3Harris
Huawei
Leidos
NEC
Toshiba
Deloitte
MAG

Want to customize this report?

If you purchase this report, you are entitled to a 30% discount towards customizing it, to better fit your market research and strategic needs. Our Custom Research and Industry Insights Department will work with you to better understand your information gaps and strategic needs and will provide you with a tailor-made market research report within a short period of time.

Why Choose Us?

30+ Years of Experience
We are a multidisciplinary team of Transformational Technologies industry experts with over 30 years of experience.
Gold Standard
With over 950 private sector clients (73% repeat customers), including major defense and security vendors, and Forbes Global 2000 companies, HSRC earned the reputation as the industry’s Gold Standard for Transformational Technologies Market Reports.
Tailored Research Services
Provide you with clear, actionable recommendations designed to empower decision making and to help you exploit emerging opportunities in the Transformational Technologies industries.
Information Security
Your personal information is safe and secure.

From: $3,450

SKU: 7103-1 Category:

Description

Over the next ten years, the Non-Lethal Weapons (NLW) market is forecasted to emerge as a key domain for asymmetric warfare, law enforcement and technology providers. Following lessons learned in Ukraine, Syria, Egypt, Israel, China and Afghanistan, governments worldwide have undoubtedly understood the urgent need for non-lethal weapons. Asymmetric warfare, street riots, insurgency and mass demonstrations over the last decade have revealed the loopholes in the security dogma of the 21st century.

Non-Lethal Weapons (NLW): Industry, Technologies & Global Market 2014-2020
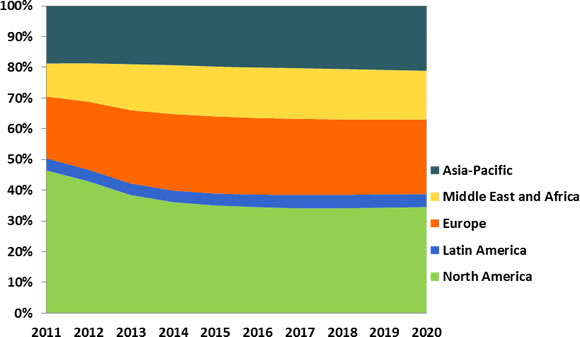
Global Non-Lethal Weapons Market Shares by Region [%] – 2011-2020

There is a growing demand from combatant commanders, law enforcement officers and political establishment for less lethal weapons capabilities. This demand is driven by the need to help them win the hearts and minds of the non-combatant population and prevent world outcry and media attention due to non-combatant casualties. As a result, many governments have entered into non-lethal weapons R&D and procurement dedicated to the full spectrum of public safety, law enforcement, crowd control and asymmetric warfare. In view of these changes in the field, technological advances have facilitated the development of new types of non-lethal weapons.

Non-Lethal Weapons (NLW): Industry, Technologies & Global Market 2014-2020
Maritime Anti-Piracy Non-Lethal Weapons
Source: USN
NLW Beanbag Shells

The “Non-Lethal Weapons: Industry, Technologies & Global Market – 2014-2020” report is a comprehensive study of the emerging NLW market. In this report, HSRC analysts forecast that due to accelerated CAGR of 11% from 2014-2020, the NLW market will double by 2020.

With 425 pages, 131 tables and 126 figures, the report analyzes in detail the multibillion-dollar global Non-Lethal Weapons market, industry and technology trends. The report analyzes each and every dollar of the industry’s revenues and provides data and analysis on 89 submarkets including 2011-2013 submarket data and 2014-2020 forecasts and analyses. The report addresses the “money trail” via 5 viewpoints:

  • 5 geographical regions
  • 17 countries
  • 2 vertical markets
  • 4 application-technologies
  • Products & ammunition pricing
Non-Lethal Weapons (NLW): Industry, Technologies & Global Market 2014-2020
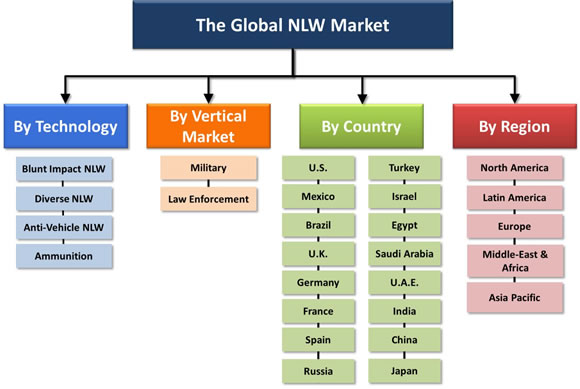
The NLW Report Market Segmentation

The report analyzes the Non-Lethal Weapons industry and technologies from several perspectives, including:

  • Market forecast by application: (e.g., blunt impact NLW, disperse NLW, anti-vehicle NLW, non-lethal ammunition, NLW RDT&E)
  • Market forecast by user sector: military and law enforcement sectors
  • Markets by Region: North America, Latin America, Europe, Middle East and Africa, Asia-Pacific
  • National markets in 17 leading countries: U.S., U.K., Germany, France, Saudi Arabia, China, India, Japan, South Korea, Israel, Brazil. Mexico, Spain, Russia, Turkey, Egypt, and the U.A.E
  • The NLW Industry: 45 leading vendors profiles, products, prices, performance and RDT&E programs
  • Market analysis (e.g., market drivers & inhibitors, SWOT analysis)
  • Business environment (e.g., competitive analysis)
  • More than 40 Current and 13 pipeline NLW technologies
  • Business opportunities and challenges

Table of Contents

Download TOC as PDF

<t

1 Executive Summary
1.1 Major Findings
1.2 Major Conclusions
1.3 Global Non-Lethal Weapons (NLW) Market Outlook
1.3.1 Global Non-Lethal Weapons Market by Technology – 2011-2020
1.3.2 Global Non-Lethal Weapons Market by Vertical Market (User Sector) – 2011-2020
1.3.3 Global Non-Lethal Weapons Market by Region – 2011-2020
1.3.4 Global Non-Lethal Weapons Market by Country – 2011-2020
  GLOBAL MARKET
2 NLW Market Drivers
3 NLW Market Inhibitors
4 Non-Lethal Weapons: Business Opportunities & Challenges
5 Non-Lethal Weapons HLS & Public Safety Industry: SWOT Analysis
5.1 Strengths
5.2 Weaknesses
5.3 Opportunities
5.4 Threats
6 NLW Market Competitive Analysis
7 Global Non-Lethal Weapons Market by Technology – 2011-2020
8 Global Non-Lethal Weapons Market by Vertical Market (User Sector) – 2011-2020
8.1 Overview
8.2 Global Military NLW Market – 2011-2020
8.3 Global Law Enforcement NLW Market – 2011-2020
9 Global Non-Lethal Weapons Market by Region – 2011-2020
9.1 Total NLW Market by Region – 2011-2020
9.2 Military NLW Market by Region – 2011-2020
9.3 Law Enforcement NLW Market by Region – 2011-2020
10 Global Non-Lethal Weapons Market by Country – 2011-2020
  REGIONAL MARKETS
11 North America Non-Lethal Weapons Market – 2011-2020
11.1 North America NLW Market by Vertical Market (User Sector) – 2011-2020
11.2 North America Military NLW Market – 2011-2020
11.3 North America Law Enforcement NLW Market – 2011-2020
12 Latin America Non-Lethal Weapons Market – 2011-2020
12.1 Latin America NLW Market by Vertical Market (User Sector) – 2011-2020
12.2 Latin America Military NLW Market – 2011-2020
12.3 Latin America Law Enforcement NLW Market – 2011-2020
13 Europe Non-Lethal Weapons Market – 2011-2020
13.1 Europe NLW Market by Vertical Market (User Sector) – 2011-2020
13.2 Europe Military NLW Market – 2011-2020
13.3 Europe Law Enforcement NLW Market – 2011-2020
14 Middle East Non-Lethal Weapons Market – 2011-2020
14.1 Middle East NLW Market by Vertical Market (User Sector) – 2011-2020
14.2 Middle East Military NLW Market – 2011-2020
14.3 Middle East Law Enforcement NLW Market – 2011-2020
15 Asia-Pacific Non-Lethal Weapons Market – 2011-2020
15.1 South Korea NLW Market Background
15.2 Australia NLW Market Background
15.3 Asia-Pacific NLW Market by Vertical Market (User Sector) – 2011-2020
15.4 Asia-Pacific Military NLW Market – 2011-2020
15.5 Asia-Pacific Law Enforcement NLW Market – 2011-2020
  NATIONAL MARKETS
16 U.S. Non-Lethal Weapons Market – 2011-2020
16.1 Introduction
16.2 U.S. Law Enforcement Agencies Data
16.3 U.S. DOD NLW
16.4 DoD and DHS NLW Technologies Programs
16.4.1 The DoD Joint Non-Lethal Weapons Programs
16.4.2 Joint Integration Program (JIP)
16.4.3 U.S. Army Non-Lethal Weapons Program
16.4.4 U.S. Marine Corps Non-Lethal Weapons Programs
16.4.5 U.S. Navy Non-Lethal Weapons Program
16.4.6 U.S. Air Force Non-Lethal Weapons Program
16.4.7 U.S. Special Operations Command Non-lethal Weapons Program
16.4.8 U.S. Coast Guard Non-lethal Weapons Program
16.5 U.S. NLW Market by Vertical Market (User Sector) – 2011-2020
16.6 U.S. Military NLW Market – 2011-2020
16.7 U.S. Law Enforcement NLW Market – 2011-2020
17 Mexican NLW Market – 2011 -2020
17.1 Mexico Market Background
17.1.1 Geopolitical Background
17.1.2 Facts & Figures
17.1.3 Mexico Security Market
17.1.4 Mexico Security Industry
17.1.5 Terror & Crime in Mexico
17.1.5.1 Terror in Mexico
17.1.5.2 Crime in Mexico
17.1.6 Mexico HLS & Public Safety Agencies
17.2 Market Background
17.3 Mexican NLW Market by Vertical Market (User Sector) – 2011-2020
17.4 Mexican Military NLW Market – 2011-2020
17.5 Mexican Law Enforcement NLW Market – 2011-2020
18 Brazilian Non-Lethal Weapons Market – 2011-2020
18.1 Brazil Market Background
18.1.1 Facts & Figures
18.1.2 Brazil Geopolitical Analysis
18.1.3 Security Market
18.1.4 Terror & Crime in Brazil
18.1.4.1 Crime
18.1.4.2 Counterterrorism-Related Activities
18.1.5 Legislation & Law Enforcement
18.1.6 Brazil HLS & Public Safety Agencies
18.2 Market Background
18.3 Brazilian NLW Market by Vertical Market (User Sector) – 2011-2020
18.4 Brazilian Military NLW Market – 2011-2020
18.5 Brazilian Law Enforcement NLW Market – 2011-2020
19 U.K. Non-Lethal Weapons Market – 2011-2020
19.1.1 Facts & Figures
19.1.2 Economy
19.1.3 U.K. Security Market
19.1.4 U.K. Security Industry
19.1.5 Terror & Crime in the U.K.
19.1.5.1 Countering International Terrorism
19.1.6 Legislation & Law Enforcement
19.1.7 U.K. HLS & Public Safety Agencies
19.2 Market Background
19.3 U.K. NLW Market by Vertical Market (User Sector) – 2011-2020
19.4 U.K. Military NLW Market – 2011-2020
19.5 U.K. Law Enforcement NLW Market – 2011-2020
20 German Non-Lethal Weapons Market – 2011-2020
20.1.1 Facts & Figures
20.1.2 Germany Short Range Geopolitical Outlook
20.1.3 Economy
20.1.4 Security Market
20.1.5 Security Industry
20.1.6 Terror & Crime in Germany
20.1.7 Germany HLS & Public Safety Agencies
20.2 German NLW Market by Vertical Market (User Sector) – 2011-2020
20.3 German Military NLW Market – 2011-2020
20.4 German Law Enforcement NLW Market – 2011-2020
21 French Non-Lethal Weapons Market – 2011-2020
21.1.1 Facts & Figures
21.1.2 Economy
21.1.3 Security Market
21.1.4 HLS Market
21.1.5 France Security Industry Companies
21.1.6 Terror & Crime in France
21.1.7 Legislation & Law Enforcement
21.1.8 France HLS & Public Safety Agencies
21.2 Market Background
21.3 French NLW Market by Vertical Market (User Sector) – 2011-2020
21.4 French Military NLW Market – 2011-2020
21.5 French Law Enforcement NLW Market – 2011-2020
22 Spanish Non-Lethal Weapons Market – 2011-2020
22.1 Market Background
22.1.1 Facts & Figures
22.1.2 Economy
22.1.3 Spain Security Market
22.1.4 Terror & Crime in Spain
22.1.4.1 Terror in Spain
22.1.4.2 2012 Terrorist Incidents
22.1.5 Legislation & Law Enforcement
22.1.6 Spain HLS & Public Safety Agencies
22.2 Spanish NLW Market by Vertical Market (User Sector) – 2011-2020
22.3 Spanish Military NLW Market – 2011-2020
22.4 Spanish Law Enforcement NLW Market – 2011-2020
23 Russian Non-Lethal Weapons Market – 2011-2020
23.1 Geopolitical Background
23.1.1 Facts & Figures
23.1.2 Economy
23.1.3 Security Market in Russia
23.1.4 Security Companies in Russia
23.2 Terror & Crime in Russia
23.2.1 Terror in Russia
23.2.2 2013 Terrorist Incidents
23.2.3 Crime in Russia
23.2.4 Legislation & Law Enforcement in Russia
23.3 Russia HLS & Public Safety Agencies
23.4 Market Background
23.5 Russian NLW Market by Vertical Market (User Sector) – 2011-2020
23.6 Russian Military NLW Market – 2011-2020
23.7 Russian Law Enforcement NLW Market – 2011-2020
24 Turkish Non-Lethal Weapons Market – 2011-2020
24.1 Market Background
24.1.1 Facts & Figures
24.1.2 Turkey Security Market
24.1.3 Turkey Security Industry
24.1.4 Terror & Crime in Turkey
24.1.5 2012 Terrorist Incidents
24.1.6 Legislation & Law Enforcement
24.1.7 Turkey HLS & Public Safety Agencies
24.2 Turkish NLW Market by Vertical Market (User Sector) – 2011-2020
24.3 Turkish Military NLW Market – 2011-2020
24.4 Turkish Law Enforcement NLW Market – 2011-2020
25 Israeli Non-Lethal Weapons Market – 2011-2020
25.1 Geopolitical Background
25.1.1 Facts & Figures
25.1.2 Israel Economy
25.1.3 Israel Security Market
25.1.4 Israel Homeland Security Industry
25.1.5 Israel Defense Forces
25.1.6 The Israeli National Police (INP),
25.2 Terror, Crime & Natural Disasters in Israel
25.2.1 Continued Terrorist Threats
25.2.2 2012 Terrorist Incidents
25.3 The Israeli NLW Market Background
25.4 Israeli NLW Market by Vertical Market (User Sector) – 2011-2020
25.5 Israeli Military NLW Market – 2011-2020
25.6 Israeli Law Enforcement NLW Market – 2011-2020
26 Egyptian Non-Lethal Weapons Market – 2011-2020
26.1 Egyptian NLW Market by Vertical Market (User Sector) – 2011-2020
26.2 Egyptian Military NLW Market – 2011-2020
26.3 Egyptian Law Enforcement NLW Market – 2011-2020
27 Saudi Arabian Non-Lethal Weapons Market – 2011-2020
27.1 Saudi Arabia Market Background
27.1.1 Economy
27.1.2 Terror in Saudi Arabia
27.1.2.1 2012 Terrorist Incidents
27.1.3 Legislation & Law Enforcement
27.1.4 Saudi Arabia HLS & Public Safety Agencies
27.2 Market Background
27.3 Saudi Arabian NLW Market by Vertical Market (User Sector) – 2011-2020
27.4 Saudi Arabian Military NLW Market – 2011-2020
27.5 Saudi Arabian Law Enforcement NLW Market – 2011-2020
28 UAE Non-Lethal Weapons Market – 2011-2020
28.1.1 Facts & Figures
28.1.2 Economy
28.1.3 U.A.E. Security Market
28.1.4 Counterterrorism
28.1.5 Legislation & Law Enforcement
28.1.6 U.A.E. HLS Agencies
28.2 Market Background
28.3 UAE NLW Market by Vertical Market (User Sector) – 2011-2020
28.4 UAE Military NLW Market – 2011-2020
28.5 UAE Law Enforcement NLW Market – 2011-2020
29 Indian Non-Lethal Weapons Market – 2011-2020
29.1.1 Geopolitical Background
29.1.2 India Short Range Geopolitical Outlook
29.1.3 Economy
29.1.4 Security Industry
29.1.5 Security Market
29.1.6 Terror in India
29.1.7 Legislation & Law Enforcement
29.1.8 India HLS & Public Safety Agencies
29.2 Market Background
29.3 Indian NLW Market by Vertical Market (User Sector) – 2011-2020
29.4 Indian Military NLW Market – 2011-2020
29.5 Indian Law Enforcement NLW Market – 2011-2020
30 Chinese Non-Lethal Weapons Market – 2011-2020
30.1 Geopolitical Background
30.1.1 Facts & Figures
30.1.2 Economy
30.1.3 China Security Market
30.1.4 Terror
30.2 China HLS & Public Safety Agencies
30.2.1 China Ministry of State Security
30.3 Market Background
30.4 Chinese NLW Market by Vertical Market (User Sector) – 2011-2020
30.5 Chinese Military NLW Market – 2011-2020
30.6 Chinese Law Enforcement NLW Market – 2011-2020
31 Japanese Non-Lethal Weapons Market – 2011-2020
31.1 Facts & Figures
31.2 Economy
31.3 Security Market
31.4 Japan Security Industry
31.5 Japan HLS & Public Safety Agencies
31.6 Market Background
31.7 Japanese NLW Market by Vertical Market (User Sector) – 2011-2020
31.8 Japanese Military NLW Market – 2011-2020
31.9 Japanese Law Enforcement NLW Market – 2011-2020
  TECHNOLOGIES
32 Non-Lethal Weapon Technologies
32.1 Several Non-Lethal Weapons & Systems Categories
32.1.1 Kinetic Non-Lethal Weapons
32.1.2 Direct-Fired Non-Lethal Projectiles
32.1.3 Concurrently Launched Multiple Kinetic Projectiles
32.1.4 NLW Sting-ball Grenades
32.1.5 Chemical Non-Lethal Systems
32.1.6 Area Denial NLW Procedures:
32.1.7 Optical NLW Incapacitation Devices
32.1.8 Acoustical Non-Lethal Devices
32.1.9 Electro-Muscular NLW
32.2 Counter-Personnel NLW Technologies
32.2.1 Overview
32.2.2 Electromagnetic NLW Technologies
32.2.2.1 Microwave NLW
32.2.2.2 Electromagnetic Launcher
32.2.2.3 Electromagnetic Mines
32.2.2.4 Laser Based NLW
32.2.2.5 Multi-Purpose Dazzling Laser
32.2.2.6 Pain Generation Laser
32.2.3 Active Denial Weapon Microwave Technology
32.2.4 Chemical NLW Technologies
32.2.5 Acoustic NLW Technologies
32.2.5.1 Overview
32.2.5.2 Directional Multi-Effects Acoustic System
32.2.6 Mechanical NLW Technologies
32.2.6.1 Non-lethal Barriers and Entanglements
32.2.6.2 Rapid Barriers
32.2.6.3 Nets & Entanglement Techniques
32.2.7 Kinetic NLW Technologies
32.2.7.1 Overview
32.2.7.2 Stun Devices
32.2.7.3 Stun Batons
32.2.7.4 Vortex Generator
32.2.7.5 Airbag Stoppers
32.2.7.6 Paints and Dyes
32.2.8 Water Cannons
32.2.9 Area Denial and Barrier Technologies
32.2.10 Combined Technologies
32.3 Counter-Material NLW Technologies
32.3.1 Overview
32.3.2 Electromagnetic Technologies
32.3.2.1 Radio Frequency (RF) NLW Devices
32.3.2.2 Laser
32.3.3 Chemical Technologies
32.3.3.1 Chemical Agents
32.3.3.2 Slippery Foams
32.3.3.3 Sticky Foams
32.3.3.4 Super-Adhesive Substances
32.3.3.5 Super-Caustic Substances/Liquid Metal Embrittlement
32.3.3.6 Graphite Powders
32.3.4 Biological Technologies
32.3.5 Mechanical Technologies
32.3.5.1 Rapid Barriers
32.3.5.2 Nets & Entanglement Techniques
32.3.5.3 Tire Puncturing Techniques
33 NLW Technology Outlook-2014-2022
33.1 Counter-Personnel NLW Outlook
33.1.1 Improved Flash Bang Grenade
33.1.2 Airburst Non-Lethal Munitions
33.1.3 Active Denial Tech System
33.1.4 MK19 Non-Lethal Munitions
33.1.5 Joint Non-Lethal Warning Munitions
33.1.6 40mm Human-Electro-Muscular Incapacitation Projectile
33.1.7 Mission Payload Module
33.1.8 Distributed Sound and Light Array
33.2 Counter-Material Non-Lethal Technologies Outlook
33.2.1 Vehicle Lightweight Arresting Device Single Net Solution and Remote Deployment Device
33.2.2 Pre-emplaced Electric Vehicle Stopper
33.2.3 Small Vessel Stopping Entanglement
33.2.4 Multi-Frequency Radio-Frequency Vehicle Stopper
33.2.5 High Power Microwave Vehicle Stopper
34 Non-Lethal Weapons Business Opportunities
  PRODUCTS AND VENDORS
35 Non-lethal Products
35.1 Blunt Impact NLW-Kinetic Munitions
35.3 Diverse Non-Lethal Weapons
35.3.1 Background – Weapons that Halt or Disperse People
35.3.2 Electro-Shock Stun Weapons (Taser)
35.3.3 Stun Grenades
35.3.4 Laser Scatters and Dazzlers
35.3.5 DF/HF Lasers
35.3.6 Foams
35.3.7 Water Cannons
35.3.8 High Intensity Directed Acoustics (HIDA)
35.3.9 Tear Gas and Pepper Spray
35.3.10 Stink Bombs
35.3.11 Calmatives
35.3.12 Acoustic Hailing Devices
35.3.13 Optical Distracters
35.3.14 Active Denial System
35.3.15 Nets
35.3.16 Chatsatsit (Gravel Thrower)
35.3.17 MAUL (Multi-shot Accessory Under-barrel Launcher)
35.3.18 Firestorm Grenade Launcher
35.4 Anti-Vehicle Non-Lethal Weapons
35.4.1 Caltrops
35.4.2 Stinger Spike Strips
35.4.3 Nets
35.4.4 Barriers
35.4.5 Slippery Foams
36 Leading NLW Vendors
36.1 Aardvark Tactical, Inc.
36.2 Able 2 Products Company
36.3 Alliant Techsystems
36.4 AMTEC
36.5 BAE Systems plc
36.6 Bazalt
36.7 Boeing
36.8 Centech
36.9 Chemring Defense
36.10 Combined Tactical Systems, Inc.
36.11 Defense Technology Corp.
36.12 Fiocchi
36.13 FN Herstal
36.14 Goodrich Corporation
36.15 Heckler and Koch
36.16 General Dynamics Corporation
36.17 ISPRA
36.18 JAYCOR
36.19 Kratos Defense & Security Solutions, Inc.
36.20 L-3 Communications
36.21 Lamperd Less Lethal Inc.
36.22 LE Systems, Inc.
36.23 LRAD Corporation
36.24 Mace Security International, Inc.
36.25 Megaray
36.26 Metal Storm Limited
36.27 Mikor
36.28 MK Ballistic Systems
36.29 Mossberg
36.30 NonLethal Technologies, Inc.
36.31 Penn Arms, Inc.
36.32 PepperBall Technologies
36.33 Policske Strojirny
36.34 PW Defense
36.35 Raytheon
36.36 Remington Arms Company
36.37 Royal Ordnance
36.38 SEA Technology
36.39 Security Devices International Inc.
36.40 SNPE
36.41 Taser International
36.42 TFM
36.43 Universal Propulsion
36.44 Verney Carron
36.45 ZARC International, Inc.
  APPENDICES
37 Appendix A: Less-Lethal Weapons Legislation
38 Appendix B: Less-Lethal Products: Prices & Description
38.1 Expandable Baton
38.2 Wooden Baton
38.3 Portable Bullhorn
38.4 Ground-Mounted Bullhorn
38.5 Individual Voice Amplification System (M7)
38.6 High-Intensity Light
38.7 Individual High-Intensity Light
38.8 Individual High-Intensity Light Accessory Kit
38.9 Disposable Restraint System
38.10 Individual Riot Control Agent Dispenser
38.11 Inert Individual Riot Control Agent Dispenser
38.12 Midsized Riot Control Agent Dispensers
38.13 High Volume Output High-Capacity Oleoresin Capsicum (OC) Dispenser
38.14 Squad Riot Control Agent Dispenser
38.15 Refill Unit Riot Control Agent (Live)
38.16 12-Gauge Shotgun With High-Intensity Light Kit
38.17 12-Gauge Gunstock Carrier (6 Round)
38.18 12-Gauge Launching Cup
38.19 Caltrops
38.20 Roadside Spike Strip
38.21 Riot Training Suit With Accessories
38.22 Riot Training Bag
38.23 12-Gauge Dummy Round
38.24 12-Gauge Point Round
38.25 12-Gauge Area Round
38.26 12-Gauge Diversionary/Flash-Bang Round
38.27 12-Gauge Launching Cup Cartridge
38.28 12-Gauge Beanbag Round
38.29 40 mm Area Round
38.30 40 mm Foam Rubber Baton Round
38.31 40 mm Sponge Point Grenade
38.32 5.56 Point Round
38.33 5.56 Area Round
38.34 Diversionary/Flash-Bang Stun Hand Grenade
38.35 Rubber Ball Hand Grenade
38.36 Inert Rubber Ball Hand Grenade
38.37 Light Vehicle Obscurant Smoke System (LVOSS)
38.38 66 mm LVOSS Canister (Rubber Ball)
38.39 66 mm LVOSS Canister (Diversionary/Flash-Bang)
38.40 66 mm Riot Control Grenade (L96A1)
38.41 66 mm Riot Control Training Grenade (L97A1)
38.42 Modular Crowd Control Munition
38.43 Portable Vehicle-Arresting Barrier (PVAB)
38.44 Dissuader Laser Illuminator
38.45 12-Gauge Rubber-Fin Stabilized Projectile Round
38.46 12-Gauge Rubber Stingball Round
38.47 Running Gear Entanglement System
38.48 Copper Solid Sabot Slugs
38.49 12-Gauge Peacekeeper
38.50 ARWEN®37 mm Weapon System
38.51 SAGE SL-6®37 mm Weapon System
38.52 SAGE SL-1®37 mm Weapon System
38.53 M-26 Advanced Taser
38.54 40 mm Rifled Barrel Launcher With Mounted Holographic Site
38.55 Pyrotechnic Grenade No. 2, CS
38.56 Pyrotechnic Grenade No. 3, CS
38.57 Pyrotechnic Grenade, Triple Charger
38.58 37 mm Scat Shell, CS
38.59 37 mm Impact Munition, Stinger
38.60 37 mm Impact Munition (Kinetic), Foam Baton
38.61 12-Gauge Impact Munition, Beanbag, Super Sock™
38.62 Aerosol Disburser MK-46? OC
38.63 Aerosol Disburser, ProtectoJet 5? OC/CS
38.64 Aerosol Disburser, OC/CS, MK-9
38.65 MK-4 Handheld OC Dispenser
38.66 T-16 OC Nonpyrotechnic Expulsion Grenade
38.67 No. 15 OC/CS Rubber Ball Munition
38.68 PepperBall™
38.69 No. 15 Stinger?Grenade
38.70 No. 20 37 mm Fired Foam Batons
38.71 37 mm Beanbag Round
38.72 Wooden Riot Baton
38.73 Hot PAVA Powder Projectiles PC3-R375-8
38.74 Hot PAVA Powder Projectiles PC3-R375-1
38.75 Hot PAVA Powder Projectiles PC3-R375-2
38.76 Hot PAVA Powder Projectiles PC3-R375-4
38.77 Paintballs Clear 8000/CASE .43C 2000CL43

Tables

Table 1 Major NLW Technologies
Table 2 Global Non-Lethal Weapons Market [$M] by Technology – 2011-2020
Table 3 Global Non-Lethal Weapons Market [$M] by Vertical Market – 2011-2020
Table 4 Global Non-Lethal Weapons Market by Region [$M] – 2011-2020
Table 5 Global Cumulative 2011-2020 NLW Market by User Sector & Country
Table 6 Non-Lethal Weapons Market: Business Opportunities
Table 7 Global Non-Lethal Weapons Market [$M] by Technology – 2011-2020
Table 8 Global Non-Lethal Weapons Market [$M] by Vertical Market – 2011-2020
Table 9 Global Non-Lethal Weapons Market Annual Growth Rates [%] by Vertical Market – 2011-2020
Table 10 Global Non-Lethal Weapons Market Shares [%] by Vertical Market – 2011-2020
Table 11 Global Military Non-Lethal Weapons Market [$M] & AGR [%] – 2011-2020
Table 12 Global Law Enforcement Non-Lethal Weapons Market [$M] & AGR [%] – 2011-2020
Table 13 Global Non-Lethal Weapons Market by Region [$M] – 2011 – 2020
Table 14 Military Non-Lethal Weapons Market by Region [$M] – 2011 – 2020
Table 15 Law Enforcement Non-Lethal Weapons Market by Region [$M] – 2011-2020
Table 16 Global Cumulative 2011-2020 NLW Market by User Sector & Country
Table 17 North America Non-Lethal Weapons Market [$M] by Vertical Market – 2011-2020
Table 18 North America Non-Lethal Weapons Market Annual Growth Rates [%] by Vertical Market – 2011-2020
Table 19 North America Non-Lethal Weapons Market Shares [%] by Vertical Market – 2011-2020
Table 20 North America Military Non-Lethal Weapons Market [$M] & AGR [%] – 2011-2020
Table 21 North America Law Enforcement Non-Lethal Weapons Market [$M] & AGR [%] – 2011-2020
Table 22 Latin America Non-Lethal Weapons Market [$M] by Vertical Market – 2011-2020
Table 23 Latin America Non-Lethal Weapons Market Annual Growth Rates [%] by Vertical Market – 2011-2020
Table 24 Latin America Non-Lethal Weapons Market Shares [%] by Vertical Market – 2011-2020
Table 25 Latin America Military Non-Lethal Weapons Market [$M] & AGR [%] – 2011-2020
Table 26 Latin America Law Enforcement Non-Lethal Weapons Market [$M] & AGR [%] – 2011-2020
Table 27 Europe Non-Lethal Weapons Market [$M] by Vertical Market – 2011-2020
Table 28 Europe Non-Lethal Weapons Market Annual Growth Rates [%] by Vertical Market – 2011-2020
Table 29 Europe Non-Lethal Weapons Market Shares [%] by Vertical Market – 2011-2020
Table 30 Europe Military Non-Lethal Weapons Market [$M] & AGR [%] – 2011-2020
Table 31 Europe Law Enforcement Non-Lethal Weapons Market [$M] & AGR [%] – 2011-2020
Table 32 Middle East Non-Lethal Weapons Market [$M] by Vertical Market – 2011-2020
Table 33 Middle East Non-Lethal Weapons Market Annual Growth Rates [%] by Vertical Market – 2011-2020
Table 34 Middle East Non-Lethal Weapons Market Shares [%] by Vertical Market – 2011-2020
Table 35 Middle East Military Non-Lethal Weapons Market [$M] & AGR [%] – 2011-2020
Table 36 Middle East Law Enforcement Non-Lethal Weapons Market [$M] & AGR [%] – 2011-2020
Table 37 Asia-Pacific Non-Lethal Weapons Market [$M] by Vertical Market – 2011-2020
Table 38 Asia-Pacific Non-Lethal Weapons Market Annual Growth Rates [%] by Vertical Market – 2011-2020
Table 39 Asia-Pacific Non-Lethal Weapons Market Shares [%] by Vertical Market – 2011-2020
Table 40 Asia-Pacific Military Non-Lethal Weapons Market [$M] & AGR [%] – 2011-2020
Table 41 Asia-Pacific Law Enforcement Non-Lethal Weapons Market [$M] & AGR [%] – 2011-2020
Table 42 U.S. Non-Lethal Weapons Market [$M] by Vertical Market – 2011-2020
Table 43 U.S. Non-Lethal Weapons Market Annual Growth Rates [%] by Vertical Market – 2011-2020
Table 44 U.S. Non-Lethal Weapons Market Shares [%] by Vertical Market – 2011-2020
Table 45 U.S. Military Non-Lethal Weapons Market [$M] & AGR [%] – 2011-2020
Table 46 U.S. Law Enforcement Non-Lethal Weapons Market [$M] & AGR [%] – 2011-2020
Table 47 Mexican Non-Lethal Weapons Market [$M] by Vertical Market – 2011-2020
Table 48 Mexican Non-Lethal Weapons Market Annual Growth Rates [%] by Vertical Market – 2011-2020
Table 49 Mexican Non-Lethal Weapons Market Shares [%] by Vertical Market – 2011-2020
Table 50 Mexican Military Non-Lethal Weapons Market [$M] & AGR [%] – 2011-2020
Table 51 Mexican Law Enforcement Non-Lethal Weapons Market [$M] & AGR [%] – 2011-2020
Table 52 Brazilian Non-Lethal Weapons Market [$M] by Vertical Market – 2011-2020
Table 53 Brazilian Non-Lethal Weapons Market Annual Growth Rates [%] by Vertical Market – 2011-2020
Table 54 Brazilian Non-Lethal Weapons Market Shares [%] by Vertical Market – 2011-2020
Table 55 Brazilian Military Non-Lethal Weapons Market [$M] & AGR [%] – 2011-2020
Table 56 Brazilian Law Enforcement Non-Lethal Weapons Market [$M] & AGR [%] – 2011-2020
Table 57 U.K. Non-Lethal Weapons Market [$M] by Vertical Market – 2011-2020
Table 58 U.K. Non-Lethal Weapons Market Annual Growth Rates [%] by Vertical Market – 2011-2020
Table 59 U.K. Non-Lethal Weapons Market Shares [%] by Vertical Market – 2011-2020
Table 60 U.K. Military Non-Lethal Weapons Market [$M] & AGR [%] – 2011-2020
Table 61 U.K. Law Enforcement Non-Lethal Weapons Market [$M] & AGR [%] – 2011-2020
Table 62 German Non-Lethal Weapons Market [$M] by Vertical Market – 2011-2020
Table 63 German Non-Lethal Weapons Market Annual Growth Rates [%] by Vertical Market – 2011-2020
Table 64 German Non-Lethal Weapons Market Shares [%] by Vertical Market – 2011-2020
Table 65 German Military Non-Lethal Weapons Market [$M] & AGR [%] – 2011-2020
Table 66 German Law Enforcement Non-Lethal Weapons Market [$M] & AGR [%] – 2011-2020
Table 67 French Non-Lethal Weapons Market [$M] by Vertical Market – 2011-2020
Table 68 French Non-Lethal Weapons Market Annual Growth Rates [%] by Vertical Market – 2011-2020
Table 69 French Non-Lethal Weapons Market Shares [%] by Vertical Market – 2011-2020
Table 70 French Military Non-Lethal Weapons Market [$M] & AGR [%] – 2011-2020
Table 71 French Law Enforcement Non-Lethal Weapons Market [$M] & AGR [%] – 2011-2020
Table 72 Spanish Non-Lethal Weapons Market [$M] by Vertical Market – 2011-2020
Table 73 Spanish Non-Lethal Weapons Market Annual Growth Rates [%] by Vertical Market – 2011-2020
Table 74 Spanish Non-Lethal Weapons Market Shares [%] by Vertical Market – 2011-2020
Table 75 Spanish Military Non-Lethal Weapons Market [$M] & AGR [%] – 2011-2020
Table 76 Spanish Law Enforcement Non-Lethal Weapons Market [$M] & AGR [%] – 2011-2020
Table 77 Russian Non-Lethal Weapons Market [$M] by Vertical Market – 2011-2020
Table 78 Russian Non-Lethal Weapons Market Annual Growth Rates [%] by Vertical Market – 2011-2020
Table 79 Russian Non-Lethal Weapons Market Shares [%] by Vertical Market – 2011-2020
Table 80 Russian Military Non-Lethal Weapons Market [$M] & AGR [%] – 2011-2020
Table 81 Russian Law Enforcement Non-Lethal Weapons Market [$M] & AGR [%] – 2011-2020
Table 82 Turkish Non-Lethal Weapons Market [$M] by Vertical Market – 2011-2020
Table 83 Turkish Non-Lethal Weapons Market Annual Growth Rates [%] by Vertical Market – 2011-2020
Table 84 Turkish Non-Lethal Weapons Market Shares [%] by Vertical Market – 2011-2020
Table 85 Turkish Military Non-Lethal Weapons Market [$M] & AGR [%] – 2011-2020
Table 86 Turkish Law Enforcement Non-Lethal Weapons Market [$M] & AGR [%] – 2011-2020
Table 87 Israeli Non-Lethal Weapons Market [$M] by Vertical Market – 2011-2020
Table 88 Israeli Non-Lethal Weapons Market Annual Growth Rates [%] by Vertical Market – 2011-2020
Table 89 Israeli Non-Lethal Weapons Market Shares [%] by Vertical Market – 2011-2020
Table 90 Israeli Military Non-Lethal Weapons Market [$M] & AGR [%] – 2011-2020
Table 91 Israeli Law Enforcement Non-Lethal Weapons Market [$M] & AGR [%] – 2011-2020
Table 92 Egyptian Non-Lethal Weapons Market [$M] by Vertical Market – 2011-2020
Table 93 Egyptian Non-Lethal Weapons Market Annual Growth Rates [%] by Vertical Market – 2011-2020
Table 94 Egyptian Non-Lethal Weapons Market Shares [%] by Vertical Market – 2011-2020
Table 95 Egyptian Military Non-Lethal Weapons Market [$M] & AGR [%] – 2011-2020
Table 96 Egyptian Law Enforcement Non-Lethal Weapons Market [$M] & AGR [%] – 2011-2020
Table 97 Saudi Arabian Non-Lethal Weapons Market [$M] by Vertical Market – 2011-2020
Table 98 Saudi Arabian Non-Lethal Weapons Market Annual Growth Rates [%] by Vertical Market – 2011-2020
Table 99 Saudi Arabian Non-Lethal Weapons Market Shares [%] by Vertical Market – 2011-2020
Table 100 Saudi Arabian Military Non-Lethal Weapons Market [$M] & AGR [%] – 2011-2020
Table 101 Saudi Arabian Law Enforcement Non-Lethal Weapons Market [$M] & AGR [%] – 2011-2020
Table 102 UAE Non-Lethal Weapons Market [$M] by Vertical Market – 2011-2020
Table 103 UAE Non-Lethal Weapons Market Annual Growth Rates [%] by Vertical Market – 2011-2020
Table 104 UAE Non-Lethal Weapons Market Shares [%] by Vertical Market – 2011-2020
Table 105 UAE Military Non-Lethal Weapons Market [$M] & AGR [%] – 2011-2020
Table 106 UAE Law Enforcement Non-Lethal Weapons Market [$M] & AGR [%] – 2011-2020
Table 107 Indian Non-Lethal Weapons Market [$M] by Vertical Market – 2011-2020
Table 108 Indian Non-Lethal Weapons Market Annual Growth Rates [%] by Vertical Market – 2011-2020
Table 109 Indian Non-Lethal Weapons Market Shares [%] by Vertical Market – 2011-2020
Table 110 Indian Military Non-Lethal Weapons Market [$M] & AGR [%] – 2011-2020
Table 111 Indian Law Enforcement Non-Lethal Weapons Market [$M] & AGR [%] – 2011-2020
Table 112 China’s GDP vs. Nine Leading Nations’ Economies – 1990-2020
Table 113 Chinese Non-Lethal Weapons Market [$M] by Vertical Market – 2011-2020
Table 114 Chinese Non-Lethal Weapons Market Annual Growth Rates [%] by Vertical Market – 2011-2020
Table 115 Chinese Non-Lethal Weapons Market Shares [%] by Vertical Market – 2011-2020
Table 116 Chinese Military Non-Lethal Weapons Market [$M] & AGR [%] – 2011-2020
Table 117 Chinese Law Enforcement Non-Lethal Weapons Market [$M] & AGR [%] – 2011-2020
Table 118 Japanese Non-Lethal Weapons Market [$M] by Vertical Market – 2011-2020
Table 119 Japanese Non-Lethal Weapons Market Annual Growth Rates [%] by Vertical Market – 2011-2020
Table 120 Japanese Non-Lethal Weapons Market Shares [%] by Vertical Market – 2011-2020
Table 121 Japanese Military Non-Lethal Weapons Market [$M] & AGR [%] – 2011-2020
Table 122 Japanese Law Enforcement Non-Lethal Weapons Market [$M] & AGR [%] – 2011-2020
Table 123 NLW Counter-Personnel Means
Table 124 NLW Counter-Material Technologies
Table 125 NLW Capability Gaps
Table 126 Comparative Effects of Non-Lethal Kinetic Munitions
Table 127 Main Chemical Irritant Riot Control Gases
Table 128 DOD Less lethal Weapons, Vendors-Products
Table 129 Lethal Weapons Having Non-lethal Capability
Table 130 Advantages of Non-Lethal Weapons against Insurgents
Table 131  Drawbacks of Non-Lethal Weapons against Terrorists

Figures

Figure 1 NLW Measures of Effectiveness Framework
Figure 2 Global Non-Lethal Weapons Market [$M] by Region – 2011-2020
Figure 3 NLW Market Competitive Analysis
Figure 4 Global Non-Lethal Weapons Market [$M] by Technology – 2011-2020
Figure 5 Global Non-Lethal Weapons Market Shares [%] by Technology – 2011-2020
Figure 6 Global Non-Lethal Weapons Market [$M] by Vertical Market – 2011-2020
Figure 7 Global Non-Lethal Weapons Market Shares [%] by Vertical Market – 2011-2020
Figure 8 Global Military Non-Lethal Weapons Market AGR [%] – 2011-2020
Figure 9 Global Law Enforcement Non-Lethal Weapons Market AGR [%] – 2011-2020
Figure 10 Global Non-Lethal Weapons Market [$M] by Region – 2011-2020
Figure 11 Global Non-Lethal Weapons Market Shares [%] by Region – 2011-2020
Figure 12 Military Non-Lethal Weapons Market [$M] by Region – 2011-2020
Figure 13 Military Non-Lethal Weapons Market Shares [%] by Region – 2011-2020
Figure 14 Law Enforcement Non-Lethal Weapons Market [$M] by Region – 2011-2020
Figure 15 Law Enforcement Non-Lethal Weapons Market Shares [%] by Region – 2011-2020
Figure 16 North America Non-Lethal Weapons Market [$M] by Vertical Market – 2011-2020
Figure 17 North America Non-Lethal Weapons Market Shares [%] by Vertical Market – 2011-2020
Figure 18 North America Military Non-Lethal Weapons Market AGR [%] – 2011-2020
Figure 19 North America Law Enforcement Non-Lethal Weapons Market AGR [%] – 2011-2020
Figure 20 Latin America Non-Lethal Weapons Market [$M] by Vertical Market – 2011-2020
Figure 21 Latin America Non-Lethal Weapons Market Shares [%] by Vertical Market – 2011-2020
Figure 22 Latin America Military Non-Lethal Weapons Market AGR [%] – 2011-2020
Figure 23 Latin America Law Enforcement Non-Lethal Weapons Market AGR [%] – 2011-2020
Figure 24 Europe Non-Lethal Weapons Market [$M] by Vertical Market – 2011-2020
Figure 25 Europe Non-Lethal Weapons Market Shares [%] by Vertical Market – 2011-2020
Figure 26 Europe Military Non-Lethal Weapons Market AGR [%] – 2011-2020
Figure 27 Europe Law Enforcement Non-Lethal Weapons Market AGR [%] – 2011-2020
Figure 28 Middle East Non-Lethal Weapons Market [$M] by Vertical Market – 2011-2020
Figure 29 Middle East Non-Lethal Weapons Market Shares [%] by Vertical Market – 2011-2020
Figure 30 Middle East Military Non-Lethal Weapons Market AGR [%] – 2011-2020
Figure 31 Middle East Law Enforcement Non-Lethal Weapons Market AGR [%] – 2011-2020
Figure 32 Asia-Pacific Non-Lethal Weapons Market [$M] by Vertical Market – 2011-2020
Figure 33 Asia-Pacific Non-Lethal Weapons Market Shares [%] by Vertical Market – 2011-2020
Figure 34 Asia-Pacific Military Non-Lethal Weapons Market AGR [%] – 2011-2020
Figure 35 Asia-Pacific Law Enforcement Non-Lethal Weapons Market AGR [%] – 2011-2020
Figure 36 Structure of the Joint Non-Lethal Weapons Program
Figure 37 The US Joint Non-Lethal Weapons Program Centers
Figure 38 U.S. Non-Lethal Weapons Market [$M] by Vertical Market – 2011-2020
Figure 39 U.S. Non-Lethal Weapons Market Shares [%] by Vertical Market – 2011-2020
Figure 40 U.S. Military Non-Lethal Weapons Market AGR [%] – 2011-2020
Figure 41 U.S. Law Enforcement Non-Lethal Weapons Market AGR [%] – 2011-2020
Figure 42 Mexico HLS & Public Safety Agencies Organogram
Figure 43 Mexican Non-Lethal Weapons Market [$M] by Vertical Market – 2011-2020
Figure 44 Mexican Non-Lethal Weapons Market Shares [%] by Vertical Market – 2011-2020
Figure 45 Mexican Military Non-Lethal Weapons Market AGR [%] – 2011-2020
Figure 46 Mexican Law Enforcement Non-Lethal Weapons Market AGR [%] – 2011-2020
Figure 47 Brazil HLS & Public Safety Agencies Organogram
Figure 48 Brazilian Non-Lethal Weapons Market [$M] by Vertical Market – 2011-2020
Figure 49 Brazilian Non-Lethal Weapons Market Shares [%] by Vertical Market – 2011-2020
Figure 50 Brazilian Military Non-Lethal Weapons Market AGR [%] – 2011-2020
Figure 51 Brazilian Law Enforcement Non-Lethal Weapons Market AGR [%] – 2011-2020
Figure 52 U.K. HLS & Public Safety Agencies Organogram
Figure 53 U.K. Non-Lethal Weapons Market [$M] by Vertical Market – 2011-2020
Figure 54 U.K. Non-Lethal Weapons Market Shares [%] by Vertical Market – 2011-2020
Figure 55 U.K. Military Non-Lethal Weapons Market AGR [%] – 2011-2020
Figure 56 U.K. Law Enforcement Non-Lethal Weapons Market AGR [%] – 2011-2020
Figure 57 Germany HLS & Public Safety Agencies Organogram
Figure 58 German Non-Lethal Weapons Market [$M] by Vertical Market – 2011-2020
Figure 59 German Non-Lethal Weapons Market Shares [%] by Vertical Market – 2011-2020
Figure 60 German Military Non-Lethal Weapons Market AGR [%] – 2011-2020
Figure 61 German Law Enforcement Non-Lethal Weapons Market AGR [%] – 2011-2020
Figure 62 France HLS & Public Safety Agencies Organogram
Figure 63 French Non-Lethal Weapons Market [$M] by Vertical Market – 2011-2020
Figure 64 French Non-Lethal Weapons Market Shares [%] by Vertical Market – 2011-2020
Figure 65 French Military Non-Lethal Weapons Market AGR [%] – 2011-2020
Figure 66 French Law Enforcement Non-Lethal Weapons Market AGR [%] – 2011-2020
Figure 67 Spain HLS & Public Safety Agencies Organogram
Figure 68 Spanish Non-Lethal Weapons Market [$M] by Vertical Market – 2011-2020
Figure 69 Spanish Non-Lethal Weapons Market Shares [%] by Vertical Market – 2011-2020
Figure 70 Spanish Military Non-Lethal Weapons Market AGR [%] – 2011-2020
Figure 71 Spanish Law Enforcement Non-Lethal Weapons Market AGR [%] – 2011-2020
Figure 72 Russian Non-Lethal Weapons Market [$M] by Vertical Market – 2011-2020
Figure 73 Russian Non-Lethal Weapons Market Shares [%] by Vertical Market – 2011-2020
Figure 74 Russian Military Non-Lethal Weapons Market AGR [%] – 2011-2020
Figure 75 Russian Law Enforcement Non-Lethal Weapons Market AGR [%] – 2011-2020
Figure 76 Turkey HLS & Public Safety Agencies Organogram
Figure 77 Turkish Non-Lethal Weapons Market [$M] by Vertical Market – 2011-2020
Figure 78 Turkish Non-Lethal Weapons Market Shares [%] by Vertical Market – 2011-2020
Figure 79 Turkish Military Non-Lethal Weapons Market AGR [%] – 2011-2020
Figure 80 Turkish Law Enforcement Non-Lethal Weapons Market AGR [%] – 2011-2020
Figure 81 Israel West Bank Separation Barrier
Figure 82 Israeli Pulsed Jet Water Canon Vehicle
Figure 83 Israeli Non-Lethal Weapons Market [$M] by Vertical Market – 2011-2020
Figure 84 Israeli Non-Lethal Weapons Market Shares [%] by Vertical Market – 2011-2020
Figure 85 Israeli Military Non-Lethal Weapons Market AGR [%] – 2011-2020
Figure 86 Israeli Law Enforcement Non-Lethal Weapons Market AGR [%] – 2011-2020
Figure 87 Egyptian Non-Lethal Weapons Market [$M] by Vertical Market – 2011-2020
Figure 88 Egyptian Non-Lethal Weapons Market Shares [%] by Vertical Market – 2011-2020
Figure 89 Egyptian Military Non-Lethal Weapons Market AGR [%] – 2011-2020
Figure 90 Egyptian Law Enforcement Non-Lethal Weapons Market AGR [%] – 2011-2020
Figure 91 Three Tiers of Saudi Security Infrastructure
Figure 92 The Saudi Government Security Organization Chart
Figure 93 Saudi Arabian Non-Lethal Weapons Market [$M] by Vertical Market – 2011-2020
Figure 94 Saudi Arabian Non-Lethal Weapons Market Shares [%] by Vertical Market – 2011-2020
Figure 95 Saudi Arabian Military Non-Lethal Weapons Market AGR [%] – 2011-2020
Figure 96 Saudi Arabian Law Enforcement Non-Lethal Weapons Market AGR [%] – 2011-2020
Figure 97 U.A.E. HLS Agencies
Figure 98 UAE Non-Lethal Weapons Market [$M] by Vertical Market – 2011-2020
Figure 99 UAE Non-Lethal Weapons Market Shares [%] by Vertical Market – 2011-2020
Figure 100 UAE Military Non-Lethal Weapons Market AGR [%] – 2011-2020
Figure 101 UAE Law Enforcement Non-Lethal Weapons Market AGR [%] – 2011-2020
Figure 102 India HLS & Public Safety Agencies Organogram
Figure 103 Indian Non-Lethal Weapons Market [$M] by Vertical Market – 2011-2020
Figure 104 Indian Non-Lethal Weapons Market Shares [%] by Vertical Market – 2011-2020
Figure 105 Indian Military Non-Lethal Weapons Market AGR [%] – 2011-2020
Figure 106 Indian Law Enforcement Non-Lethal Weapons Market AGR [%] – 2011-2020
Figure 107 China HLS & Public Safety Agencies Organogram
Figure 108 Chinese Non-Lethal Weapons Market [$M] by Vertical Market – 2011-2020
Figure 109 Chinese Non-Lethal Weapons Market Shares [%] by Vertical Market – 2011-2020
Figure 110 Chinese Military Non-Lethal Weapons Market AGR [%] – 2011-2020
Figure 111 Chinese Law Enforcement Non-Lethal Weapons Market AGR [%] – 2011-2020
Figure 112 Japan HLS & Public Safety Agencies Organogram
Figure 113 Japanese Non-Lethal Weapons Market [$M] by Vertical Market – 2011-2020
Figure 114 Japanese Non-Lethal Weapons Market Shares [%] by Vertical Market – 2011-2020
Figure 115 Japanese Military Non-Lethal Weapons Market AGR [%] – 2011-2020
Figure 116 Japanese Law Enforcement Non-Lethal Weapons Market AGR [%] – 2011-2020
Figure 117 Near term Counter-Personnel NLW
Figure 118 Mid-term Counter-Personnel NLW
Figure 119 Far-term Counter-Personnel NLW
Figure 120 Near-term Counter-Material Non-Lethal Technologies
Figure 121 Mid-term Counter-Material Non-Lethal Technologies
Figure 122 Long-term Counter-Materiel Non-Lethal Technologies
Figure 123 Direct Energy Lethal and Non-Lethal Effects
Figure 124 Lethal and Non-Lethal Effects Spectrum
Figure 125 Spectrum of Medical Effects for Less-lethal Weapons
Figure 126  Medical Effects of NLW

Questions about this report?

Contact Sales: 1-571-527-1010 or Analysts: 1-202-455-0966

  • Have a question about Non-Lethal Weapons (NLW): Industry, Technologies & Global Market 2014-2020
    Please fill out all fields in the form below and click "Submit" to send your question.
    Our representative will review your question and contact you with an answer as soon as possible.
  • 2+2=
  • This field is for validation purposes and should be left unchanged.
1
Interested in this report? Need more information?
X
Powered By