Top
HSRCEuropean Homeland Security & Public Safety Market & Technologies – 2016-2022
Placeholder

European Homeland Security & Public Safety Market & Technologies - 2016-2022

Europe Security Market Growth Rate Not Seen Since 9/11. 4 Volumes Mega Report. 168 Submarkets

  • Q2 2016
  • 1815
  • 669
    • 3450 $
    • 4450 $
    • 6950 $
    • 8000 $

    Small Businesses, Startups & Academia - Up to 50% Off

Quantity
IBM
Amazon
Sandia National Lab
HITACHI
Thales
Smiths Detection
Nuctech
Korea Internet & Security Agency
L3Harris
Huawei
Leidos
NEC
Toshiba
Deloitte
MAG

Want to customize this report?

If you purchase this report, you are entitled to a 30% discount towards customizing it, to better fit your market research and strategic needs. Our Custom Research and Industry Insights Department will work with you to better understand your information gaps and strategic needs and will provide you with a tailor-made market research report within a short period of time.

Why Choose Us?

30+ Years of Experience
We are a multidisciplinary team of Transformational Technologies industry experts with over 30 years of experience.
Gold Standard
With over 950 private sector clients (73% repeat customers), including major defense and security vendors, and Forbes Global 2000 companies, HSRC earned the reputation as the industry’s Gold Standard for Transformational Technologies Market Reports.
Tailored Research Services
Provide you with clear, actionable recommendations designed to empower decision making and to help you exploit emerging opportunities in the Transformational Technologies industries.
Information Security
Your personal information is safe and secure.

From: $3,450

SKU: 8809 Category:

Description

European Homeland Security & Public Safety Technologies & Markets - 2016-2022

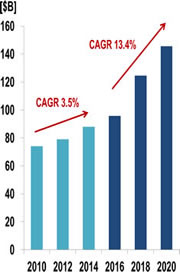
Homeland Security & Public Safety Market in Europe to Grow from $84.8B in 2015 to $145.7B by 2020

In light of the alarming ISIS-inspired terror threats and the migration crisis, it is clear that present European security infrastructure cannot meet the challenge. A major overhaul of Western Europe’s internal security infrastructure and funding is already in progress leading to a forecasted $146 billion 2020 Counter Terror market. Europe is facing terror threats and migration crisis with a far greater reach than those resulting from its economic ones. And, this alarming situation shows no sign of declining. Europeans are now experiencing a disturbing new reality in which ISIS-inspired terror and the migration crisis are quickly becoming the continent’s Homeland Security & Public Safety market “new norm”.

According to the HLS report, “European Homeland Security & Public Safety Technologies & Markets – 2016-2022“, the European counter terror and public safety infrastructure will go through a major overhaul, sustaining a 13.4% 2016-2020 CAGR surge, nearly four times the pace of the previous five-year period.

This report is published as one of our May 2016 Europe’s Terror & Migration Crisis Series reports (concurrently with 9 other published and a dozen pipeline reports to be published soon).

The 4-volume “European Homeland Security & Public Safety Technologies & Markets – 2016-2022 – 2016-2020“, including a bonus report Global Homeland Security & Public Safety Industry – 2016 Edition” (priced at $2,950 to $10,000 ) are the only comprehensive reviews of the European security market available today. The objective of this study is to provide a detailed, time-sensitive and reasoned intelligence report.

The European Counter Terror & Public Safety Market is boosted by the following drivers:

  • The ISIS-inspired complex and well-planned Paris and Brussels carnage (162 killed and 668 injured) which sent shockwaves across the continent.
  • The terror attacks and the migration crisis shook the European governments and the European security agencies unlike any other terror attacks since 9/11.
  • The Western European security forces are ill equipped to encounter 21st century ISIS-inspired and trained terrorists who use cutting-edge encrypted communication, make a remarkable use of social networks to recruit and train jihadists, and gather efficient pre-attack intelligence. They have been trained by ISIS ex-Iraqi military officers on planning and conducting modern day guerrilla warfare and using modern weapons.
  • Europol estimates that up to 5,000 European jihadists have returned to the EU after obtaining combat experience on the battlefields of the Middle East.
  • West European governments understand that they are caught between a rock and a hard place. It is for them to decide how to transform the national counter terror infrastructure, improve interagency cooperation, strategy and surge in funding.
  • The EU-Turkey refugee deal, if implemented, could lead to a significant reduction in the flow of refugees. However, the agreement faces major practical, political and legal challenges.
  • The EU and most of the rest of the European market for homeland security and public safety products are served by local companies. Even with a preference for locally manufactured products, foreign products can usually strongly compete on the basis of cost-performance. They do not encounter any EU direct trade barriers or quotas. Non-tariff, indirect trade barriers may be the approval process of dual-use goods, which include numerous security market products

This Europe Security Market Forecast is a resource for executives with interests in the Security market. It has been explicitly customized for the security industry and government decision-makers in order to enable them to identify business opportunities, emerging technologies, market trends and risks, as well as to benchmark business plans.

Questions answered in this 1236-page report* include:

  • What will the European HLS market size and trends be during 2016-2022?
  • Which are the submarkets that provide attractive business opportunities?
  • Who are the decision-makers?
  • What drives the customers to purchase solutions and services?
  • What are the customers looking for?
  • What are the technology & services trends?
  • What is the market SWOT (Strengths, Weaknesses, Opportunities and Threats)?
  • What are the challenges to market penetration & growth?

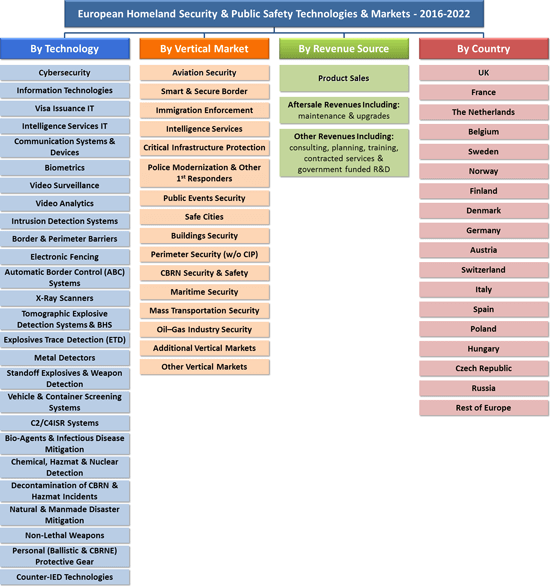
European Internal Security Market Segmentation

European Homeland Security & Public Safety Technologies & Markets – 2016-2022 Report Core Submarkets

With 1815 pages, 164 tables and 505 figures, this 4-volume report covers 16 vertical, 27 technology, 17 countries and 3 revenue source markets, offering for each of them 2015 data and assessments, and 2016-2022 forecasts and analyses.

* Included with the purchase of this Market report is the Bonus report “Global Homeland Security & Public Safety Industry – 2016 Edition” report.

Why Buy this Report?

A. Market data is analyzed via 4 independent key perspectives:

With a highly fragmented market we address the HLS Budget “money trail” – each dollar spent – via the following 4 orthogonal viewpoints:

  • By 18 Country Markets including:
    1. UK HLS and Public Safety Market
    2. France HLS and Public Safety Market
    3. The Netherlands HLS and Public Safety Market
    4. Belgium HLS and Public Safety Market
    5. Sweden HLS and Public Safety Market
    6. Norway HLS and Public Safety Market
    7. Finland HLS and Public Safety Market
    8. Denmark HLS and Public Safety Market
    9. Germany HLS and Public Safety Market
    10. Austria HLS and Public Safety Market
    11. Switzerland HLS and Public Safety Market
    12. Italy HLS and Public Safety Market
    13. Spain HLS and Public Safety Market
    14. Poland HLS and Public Safety Market
    15. Hungary HLS and Public Safety Market
    16. Czech Republic HLS and Public Safety Market
    17. Russia HLS and Public Safety Market
    18. Rest of Europe HLS and Public Safety Market
  • By 3 Revenue Sources including:
    1. Products Sales Revenues
    2. Maintenance & Service, Upgrades, Refurbishment
    3. Planning, Training and Consulting
  • By 28 Technology Markets including:
    1. Cybersecurity
    2. Information Technologies (w/o Intel & Visa IT)
    3. Visa Issuance IT
    4. Intelligence Services IT
    5. Counter Terror & Crime IT
    6. Communication Systems & Devices
    7. Biometrics
    8. Video Surveillance
    9. Video Analytics
    10. Intrusion Detection Systems
    11. Border & Perimeter Barriers
    12. Electronic Fencing
    13. Automatic Border Control (ABC) Systems
    14. X-Ray Scanners
    15. Tomographic Explosive Detection Systems & BHS
    16. Explosives Trace Detection (ETD)
    17. Metal Detectors
    18. Standoff Explosives & Weapon Detection
    19. Vehicle & Container Screening Systems
    20. C2/C4ISR Systems
    21. Bio-Agents & Infectious Disease Detection
    22. Chemical, Hazmat & Nuclear Detection
    23. CBRN & Hazmat Incidents Decontamination Systems and Consumables
    24. Natural & Manmade Disaster Mitigation Equipment
    25. Non-Lethal Weapons
    26. Personal (Ballistic & CBRNE) Protective Gear
    27. Counter-IED Technologies
    28. Other Technologies
  • By 16 Vertical Markets including:
    1. Smart Borders
    2. Immigration Enforcement
    3. Border Security
    4. Intelligence Services
    5. Critical Infrastructure Protection
    6. 1st Responders (Police, Medics & Firefighters)
    7. Public Events Security
    8. Safe Cities
    9. Buildings Security
    10. Perimeter Security (w/o CIP)
    11. Building Security
    12. Private Sector Security
    13. Maritime Security
    14. Mass Transportation Security
    15. CBRN & Hazmat Security and Safety
    16. Other Vertical Markets

B. Detailed market analysis frameworks for each of the market sectors, including:

  1. Market drivers & inhibitors
  2. Business opportunities
  3. SWOT analysis
  4. Competitive analysis
  5. Business environment
  6. The 2015-2022 market segmented by 51 submarkets

C. The report includes the following 6 appendices:

  1. Appendix A: Muslim Population Diversity in Europe
  2. Appendix B: European Confrontation with ISIS-Da’esh
  3. Appendix C: The European Union Challenges and Outlook
  4. Appendix D: European Homeland Security & Public Safety Related Product Standards
  5. Appendix E: 2015 Terror Attacks against Europeans
  6. Appendix F: European Migration Crisis & Border Security

D. The report addresses over 90 technologies including:

  1. Access Control Systems
  2. Automated Border Control (ABC) Gates
  3. Backscatter X-Ray Container-Vehicle Screening Systems
  4. Bio-Agents & Infectious Disease Detection
  5. Biometrics
  6. Biosecurity and Biosafety Devices & Systems
  7. Bio-Terror & Infectious Disease Early Alert System Devices & Systems
  8. Boarding Gate Explosives Scanners
  9. Border & Perimeter Barriers
  10. C2/C4ISR Systems
  11. Capacitance Sensors Fence
  12. CBRN and Hazmat Personal Protective Gear
  13. Cell Broadcast Mass Emergency Notification
  14. Chemical Agent Detection
  15. Chemical, HAZMAT & Nuclear Detection
  16. Coherent Scatter 2D X-Ray Systems
  17. Communication Systems & Devices
  18. Cybersecurity
  19. Decontamination of CBRN & HAZMAT Incidents
  20. Desktop ETD Devices
  21. Dual Energy LINAC X-Ray Container-Vehicle Screening Systems
  22. Dual-View LINAC X-Ray Container-Vehicle Screening Systems
  23. Dumb Fences
  24. Electronic Fencing
  25. Emergency Management IT Systems
  26. Emergency Medical Services (EMS) Devices & Systems
  27. E-Passports
  28. Fiber Optic Fence
  29. Gamma Ray Systems Container-Vehicle Screening Systems
  30. Hand Held Metal Detectors
  31. Handheld ETD Devices
  32. Homeland Security & Public Safety IT Systems
  33. Human Portable Radiation Detection Systems (HPRDS)
  34. Hybrid Tomographic EDS & 2D X-Ray Screening
  35. IED Placement Detection
  36. Infrastructure as a Service (IaaS) IT
  37. Intelligence Community Big Data IT
  38. Intelligence Community Cloud Infrastructure IT
  39. Intelligence Community Software as a Service (SaaS)
  40. Intelligence Services IT
  41. Interoperable Communication Systems
  42. Intrusion Detection Systems
  43. Ion Mobility Spectroscopy (IMS)
  44. Liquid Explosives Detection Devices
  45. Luggage, Baggage & Mail Screening Systems
  46. Maritime Awareness Global Network (MAGNET)
  47. Mass Emergency Notification Devices & Systems
  48. Metal detection Portals
  49. Multimodal Biometric Systems
  50. Narcotics Trace Detection Devices
  51. Natural & Manmade Disaster Early Warning systems
  52. Non-Lethal Weapons(NLW)
  53. Nuclear/Radiological Detection Devices & Systems
  54. Other Security Technologies
  55. People Screening MMWave (AIT) Portals
  56. People Screening X-Ray Backscatter (AIT) Portals
  57. Perimeter Security Technologies
  58. Personal (Ballistic & CBRNE) Protective Gear
  59. Personal Body Armor
  60. Platform as a Service (PaaS)
  61. Police Modernization Systems and Devices
  62. Ported Coax Buried Line Fence
  63. Rescue & Recovery Equipment
  64. Respiratory Protective Equipment
  65. Satellite Based Maritime Tracking
  66. Shoe Scanners
  67. Siren Systems
  68. SkyBitz Global Locating System
  69. Standoff Explosives & Weapon Detection Systems
  70. Standoff Suicide Bombers Detection
  71. Strain Sensitive Cables Fence
  72. Suicide Bombers Borne IED (PBIED) Detectors
  73. Suicide Bombers Detonation Neutralization
  74. Taut Wire Fence
  75. Text Alert Systems
  76. The Advanced Spectroscopic Portals (ASP)
  77. Tomographic Explosive Detection Systems (EDS)
  78. Transportable X-Ray Screening Checkpoints
  79. VBIED Detonation Neutralization
  80. Vehicle & Container Screening Systems
  81. Vehicle Borne IED (VBIED) Detectors
  82. Vehicle Screening ETD Systems
  83. Vibration Sensors Mounted on Fence
  84. Video Analytics
  85. Video Surveillance
  86. Visa & Passport related IT
  87. Voice Alert Systems
  88. Wide Area Communications and Tracking Technology
  89. X-Ray Container-Vehicle Screening Systems
  90. X-ray Screening systems

E. The report addresses over 300 European Homeland Security and Public Safety standards (including links)

F. The supplementary (*) “Global Homeland Security and Public Safety Industry – 2016 Edition” report provides the following insights and analysis of the industry including:

  • The Global Industry 2016 status
  • Effects of Emerging Technologies on the Industry
  • The Market Trends
  • Vendor – Government Relationship
  • Geopolitical Outlook 2016-2022
  • The Industry Business Models & Strategies
  • Market Entry Challenges
  • The Industry: Supply-Side & Demand-Side Analysis
  • Market Entry Strategies
  • Price Elasticity
  • Past Mergers & Acquisitions (M&A) Events

G. The bonus report (*): “Global Homeland Security and Public Safety Industry – 2016 Edition” provides a May 2016 updated extensive data (including company profile, recent annual revenues, key executives, homeland security and public safety products, and contact info.) of the leading 119 Homeland Security and Public Safety Vendors including:

  1. 3M
  2. 3i-MIND
  3. 3VR
  4. 3xLOGIC
  5. ABB
  6. Accenture
  7. ACTi Corporation
  8. ADT Security Services
  9. AeroVironment Inc.
  10. Agent Video Intelligence
  11. Airbus Defence and Space
  12. Alcatel-Lucent (Nokia Group)
  13. ALPHAOPEN
  14. American Science & Engineering Inc.
  15. Anixter
  16. Aralia Systems
  17. AT&T Inc.
  18. Augusta Systems
  19. Austal
  20. Avigilon Corporation
  21. Aware
  22. Axis
  23. AxxonSoft
  24. Ayonix
  25. BAE Systems
  26. BioEnable Technologies Pvt Ltd
  27. BioLink Solutions
  28. Boeing
  29. Bollinger Shipyards, Inc
  30. Bosch Security Systems
  31. Bruker Corporation
  32. BT
  33. Camero
  34. Cassidian
  35. CelPlan
  36. China Security & Surveillance, Inc.
  37. Cisco Systems
  38. Citilog
  39. Cognitec Systems GmbH
  40. Computer Network Limited (CNL)
  41. Computer Sciences Corporation
  42. CrossMatch
  43. Diebold
  44. DRS Technologies Inc.
  45. DVTel
  46. Elbit Systems Ltd.
  47. Elsag Datamat
  48. Emerson Electric
  49. Ericsson
  50. ESRI
  51. FaceFirst
  52. Finmeccanica SpA
  53. Firetide
  54. Fulcrum Biometrics LLC
  55. G4S
  56. General Atomics Aeronautical Systems Inc.
  57. General Dynamics Corporation
  58. Getac Technology Corporation
  59. Hanwha Techwin
  60. Harris Corporation
  61. Hewlett Packard Enterprise
  62. Hexagon AB
  63. Honeywell International Inc.
  64. Huawei Technologies Co., Ltd
  65. IBM
  66. IndigoVision
  67. Intel Security
  68. IntuVision Inc
  69. iOmniscient
  70. IPConfigure
  71. IPS Intelligent Video Analytics
  72. Iris ID Systems, Inc.
  73. IriTech Inc.
  74. Israel Aerospace Industries Ltd.
  75. ISS
  76. L-3 Security & Detection Systems
  77. Leidos, Inc.
  78. Lockheed Martin Corporation
  79. MACROSCOP
  80. MDS
  81. Mer group
  82. Milestone Systems A/S
  83. Mirasys
  84. Motorola Solutions, Inc.
  85. National Instruments
  86. NEC Corporation
  87. NICE Systems
  88. Northrop Grumman Corporation
  89. Nuance Communications, Inc.
  90. ObjectVideo
  91. Panasonic Corporation
  92. Pelco
  93. Pivot3
  94. Proximex
  95. QinetiQ Limited
  96. Rapiscan Systems, Inc.
  97. Raytheon
  98. Rockwell Collins, Inc.
  99. Safran S.A.
  100. Salient Sciences
  101. Schneider Electric
  102. SeeTec
  103. Siemens
  104. Smart China (Holdings) Limited
  105. Smiths Detection Inc.
  106. Sony Corp.
  107. Speech Technology Center
  108. Suprema Inc.
  109. Synectics Plc
  110. Tandu Technologies & Security Systems Ltd
  111. Texas Instruments
  112. Textron Inc.
  113. Thales Group
  114. Total Recall
  115. Unisys Corporation
  116. Verint
  117. Vialogy LLC
  118. Vigilant Technology
  119. Zhejiang Dahua Technology

Table of Contents

Download TOC as PDF

4 Volumes:

European Homeland Security & Public Safety Technologies & Markets – 2016-2022 – Volume 1

European Homeland Security & Public Safety Technologies & Markets – 2016-2022 – Volume 2

European Homeland Security & Public Safety Technologies & Markets – 2016-2022 – Volume 3

European Homeland Security & Public Safety Technologies & Markets – 2016-2022 – Volume 4


European Homeland Security & Public Safety Technologies & Markets – 2016-2022 – Volume 1

1 CEO Takeaway
2 Europe’s Terror & Migration Crisis: Key Findings
3 Europe’s Terror & Migration Crisis: Key Conclusions
4 European Homeland Security & Public Safety Markets – 2015-2022
4.1 2015 Data and 2016-2022 Forecast by Major Vertical Markets
4.2 European Homeland Security & Public Safety Major Technology Markets – 2015-2022
4.3 Homeland Security & Public Safety Market by European Countries – 2015-2022
4.4 European Homeland Security & Public Safety Market by Revenue Sources – 2015-2022
5 The European Counter Terror, Immigration Enforcement & Public Safety Market Eco-System
5.1 The 2016 European Terror Eco-System
5.2 Europe cannot keep all terrorists and criminals out
5.3 The threat is already inside Europe
5.4 Our Technology is ISIS-Da’esh Force Multiplier
5.5 The current period of relative security in Europe will not continue
5.6 Europe Migration Crisis
6 The European Counter Terror & Counter Crime Strategy
6.1 Prevention
6.2 Protection
6.3 Intelligence
6.4 European Policy to Mitigate Terrorism and Organized Crime
7 The EU Borders Security
7.1 Summary
7.2 The EU Land Borders
7.3 The EU Maritime Borders
8 Europe’s Refugee Crisis
9 European Counter Terror & Counter Crime Organizations
9.1 The European External Action Service (EEAS or EAS)
9.2 The EU Emergency Response Coordination Center
9.3 The EU Counter-terrorism Coordinator (ECTC)
9.4 The EU Radicalization Awareness Network
9.5 EU Counter-terrorism Funding
9.6 Internal Security Fund (ISF)
9.7 The EU Situation Room
9.8 EUROJUST
9.9 EUROPOL
9.1 EURODAC
9.11 EU Free Movement of People
9.12 Schengen Visas
9.13 Schengen Information System
9.14 Frontex
9.15 The External Borders Fund
9.16 The Prüm Treaty
9.17 The Schengen Information System (SIS)
10 Market Drivers
11 Market Inhibitors
12 Demand-side & Supply-side Effects
13 SWOT Analysis
13.1 Strengths
13.2 Weaknesses
13.3 Opportunities
13.4 Threats
14 Competitive Analysis
15 European Homeland Security & Public Safety Markets – 2016-2022
15.1 European Homeland Security & Public Safety Major Vertical Markets – 2016-2022
15.1.1 Market 2015 Data and 2016-2022 Forecast
15.1.2 Major Vertical Markets Dynamics
15.1.3 Market Breakdown by Major Vertical Markets
15.2 European Homeland Security & Public Safety: by Major Technology Markets – 2015-2022
15.2.1 2015 Data and 2016-2022 Forecast: by Major Technology Markets
15.2.2 Markets Dynamics by: Major Technology Markets
15.3 European Homeland Security & Public Safety Market by Country – 2015-2022
15.3.1 2015 National Markets & 2016-2022 Forecast
15.3.2 National Markets Dynamics
15.3.3  European Market Breakdown by Country
15.4 European Homeland Security & Public Safety Market by Revenue Source – 2015-2022
15.4.1 Market Forecast by Revenue Source – 2015-2022
15.4.2 Market Dynamics by Revenue Source – 2015-2022
15.4.3 Market Breakdown by Revenue Source
15.5 European Homeland Security & Public Safety Market by Vertical Markets – 2015-2022
15.5.1 Market 2015 Data and 2016-2022 Forecast
15.5.2 Major Vertical Markets Dynamics
15.5.3 Market Breakdown by Major Vertical Markets
15.6 European Homeland Security & Public Safety by Major Technology Markets – 2015-2022
15.6.1 2015 Data and 2016-2022 Forecast: by Major Technology Markets
15.6.2 Markets Dynamics by: Major Technology Markets
16 UK Homeland Security & Public Safety Market – 2015-2022
16.1 UK Homeland Security & Public Safety Market By Revenue Category – 2015-2022
16.1.1 Market Forecast
16.1.2 Market Dynamics
16.1.3 Market Breakdown
17 France Homeland Security & Public Safety Market – 2015-2022
17.1 France Homeland Security & Public Safety Market By Revenue Category – 2015-2022
17.1.1 Market Forecast
17.1.2 Market Dynamics
17.1.3 Market Breakdown
18 Belgium Homeland Security & Public Safety Market – 2015-2022
18.1 Belgium Homeland Security & Public Safety Market By Revenue Category – 2015-2022
18.1.1 Market Forecast
18.1.2 Market Dynamics
18.1.3 Market Breakdown
19 Germany Homeland Security & Public Safety Market – 2015-2022
19.1 Germany Homeland Security & Public Safety Market By Revenue Category – 2015-2022
19.1.1 Market Forecast
19.1.2 Market Dynamics
19.1.3 Market Breakdown
20 Austria Homeland Security & Public Safety Market – 2015-2022
20.1 Austria Homeland Security & Public Safety Market By Revenue Category – 2015-2022
20.1.1 Market Forecast
20.1.2 Market Dynamics
20.1.3 Market Breakdown
21 Switzerland Homeland Security & Public Safety Market – 2015-2022
21.1 Switzerland Homeland Security & Public Safety Market By Revenue Category – 2015-2022
21.1.1 Market Forecast
21.1.2 Market Dynamics
21.1.3 Market Breakdown
22 Italy Homeland Security & Public Safety Market – 2015-2022
22.1 Italy Homeland Security & Public Safety Market By Revenue Category – 2015-2022
22.1.1 Market Forecast
22.1.2 Market Dynamics
22.1.3 Market Breakdown
23 Spain Homeland Security & Public Safety Market – 2015-2022
23.1 Spain Homeland Security & Public Safety Market By Revenue Category – 2015-2022
23.1.1 Market Forecast
23.1.2 Market Dynamics
23.1.3 Market Breakdown
24 Poland Homeland Security & Public Safety Market – 2015-2022
24.1 Poland Homeland Security & Public Safety Market By Revenue Category – 2015-2022
24.1.1 Market Forecast
24.1.2 Market Dynamics
24.1.3 Market Breakdown
25 Hungary Homeland Security & Public Safety Market – 2015-2022
25.1 Hungary Homeland Security & Public Safety Market By Revenue Category – 2015-2022
25.1.1 Market Forecast
25.1.2 Market Dynamics
25.1.3 Market Breakdown
26 Czech Republic Homeland Security & Public Safety Market – 2015-2022
26.1 Czech Republic Homeland Security & Public Safety Market By Revenue Category – 2015-2022
26.1.1 Market Forecast
26.1.2 Market Dynamics
26.1.3 Market Breakdown
27 Russia Homeland Security & Public Safety Market – 2015-2022
27.1 Russia Homeland Security & Public Safety Market By Revenue Category – 2015-2022
27.1.1 Market Forecast
27.1.2 Market Dynamics
27.1.3 Market Breakdown
28 Sweden Homeland Security & Public Safety Market – 2015-2022
28.1 Sweden Homeland Security & Public Safety Market By Revenue Category – 2015-2022
28.1.1 Market Forecast
28.1.2 Market Dynamics
28.1.3 Market Breakdown
29 Norway Homeland Security & Public Safety Market – 2015-2022
29.1 Norway Homeland Security & Public Safety Market By Revenue Category – 2015-2022
29.1.1 Market Forecast
29.1.2 Market Dynamics
29.1.3 Market Breakdown
30 Finland Homeland Security & Public Safety Market – 2015-2022
30.1 Finland Homeland Security & Public Safety Market By Revenue Category – 2015-2022
30.1.1 Market Forecast
30.1.2 Market Dynamics
30.1.3 Market Breakdown
31 Denmark Homeland Security & Public Safety Market – 2015-2022
31.1 Denmark Homeland Security & Public Safety Market By Revenue Category – 2015-2022
31.1.1 Market Forecast
31.1.2 Market Dynamics
31.1.3 Market Breakdown
32 Rest of Europe Homeland Security & Public Safety Market – 2015-2022
32.1 Rest of Europe Homeland Security & Public Safety Market By Revenue Category – 2015-2022
32.1.1 Market Forecast
32.1.2 Market Dynamics
32.1.3 Market Breakdown
33 Appendix A: Europe’s Muslim Population
34 Appendix B: European Confrontation with ISIS-Da’esh
35 Appendix C: European Homeland Security & Public Safety Related Product Standards
35.1 European Committee for Standardization (CEN)
35.2 European Homeland Security and Public Safety Standards
35.3 EU Buildings & Perimeter Security Standards & Specifications
36 Appendix D: 2015 Terror Attacks Against Europeans
37 Appendix E: The European Union Challenges and Outlook
37.1 Summary
37.2 The EU Economy
37.3 Anti-EU Trends
37.4 The EU Frail Leadership and Poor Strategic Vision
37.5 Migration and Refugee Crisis
37.6 European Security Worries
37.7 Terrorism
37.8 EU Future Scenarios
38 Appendix F: Europe Migration Crisis & Border Security
38.1 Introduction
38.2 EU Migration: Background
38.3 The European Borders Security
38.3.1 Introduction
38.3.2 The Schengen Area
38.3.3 The European Integrated Border Management System (IBM)
38.3.4 The EU Smart Borders Initiative
38.3.5 The Schengen Zone: Passenger Name Record (PNR) System Outlook
38.3.6 2015-2016 Reintroduction of Border Control
38.4 European Smart & Secure Border Market
39 Appendix G: Abbreviations


[Back to top]

European Homeland Security & Public Safety Technologies & Markets – 2016-2022 – Volume 2

1 European Airport Security Market – 2016-2022
1.1 Scope
1.2 Overview of the European Airport Security
1.3 Major Findings
1.4 Major Conclusions
1.5 European Airport Security: Market Background
1.5.1 Aviation Security Terror Threats
1.5.2 Aviation Security Tactics
1.6 Aviation Security Technologies
1.6.1 X-Ray Screening
1.6.2 Explosive Detection Systems (EDS)
1.6.3 Explosives Trace Detection (ETD)
1.6.4 Biological, Radioactive and Nuclear Detection System
1.6.5 Millimeter Wave Imaging Systems
1.6.6 Canine Screening
1.6.7 Liquid Explosives Detectors
1.6.8 Shoe Scanners – Technologies
1.6.9 Airport Workforce & Visitors ID Documents Screening Systems
1.6.10 Airport Automated Border Control Systems
1.6.11 Airport Video Surveillance
1.6.12 Airport Surface Movement Radar Systems
1.6.12.1 Airport Perimeter Surveillance Radar (PSR) Technology
1.6.12.2 Digital Airport Surveillance Radar (DASR) Technology
1.6.13 Aviation Security C2/C4ISR Systems
1.6.13.1 Aviation Security C2/C4ISR Technologies
1.6.14 Security-related Aviation ICT Technology
1.6.15 Aviation-related Cybersecurity
1.6.16 Airport Perimeter Fencing – Technologies
1.6.16.1 Airport Perimeter Security Technology Background
1.6.17 Airport Perimeter Security Technologies
1.6.18 Workforce & Visitors ID Documents Screening – Technologies
1.6.18.1 Biometric ID Systems
1.6.19 Airport Security-related Baggage Handling Systems (BHS) – Technologies
1.6.20 Qylatron Multi-Modal Multi Threat Automated Screening Checkpoint
1.6.20.1 Hand-held Weapons and CBRNE Detectors
1.6.21 Counter – MANPAD Technology
1.6.21.1 MANPAD Threats
1.6.21.2 Counter – MANPAD Strategies
1.6.22 Counter – MANPAD Technologies
1.6.22.1 Flare-based Countermeasures
1.6.22.2 Directed Infrared Countermeasures (DIRCM) Systems
1.6.22.3 Counter MANPAD RDT&E Programs
1.6.22.4 Counter MANPAD Market Forecast
1.6.23 IATA & ICAO “Checkpoint of the Future”
1.6.23.1 Present People Screening Checkpoint Performance
1.6.23.2 IATA-ICAO Checkpoint of the Future
1.6.24 Airport Passenger Screening Checkpoints
1.6.25 Aviation Security Market Demand Side
1.6.25.1 Airports
1.6.25.2 Airlines
1.6.25.3 Freight Forwarders
1.6.25.4 Customs
1.6.25.5 Security Service Providers
1.6.26 Aviation Passenger Screening Technologies Outlook: 2016-2022
1.6.27 Checked Baggage Screening Market
1.6.28 Air Cargo Screening Technologies & Markets
1.6.28.1 Air Cargo Outlook
1.6.28.2 Air Cargo Related Security Risks
1.6.28.3  Air-Cargo Supply Chain Security
1.6.29 Airport Perimeter Security Technologies & Markets
1.7 European Aviation Security Market
1.7.1 Aviation Security Market Competitive Analysis
1.8 European Aviation Security Standards
1.9 ICAO Airport Security & Safety Regulations
1.1 European Aviation Security Vendors and Product Lines
1.11 European Airport Security Market- 2015-2022
1.11.1 2015 Market Size & 2016-2022 Market Forecast
1.11.2 Market Breakdown by Revenue Source
2 European CBRN & Hazmat Security Market – 2016-2022
2.1 European CBRN & Hazmat Security
2.1.1 ISIS CBRN Threats
2.1.2 The Probability of a CBRN Attack on European Targets
2.1.3 Toxic Industrial Chemicals (TICs)
2.1.4 CBRN Attack Strategy
2.1.5 European CBRN Security Concepts
2.2 The EU CBRN Preparedness and Response Agenda
2.2.1 Scope
2.2.2 The Solidarity Clause
2.2.3 The EU Civil CBRN Protection Mechanism
2.2.4 EU CBRN Crisis Coordination Arrangements
2.2.5 The EU Health Security Committee
2.2.6 The European Centre for Disease Prevention and Control
2.2.7 The EU Civil Protection Mechanism
2.2.8 EU Crisis Coordination Arrangements
2.2.9 The Health Security Committee
2.2.10 The European Centre for Disease Prevention and Control
2.2.11 European CBRN-related Legislation
2.2.12 European Counter CBRN Strategies
2.2.13 European Counter CBRN Terrorism Projects
2.2.14 The Emergency Response Coordination Centre
2.3 European CBRN Threat Mitigation Activities
2.3.1 The EU CBRN Emergencies Cooperation
2.3.2 Recent Activities
2.3.3 European CBRN Security Standards
2.3.4 European CBRN-related Legislation
2.3.5 European Bio-Surveillance Activities
2.4 CBRN: Early Warning Technologies
2.4.1 Chemical Detection Technologies
2.4.2 Biological Detection Technologies
2.4.2.1 PCR
2.4.2.2 Immunoassays and Protein Signatures
2.4.2.3 Genomic Sequencing
2.4.2.4 Mass Spectrometry
2.4.3 Bio Surveillance Technologies and Systems
2.4.4 Nuclear Detectors Technologies
2.5 CBRN Security Systems Demand Side
2.6 CBRN Terror
2.7 Nuclear Radiological Terror
2.8 Chemical Terror
2.9 CBRN Decontamination Technologies
2.1 European CBRN Security & Safety Market – 2015-2022
2.10.1 2015 Market Size & 2016-2022 Market Forecast
2.10.2 Market Breakdown by Revenue Source
3 European Smart Borders & Border Security Market – 2016-2022
3.1 Scope
3.2 The European Borders Security
3.2.1 Introduction
3.2.2 The Schengen Area
3.2.3 European Integrated Border Management (IBM)
3.3 The EU Policy
3.4 EU Migration Crisis: Background
3.5 Europe Borders Security
3.5.1 Introduction
3.5.2 The Schengen Area
3.5.3 The European Integrated Border Management System (IBM)
3.5.4 The EU Smart Borders Initiative
3.5.5 The Schengen Zone: Passenger Name Record (PNR) System Outlook
3.5.6 Temporary Reintroduction of Border Control
3.6 European Smart & Secure Border Market
3.6.1 Europe Smart Borders Projects
3.6.2 Visas Requirements
3.6.2.1 Introduction
3.6.2.2 Post Visa Liberalization Monitoring Mechanism
3.6.2.3 Schengen Evaluation Mechanism
3.6.2.4 FRONTEX Procurement Process
3.7 Major Findings
3.8 Major Conclusions
3.9 Border Security Market Background
3.1 The Defense Industry vs. the Smart Borders & Border Security Market
3.11 Business Models & Strategies
3.11.1 Variable Economic Conditions
3.11.2 Smart Borders, Immigration Enforcement & Border Security Market Tiers
3.12 European States’ Notifications of the Temporary Reintroduction of Border Control at Internal Borders
3.12.1 Smart Borders, Immigration Enforcement & Border Security Market Competitive Analysis
3.13 Europe Smart Borders & Border Security Market – 2015-2022
3.13.1 Market Forecast
3.13.2 Market Breakdown
4 European Intelligence Services Market – 2016-2022
4.1 Scope
4.2 Cooperation between European Intelligence Agencies
4.3 The European Intelligence Centre
4.4 Major Findings
4.5 Major Conclusions
4.6 Market Background
4.7 European Intelligence Services: Market Background
4.7.1 Austria Intelligence Services: Market Background
4.7.1.1 Army Intelligence Office
4.7.1.2 Military Protective Office
4.7.1.3 The Federal Office for the Protection of the Constitution and Counterterrorism (BVT)
4.7.1.4 The Federal Office for the Protection of the Constitution and Counterterrorism
4.7.2 Belgium Intelligence Services: Market Background
4.7.2.1 State Security Service
4.7.2.2 General Information and Security Service
4.7.3 Bulgaria Intelligence Services: Market Background
4.7.3.1 National Intelligence Service
4.7.4 Czech Republic Intelligence Services: Market Background
4.7.4.1 Security Information Service
4.7.4.2 Office for Foreign Relations and Information
4.7.4.3 Military Intelligence (MI)
4.7.5 Denmark Intelligence Services: Market Background
4.7.5.1 Danish Security and Intelligence Service
4.7.5.2 Danish Defence Intelligence Service (DDIS)
4.7.5.3 Army Intelligence Center (HEC)).
4.7.6 Finland Intelligence Services: Market Background
4.7.6.1 Finnish Security Intelligence Service (SUPO)
4.7.6.2 Finnish Defence Intelligence Agency (FDIA)
4.7.7 France Intelligence Services: Market Background
4.7.7.1 Domestic Counter-terrorism & Counter-espionage Intelligence (DGSI)
4.7.7.2 Central Directorate of the Judicial Police (DCPJ)
4.7.7.3 General Directorate for External Security (DGSE)
4.7.7.4 Directorate of Protection and Defense Security (DPSD)
4.7.8 Counter Terror & Crime Intelligence Market Competitive Analysis
4.8 European Intelligence Services Market – 2016-2022
4.8.1 Market Forecast
4.8.2 Market Breakdown
5 European Critical Infrastructure Protection Market – 2016-2022
5.1 Scope
5.2 Major Findings
5.3 Critical Infrastructure Security Management
5.4 Critical Infrastructure Security Market Background
5.4.1 Critical Infrastructure Protection: Threats
5.4.2 Critical Infrastructure Protection Tactics
5.4.3 Critical Infrastructure Vulnerabilities
5.4.4 Planning of Critical Infrastructure Security
5.4.5 Critical Infrastructure Strategy Outlook
5.4.6 Critical Infrastructure Protection Information Sharing with the Private Sector
5.4.7 Private Sector Critical Infrastructure Risk Assessments
5.4.8 Prioritize the European Private Sector Critical Infrastructure Industry Focus Areas
5.5 Banking & Finance Critical Infrastructure Protection Market
5.5.1 Market Definition
5.5.2 Banking & Finance Security Market Analysis
5.5.3 Business Continuity
5.5.4 Market Structure
5.5.5 Market Characteristics
5.6 Water Infrastructure Security
5.6.1 Water Infrastructure: Market Definition
5.6.2 Water Infrastructure Market Analysis
5.6.3 Responses to Water Terror-Related Security Concerns
5.6.4 Water Industry Security: Market Structure
5.7 Electric Power Industry Security
5.7.1 Electric Power Industry: Background
5.7.1.1 The Energy Industry Interdependencies
5.7.2 Electric Power Industry Security Vulnerabilities
5.7.3 Electric Power Industry Cyber Security Capability Gaps
5.7.4 Electric Power Industry Security Market Structure
5.8 European Civil Nuclear Power Industry Security
5.8.1 European Commercial Nuclear Power Reactors
5.8.2 Nuclear Power Plants: Risk of Terror
5.8.3 Nuclear Power Plants Market Structure
5.9 Chemical Industry Security
5.9.1 European Chemical Industry Overview
5.9.2 Relationships with Other Industries
5.9.3 The Chemical Industry Structure
5.9.4 Chemical Industry Security
5.9.5 Market Analysis
5.1 European Critical Infrastructure Protection Market
5.11 Europe Critical Infrastructure Protection Market- 2015-2022
5.11.1 2015 Market Size & 2016-2022 Market Forecast
5.11.2 Market Breakdown by Revenue Source
6 European Police & Other 1st Responders Market – 2016-2022
6.1 Scope
6.2 Police Forces vs. Terror
6.3 European Law Enforcement, Police Modernization & 1st Responders: Market Background
6.3.1 European Law Enforcement Agencies and Police Modernization Funding
6.4 European Law Enforcement, Police Modernization & 1st Responder Market: Competitive Analysis
6.5 European Police Modernization & Other 1st Responders Market- 2015-2022
6.5.1 2015 Market Size & 2016-2022 Market Forecast
6.5.2 Market Breakdown by Revenue Source
7 European Maritime Security Market – 2016-2022
7.1 Major Findings
7.2 Major Conclusions
7.3 European Union Maritime Security Strategy (EUMSS)
7.4 The European Maritime Security Strategy
7.5 Maritime Migrations
7.5.1 The Container Security Initiative (CSI)
7.6 Market Background
7.6.1 Maritime Security Infrastructure
7.6.2 Port Critical Infrastructure Operations
7.7 European Legislation
7.8 European Maritime Security Market – 2015-2022
8 European Mass Transportation Security Market – 2015-2022
8.1 Scope
8.2 European Mass Transportation Security Background
8.3 Key Findings
8.4 The European Mass Transportation Industry Security
8.4.1 European Mass Transportation Industry
8.4.2 European Mass Transportation Risk Management
8.4.2.1 Managing and Coordinating Transportation Industry Security Responsibilities
8.4.2.2 Mass Transportation Industry Cross-Sector Security Related Dependencies
8.5 Mass Transportation Security of High Value Assets
8.6 European Mass Transportation Security Market – 2015-2022
9 European Public Events Security Market – 2016-2022
9.1 Scope
9.2 European Public Event Security Background
9.3 European Public Events Security Market – 2015-2022


[Back to top]

European Homeland Security & Public Safety Technologies & Markets – 2016-2022 – Volume 3

1 European Oil – Gas Security Market 2016-2022
1.1 Scope
1.2 European Oil-Gas Industry Security: Market Background
1.3 Threats to the Oil-Gas Industry Infrastructure
1.4 Oil-Gas Industry Security Market: Competitive Analysis
1.5 European Oil-Gas Industry Security Market
1.5.1 Introduction
1.5.2 Major Findings
1.5.3 Major Conclusions
1.6 European Oil-Gas Industry Security: Market Background
1.7 European Oil-Gas Industry Security Market – 2015-2022
1.7.1 Market Forecast
1.7.2 Market by Revenue Category
1.7.3 Market Breakdown
2 European Safe Cities Market – 2016-2022
2.1 Scope
2.2 Introduction
2.3 Major Findings
2.4 Major Conclusions
2.5 Safe City vs. Smart City
2.5.1 Safe City Projects
2.6 UK Safe City Market Background
2.6.1 UK Urban Security
2.6.2 Urban Crime in the UK
2.6.3 UK Safe City Projects
2.6.3.1 UK Safe City Projects: Introduction
2.6.4 London – A Safe City
2.6.5 Glasgow – A Safe City
2.7 Germany Safe City Market Background
2.7.1 German Security Policy
2.7.2 Urban Crime in Germany
2.7.3 Germany Safe City Projects
2.7.3.1 Stuttgart Safe City
2.8 France Safe City Market Background
2.8.1 Urban Crime in France
2.8.2 France Safe City Projects
2.8.3 Netherlands Safe City Market Background
2.8.3.1 Security Policy
2.8.3.2 Urban Crime in Netherlands
2.8.4 Netherlands Safe City Projects
2.8.4.1 Rotterdam – A Safe City
2.9 Spain Safe City Market Background
2.9.1 Urban Crime in Spain
2.9.2 Spain Safe City Projects
2.1 Russia Safe City Market
2.10.1 Countering Urban Terrorism
2.10.2 Urban Crime in Russia
2.10.3 Russia Safe City Projects
2.11 Safe City Technologies and Services
2.11.1 Safe City Physical Security Information Management (PSIM)
2.11.2 Safe City Public-Safety Answering Point (PSAP)
2.11.3 Safe City Sensor ICT Networks
2.11.4 Safe City Wireless Sensor Networks
2.11.5 Safe City Software as a Service (SaaS)
2.11.6 Safe City Social Media Emergency Response
2.11.7 Safe City Planning
2.11.8 Safe City Location Based Emergency Mass Notification Systems (EMNS)
2.11.9 Safe City Cell Broadcast Application
2.11.10 Safe City SCADA Systems
2.11.11 Safe City, Managed Security Services (MSS)
2.11.12 Safe City Communication
2.11.13 Safe City Video Surveillance Technologies
2.11.14 Safe City Video Analytics Technologies
2.11.15 Safe City Physical Identity and Access Management (PIAM)
2.11.16 Emergency Management Software
2.11.17 Safe City Cloud Computing, Data Mining & Analytics
2.11.18 Safe City Command & Control systems
2.11.19 Gunshot Identification & Location Systems
2.11.20 Safe City Emergency Transportation Management Systems
2.12 European Safe Cities Market: Competitive Analysis
2.13 European Safe Cities Market – 2015-2022
2.13.1 Market Forecast
2.13.2 Market by Revenue Category
2.13.3 Market Breakdown
3 European Buildings Security Market – 2016-2022
3.1 Scope
3.2 The European Buildings Security Sector
3.3 Europe Buildings Security: Market Background
3.4 Buildings Security Technologies
3.4.1 Dual Use Building Security Systems
3.4.2 Physical Barriers
3.4.3 Fencing
3.4.4 Lighting
3.4.5 Locks
3.4.6 Multi-Layered Buildings Security
3.4.7 Multi-Sensor Fusion
3.4.8 Buildings Security CCTV Surveillance
3.4.9 Automatic Building Intrusion Assessment
3.4.10 External Buildings Security
3.4.11 Video Surveillance Management
3.4.12 Buildings Security Command and Control
3.4.13 Buildings Security Technologies
3.4.14 Buildings Security Communications
3.4.15 Buildings Security Command and Control Systems
3.4.16 Building Access Control
3.4.17 Biometric Systems
3.5 European Buildings Security Market – 2015-2022
3.5.1 Market Forecast
3.5.2 Market by Revenue Category
3.5.3 Market Breakdown
4 European Perimeter Security Market – 2016-2022
4.1 Europe Perimeter Security: Market Background
4.1.1 Major Findings and Conclusions
4.1.2 Perimeter Security Challenges
4.1.3 Perimeter Security: Risk Management
4.1.4 European Perimeter Security Standards and Regulations
4.2 Perimeter Security Technologies
4.2.1 Perimeter Security Technologies Performance, Device Cost, Installation & Aftersales Costs Comparison
4.2.2 Intrusion Detection Sensors
4.2.3 Multi-layered Perimeter Security
4.2.4 Multi-Sensor Perimeter Security Fusion
4.2.5 CCTV Surveillance
4.2.6 Automatic Perimeter Intrusion Assessment
4.2.7 Perimeter Security: Command and Control
4.2.8 Perimeter Security: Communications
4.2.9 Perimeter Security: Command and Control Systems
4.2.10 Workforce & Visitors ID Documents Screening – Technologies
4.2.11 Biometric ID Systems
4.2.12 Passive Infrared (PIR) Motion Detection
4.2.13 Access Control Systems
4.2.14 Standoff Threat Detection Technologies
4.2.15 Pipeline Technologies
4.3 European Perimeter Security (w/o CIP) Market – 2015-2022
4.3.1 Market Forecast
4.3.2 Market by Revenue Category
4.3.3 Market Breakdown
5 European Immigration Enforcement Market – 2016-2022
5.1 Introduction
5.2 Major Findings
5.3 Key Conclusions
5.4 Major Challenges
5.5 Europe’s 2015 Refugee Crisis
5.6 Schengen Visas
5.7 Schengen Information System
5.8 Frontex
5.9 The External Borders Fund
5.1 The Prüm Treaty
5.11 European Immigration Enforcement Market – 2015-2022
5.11.1 Market Forecast
5.11.2 Market by Revenue Category
5.11.3 Market Breakdown
6 European Other Homeland Security & Public Safety Vertical Markets- 2015-2022
6.1 Market Forecast
6.2 Market by Revenue Category
6.3 Market Breakdown
7 European Bio-Terror & Infectious Disease Detection and Mitigation Market – 2016-2022
7.1 Market Background
7.2 European Biosecurity
7.2.1 European Bio-Terror & Infectious Disease Detection and Mitigation Standards
7.2.2 Biosecurity and Biosafety
7.2.3 European CBRN Defense Strategy
7.2.4 European Commission Bio-Preparedness Actions
7.2.5 European Bio-Terror & Infectious Disease Detection and Mitigation Legislation
7.2.6 EU Biosafety and Biosecurity Initiatives
7.2.7 Europe Infectious Diseases Threat Perception
7.2.8 European Bio-Surveillance Strategy
7.2.9 Bio-Terror & Infectious Disease Early Alert System
7.2.10 Management Structure
7.2.11 Early Response to Major Pandemics
7.3 Bio-Detection Technologies and Market Background
7.3.1 Sampling the Environment
7.3.2 Bio-Detectors in a Multitude of Ambient Settings
7.3.3 Bio-Detection Triggering
7.3.4 Sample Collection
7.3.5 Bio-Particle Detectors
7.3.6 Bio-Agents & Infectious Disease Identification
7.3.7 National Biosurveillance Systems
7.4 Bio-Agents & Infectious Disease Detection: Homeland Security & Public Safety Applications
7.5 European Bio-Agents & Infectious Disease Mitigation Market – 2015-2022
7.5.1 Market Forecast
7.5.2 Market by Revenue Category
7.5.3 Market Breakdown
8 European Biometrics Market – 2016-2022
8.1 Scope
8.2 The European Biometric Market
8.3 Biometric Technologies & Market Background
8.3.1 Review of Biometric Technologies
8.3.2 Fingerprint Recognition
8.3.3 Facial Recognition
8.3.4 Iris Recognition
8.3.5 Hand Geometry
8.3.6 Voice Verification
8.3.7 Signature Recognition
8.3.8 Keystroke Recognition
8.3.9 Palm Recognition
8.3.10 Vein and Vascular Recognition
8.3.11 Multimodal Biometric Systems
8.3.12 Fused Remote Video Surveillance and Biometric Technology
8.3.13 Fused Multi-modal Biometric Remote People Screening Portals
8.3.14 Advantages of Biometric Identification
8.3.15 Technological Approaches
8.3.16 Biometric System Components
8.4 Biometric Systems: Performance Valuation
8.4.1 Receiver Operating Characteristic (ROC) Evaluation
8.4.2 Technology Assessment
8.4.3 Situation Assessment
8.4.4 Working Assessment
8.5 Pipeline Biometric Technologies
8.5.1 Facial Thermography Biometrics
8.5.2 DNA Recognition Biometrics
8.5.3 Gait Recognition Biometrics
8.5.4 Odor Biometrics
8.5.5 Nail-bed Recognition Biometrics
8.5.6 Skin Reflectivity Biometrics
8.5.7 Ear Shape Recognition Biometrics
8.5.8 Lip Movement Recognition Biometrics
8.6 European Biometric Border Control & Immigration Enforcement
8.7 Remote Biometric Identification Technologies
8.8 Terrorist Watch Lists
8.9 Biometrics Standards and Legislation
8.1 Homeland Security & Immigration Enforcement Applications
8.11 Key Biometrics Vendors
8.12 Biometrics: Business Opportunities & Challenges
8.13 European Counter Terror, Counter Crime & Immigration Enforcement Biometrics Market – 2015-2022
8.13.1 2015 National Markets & 2016-2022 Forecast
8.13.2 Market Breakdown by Country – 2015-2022
8.13.3 Market by Revenue Source – 2015-2022
8.13.4 Market Breakdown by Revenue Source – 2015-2022
9 European Counter-Terror & Public Safety C2/C4ISR Systems Market – 2016-2022
9.1 Scope
9.2 C2/C4ISR Market & Technology Background
9.3 Automated Command, Control and Information (C2-I) Systems
9.3.1 Automated C2-I Market Background
9.3.2 Automated C2-I Target Architecture
9.3.3 Automated C2-I Command Function
9.3.4 Automated C2-I Communications
9.3.5 Automated C2-I Security
9.3.6 Automated C2-I Model Selection
9.3.7 Automated C2-I Service
9.3.8 Business Goals and Objectives
9.4 C2/C4ISR Assessment Procedure
9.5 C2/C4ISR Systems: Business Opportunities
9.6 European Homeland Security & Public Safety C2/C4ISR Systems Market – 2015-2022
9.6.1 Market Forecast
9.6.2 Market by Revenue Category
9.6.3 Market Breakdown
10 European Chemical, Hazmat & Nuclear Detection Market – 2016-2022
10.1 Technology Background
10.1.1 Scope
10.1.2 Chemical Agent Detection Technologies
10.1.3 Nuclear/Radiological Detection Technologies
10.1.3.1 The Advanced Spectroscopic Portal (ASP)
10.1.3.2 Human Portable Radiation Detection Systems (HPRDS) Program
10.1.3.3 Nuclear- Radiological People Screening Portals
10.2 Market Background
10.2.1 Chemical Plant Security
10.2.2 Nuclear/Radiological Detection Markets
10.3 Chemical, Hazmat & Nuclear Detection: Business Opportunities & Challenges
10.4 European Chemical, Hazmat & Nuclear Detection Market – 2015-2022
10.4.1 Market Forecast
10.4.2 Market by Revenue Category
10.4.3 Market Breakdown
11 European Communication Systems & Devices Market – 2016-2022
11.1 Scope
11.2 Market Background
11.3 Emergency Communication: Technology Background
11.4 Communication Equipment Market: Business Opportunities
11.4.1 Managed Services for Shared/Core Services
11.4.2 Migration from “Simple” to “Integrated” Networks
11.5 European Communication Interoperability
11.5.1 Who is Guiding Interoperable Communications?
11.5.2 Types of Communication Interoperability
11.5.3 Interoperability Levels
11.5.3.1 Level 1 – Swap Radios
11.5.3.2 Level 2 – Talkaround or “Directed Net”
11.5.3.3 Level 3 – Mutual Aid
11.5.3.4 Level 4 – Gateway (Console Patch)
11.5.3.5 Level 5 – System-Specific-Roaming (Trunked & Conventional)
11.5.3.6 Level 6 – Standards Based Shared Systems (Trunked & Conventional)
11.6 Why is Interoperability Important?
11.7 Interoperability Problems
11.7.1 800 MHz Misconceptions
11.7.2 Limitations of 800 MHz Systems at Large Scenes
11.7.3 Trunked vs. Untrunked Networks
11.7.4 Trunked Networks
11.7.4.1 Untrunked Networks
11.7.5 The Difference between Mobile Cellular and Professional Mobile Radio (PMR)
11.7.6 Potential Interoperability Solutions
11.7.6.1 Option 1: Using the Same Radios or Communications Systems
11.7.6.2 Option 2: Gateway Devices
11.7.6.3 Option 3: Radio Interoperability Using IP
11.7.7 European Interoperability – Available Spectrum
11.7.8 Barriers to Municipal Wireless Broadband Deployments in Europe
11.7.9 Funding
11.7.10 Challenges for European Interoperability
11.7.11 Communication Interoperability: Technology Choice in Europe
11.7.12 Broadband Challenges in Europe
11.7.13 Frequency and Standards in Europe
11.7.14 The Narrowband to Broadband Trend
11.7.15 Usage of Mobile Data in Field Operations
11.7.16 Cost of Radio Coverage
11.7.17 Availability of Wideband PMR Spectrum
11.7.18 IP-Based Public Safety Communication
11.7.19 Pan- European Satellite Telecom Adaptor
11.7.20 TETRA
11.7.21 Alleged Airwave Problems
11.7.22 TETRA 2
11.7.23 TETRAPOL
11.7.24 TETRAPOL Presence
11.7.25 TETRAPOL Network Example
11.7.26 TETRA vs. TETRAPOL
11.8 The NARTUS Project (EU Harmonization in Public Safety Communication & Information Systems)
11.9 Project MESA – Broadband Mobility for Emergency & Safety Applications
11.1 U-2010 – European Cooperation Initiative
11.11 Making Interoperability Cost-Effective
11.12 Handset Market
11.13 European Homeland Security & Public Safety Communication Systems & Devices Market by Country – 2015-2022
11.13.1 2015 National Markets & 2016-2022 Forecast
11.13.2 Market Dynamics by Country – 2016-2022
11.13.3 Market Breakdown by Country – 2015-2022
11.14 Market by Revenue Source – 2015-2022
11.14.1 2015 Market & 2016-2022 Forecast
11.14.2 Market Breakdown by Revenue Source – 2015-2022
12 European Counter-IED Technologies Market – 2016-2022
12.1 Counter-IED Technology & Market Background
12.1.1 Maintenance and Upgrades (Particularly of Jammers, and Armored Trucks)
12.1.2 Sensors and Other Electronic Systems Upgrade/s
12.1.3 Standoff Suicide Bombers Detection
12.1.4 Suicide Bombers Detonation Neutralization
12.1.5 Standoff Detection of VBIED
12.1.6 VBIED Detonation Neutralization
12.1.7 Standoff Explosive Detection in Urban Environment
12.1.8 Large Area IED Detection Coverage
12.1.9 IED Placement Detection
12.2 Counter-IED Technologies: Business Opportunities & Challenges
12.3 European Counter-IED Technologies Market – 2015-2022
12.3.1 Market Forecast
12.3.2 Market by Revenue Category
12.3.3 Market Breakdown
13 European Cybersecurity Market – 2016-2022
13.1 The European Cybersecurity Eco-System
13.1.1 European Cyberterrorism & Cybercrime
13.1.2 Cyber Warfare
13.1.3 The European Cybersecurity Policy
13.2 Cybersecurity Technologies & Market Background
13.2.1 Endpoint Security: Technology & Market Background
13.2.2 Identity & Access Management: Technology & Market Background
13.2.3 Mobile Enterprise Management: Technology & Market Background
13.2.4 Mobile Security: Technology & Market Background
13.2.5 Security Information & Event Management (SIEM): Technology & Market Background
13.2.6 Security Information Overload
13.2.6.1 Example: IBM QRadar Security Intelligence Platform
13.2.7 Content Security: Technology & Market Background
13.2.8 Malware Mitigation: Technology & Market Background
13.2.8.1 Market Drivers
13.2.9 Data Loss Prevention: Technology & Market Background
13.2.9.1 Market Drivers
13.2.10 Datacenter Security: Technology & Market Background
13.2.10.1 Market Drivers
13.2.11 Firewalls: Technologies & Market Background
13.2.12 Next Generation Firewall: Technology & Market Background
13.2.13 Intrusion Prevention Systems & Intrusion Detection (IDS/IPS) Technologies & Market Background
13.2.13.1 IDS/IPS Market Ecosystem
13.2.13.2 Market Drivers
13.2.14 Unified Threat Management (UTM) Technology & Market Background
13.2.14.1 UTM Market Drivers
13.2.15 Cloud-Based Services: Technology & Market Background
13.2.15.1 Hybrid Cloud
13.2.15.2 Market Drivers
13.2.16 Vulnerability/Risk Management & Managed Security Services & Market Background
13.2.17 Denial of Service
13.2.18 Deliberate Manipulation of Information
13.2.19 Detection of Unauthorized Activity
13.2.20 Anti-Malware Cybersecurity
13.2.21 Privacy Enhanced Technologies (PETs)
13.2.22 Digital Identity Management (DIM)
13.2.23 Digital Identity Management Services
13.2.24 Digital Identity Management Identity Federation
13.2.25 Digital Identity Management System Competences
13.3 European Digital Identity Management Research
13.4 Cybersecurity Standards and Regulations
13.4.1 ISO 27001 and 27002 Standards
13.4.2 Standard of Good Practice
13.4.3 NERC Standards
13.4.4 NIST Standards
13.4.5 RFC 2196 Standards
13.4.6 ISA/IEC-62443 Standards
13.4.7 Planned and Published ISA-62443 IACS Security Standards.
13.4.7.1 ISA-62443 Standards
13.4.7.2 General Standards
13.4.8 Policy and Procedure Standards
13.4.9 System Integrator Standards
13.4.10 Component Provider Standards
13.4.11 ISA Security Compliance Institute
13.4.12 The U.K. IASME Standards
13.4.13 Payment Card Industry Security Standard (PCI DSS)
13.4.13.1 PCI DSS of Major Debit, Credit, Prepaid, E-Purse, ATM, and POS Cards
13.4.13.2 PCI DSS Requirements
13.4.13.3 U.S. Mandated Compliance
13.4.13.4 Compliance and Wireless LANs
13.4.14 IT Security Standards
13.4.14.1 ISO 27000 Series of Standards
13.4.15 The E.U. Banking and Financial Services Cyber-Security Regulations
13.4.15.1 E.U. Financial Services Regulations
13.4.15.2 Financial Services Legislation in Force
13.4.15.3  FATF International financial services Standard
13.4.15.4 Cybercrime, Money Laundering & Terrorist Financing Pipeline Legislation
13.4.16 Digital Identity Management Standards
13.5 Recommendations for Cybersecurity Managers
13.6 European Cybersecurity Challenges
13.7 Cybersecurity Risk Assessment
13.8 The International Treaty on Cybercrime
13.9 Cybersecurity Business Opportunities
13.1 European Cybersecurity Market – 2015-2022
13.10.1 2015 National Markets & 2016-2022 Forecast
13.10.2 Market by Revenue Source – 2015-2022
13.10.3 Market Breakdown Revenue Source – 2015-2022
14 European CBRN & Hazmat Incidents Decontamination Market – 2016-2022
14.1 CBRN & Hazmat Decontamination Technology Background
14.1.1 Decontamination of CBRN & Hazmat Incidents
14.1.2 Decontamination Core Technologies
14.1.3 The Decontamination Cycle
14.2 Decontamination Strategy
14.3 CBRN & Hazmat Decontamination Market Background
14.4 The Decontamination Industry
14.5 European Decontamination of CBRN & Hazmat Incidents Market – 2015-2022
14.5.1 Market Forecast
14.5.2 Market by Revenue Category
14.5.3 Market Breakdown
15 European Electronic Fencing Market – 2016-2022
15.1 Electronic Fences Technologies and Market Background
15.1.1 Vibration Sensors Mounted on Fence
15.1.2 Capacitance Sensors Fence
15.1.3 Strain Sensitive Cables Fence
15.1.4 Fiber Optic Fence
15.1.5 Taut Wire Fence
15.1.6 Ported Coax Buried Line Fence
15.1.7 Buried Geophone Fence
15.1.8 Electronic Fencing: Business Opportunities & Challenges
15.2 European Electronic Fencing Market – 2015-2022
15.2.1 Market Forecast
15.2.2 Market by Revenue Category
15.2.3 Market Breakdown


[Back to top]

European Homeland Security & Public Safety Technologies & Markets – 2016-2022 – Volume 4

1 European Explosives Trace Detection (ETD) Market – 2016-2022
1.1 European Explosives Trace Detection: Major Findings
1.2 European Explosives Trace Detection: Major Conclusions
1.3 ETD Technologies and Market Background
1.3.1 ETD Background
1.3.2 Ion Mobility Spectroscopy (IMS)
1.3.3 Current Explosives & Narcotics Detection Technologies Map
1.3.4 ETD vs. Bulk Explosives & Narcotics Detection: Pros & Cons
1.3.5 Handheld and Desktop ETD
1.3.6 Airport Boarding Gate Explosives Scanners
1.3.7 Vehicle Screening ETD Systems
1.4 Pipeline ETD Technologies
1.4.1 Nanotechnology Explosives and Narcotics Trace Detection: Challenges
1.4.2 Receptor-based ETD
1.4.3 Molecularly Imprinted Polymers Based ETD
1.4.4 Nano-mechanical Sensor Based ETD
1.4.5 Electronic Nose Based ETD
1.4.6 Silica Micro-cantilever Based ETD
1.4.7 Surface Enhanced Raman Scattering Based ETD
1.4.8 Hybrid Nano-sensor Based ETD
1.4.9 Protein Coated Carbon Nanotubes, Nano Based ETD
1.4.10 Piezo-resistive Polymer Cantilever Nano Based ETD
1.4.11 Inkjet Based Wireless Sensor ETD Technology
1.4.12 Amino-silane Coated Nanowires Arrays Based ETD
1.4.13 Free-surface Microfluidic Control of Surface-Enhanced Raman Spectroscopy Based ETD
1.4.14 Trace Chemical Vapor Detection Cartridge
1.4.15 Free Surface Microfluidic Chip
1.4.16 Continuous Pre-concentrator
1.4.17 Raman Chemical Specific Signatures
1.4.18 Molecularly Imprinted Polymers Explosives and Narcotics Detection Kit
1.4.19 Quantum Sniffer™ Portable ETD
1.4.20 Cantilever Nano-Mechanical Sensors
1.4.21 Sensor Array and Neural Network Based ETD
1.4.22 Temperature-stepped Desorption Based ETD
1.4.23 Trace Detection of Nitrogen-Based Explosives with UV-PLF
1.4.24 Non-Contact Explosives and Narcotics Harvesting ETD
1.4.24.1 Non-Contact Harvesting
1.4.24.2 ETD Transport
1.4.24.3 ETD Analysis
1.4.24.4  ETD Reporting
1.4.25 Check Point Explosives and Narcotics Detection System
1.4.26 Trace Detection of Small Molecules by Pulsed-Ultraviolet Laser Raman Spectroscopy
1.4.27 Sensing Trace Amounts of Nitro-Aromatic Explosives and Narcotics Using Nanowire-Nanocluster Hybrids
1.4.28 Detection of Explosives and Narcotics at Trace Levels by Laser-Induced Breakdown Spectroscopy (LIBS)
1.4.29 Universal Explosive Detection System
1.4.30 MEMS-Based Explosive Particle Detection and Remote Particle Stimulation
1.4.31 Laser Vaporization of Trace Explosives and Narcotics for Enhanced Non-Contact Detection
1.4.32 Advanced Materials and Sensor Platforms
1.5 European Explosives Trace Detection (ETD) Market – 2015-2022
1.5.1 Market Forecast
1.5.2 Market by Revenue Category
1.5.3 Market Breakdown
2 European Intrusion Detection Systems Market – 2016-2022
2.1 Intrusion Detection Systems: Technologies and Market Background
2.1.1 Access Control Systems
2.1.2 Video Surveillance Systems
2.1.3 Passive Motion Detection
2.1.4 Access Control Systems
2.2 European Intrusion Detection Systems Market – 2015-2022
2.2.1 Market Forecast
2.2.2 Market by Revenue Source
2.2.3 Market Breakdown
3 European Metal Detectors Market – 2016-2022
3.1 Metal Detectors Technologies and Market Background
3.1.1 European Metal Detectors Market Background
3.1.2 Hand-Held (HH) Metal Detectors
3.1.3 Single Zone Metal Detection Portals
3.1.4 Multi-Zone Metal Detection Portals
3.1.5 Matrix Metal Detection Portals
3.2 Major Metal Detector Vendors
3.3 European Metal Detectors Market – 2015-2022
3.3.1 Market Forecast
3.3.2 Market by Revenue Category
3.3.3 Market Breakdown
4 European Natural & Manmade Disaster Mitigation Technologies Market – 2016-2022
4.1 Market & Technology Background
4.2 Training and Education Markets
4.3 Emergency Medical Services (EMS)
4.4 Emergency Management Software
4.5 Mass Emergency Notification Technologies
4.5.1 Introduction
4.5.2 Text Alert Systems
4.5.3 Voice Alert Systems
4.5.4 Siren Systems
4.5.5 Cell broadcast Mass Emergency Notification
4.5.6 Mass Emergency Notification: Applications
4.6 European Natural & Manmade Disaster Mitigation Market – 2015-2022
4.6.1 Market Forecast
4.6.2 Market by Revenue Category
4.6.3 Market Breakdown
5 European Non-Lethal Weapons Market – 2016-2022
5.1 Major Findings
5.2 Major Conclusions
5.3 Non-Lethal Weapons Technology Background
5.4 Non-Lethal Weapon Technologies
5.4.1 Kinetic Non-Lethal Weapons
5.4.2 Direct-Fired Non-Lethal Projectiles
5.4.3 Concurrently Launched Multiple Kinetic Projectiles
5.4.4 NLW “Sting-ball” Grenades
5.4.5 Chemical Non-Lethal Systems
5.4.6 Area Denial NLW Procedures:
5.4.7 Optical NLW Incapacitation Devices
5.4.8 Acoustical Non-Lethal Devices
5.4.9 Electro-Muscular NLW
5.5 Counter-Personnel NLW Technologies
5.5.1 Overview
5.5.2 Electromagnetic NLW Technologies
5.5.2.1 Microwave NLW
5.5.2.2 Electromagnetic Launcher
5.5.2.3 Electromagnetic Mines
5.5.2.4 Laser Based NLW
5.5.2.5 Multi-Purpose Dazzling Laser
5.5.2.6 Pain Generation Laser
5.5.3 Active Denial Weapon Microwave Technology
5.5.4 Chemical NLW Technologies
5.5.5 Acoustic NLW Technologies
5.5.5.1 Overview
5.5.5.2 Directional Multi-Effects Acoustic System
5.5.6 Mechanical NLW Technologies
5.5.6.1 Non-lethal Barriers and Entanglements
5.5.6.2 Rapid Barriers
5.5.6.3 Nets & Entanglement Techniques
5.5.7 Kinetic NLW Technologies
5.5.7.1 Overview
5.5.7.2 Stun Devices
5.5.7.3 Stun Batons
5.5.7.4 Vortex Generator
5.5.7.5 Airbag Stoppers
5.5.7.6 Paints and Dyes
5.5.8 Water Cannons
5.5.9 Area Denial and Barrier Technologies
5.5.10 Combined Technologies
5.6 Counter-Material NLW Technologies
5.6.1 Overview
5.6.2 Electromagnetic Technologies
5.6.2.1 Radio Frequency (RF) NLW Devices
5.6.2.2 Laser Based NLW
5.6.3 Chemical Technologies
5.6.3.1 Chemical Agents
5.6.3.2 Slippery Foams
5.6.3.3 Sticky Foams
5.6.3.4 Super-Adhesive Substances
5.6.3.5 Super-Caustic Substances/Liquid Metal Embrittlement
5.6.3.6 Graphite Powders
5.6.3.7 Biological Technologies
5.6.4 Mechanical Technologies
5.6.4.1 Rapid Barriers
5.6.4.2 Nets & Entanglement Techniques
5.6.4.3 Tire Puncturing Techniques
5.7 NLW Technology Outlook-2016-2022
5.7.1 Counter-Personnel NLW Outlook
5.7.2 Improved Flash Bang Grenade
5.7.3 Airburst Non-Lethal Munitions
5.7.4 Active Denial Tech System
5.7.5 MK19 Non-Lethal Munitions
5.7.6 Joint Non-Lethal Warning Munitions
5.7.7 40 mm Human-Electro-Muscular Incapacitation Projectile
5.7.8 Mission Payload Module
5.7.9 Distributed Sound and Light Array
5.8 Counter-Material Non-Lethal Technologies Outlook
5.8.1 Vehicle Lightweight Arresting Device Single Net Solution and Remote Deployment Device
5.8.2 Pre-emplaced Electric Vehicle Stopper
5.8.3 Small Vessel Stopping Entanglement
5.8.4 Multi-Frequency Radio-Frequency Vehicle Stopper
5.8.5 High Power Microwave Vehicle Stopper
5.9 Less-Lethal Weapons: Market Background
5.1 European Non-Lethal Weapons Market – 2015-2022
5.10.1 Market Forecast
5.10.2 Market by Revenue Category
5.10.3 Market Breakdown
6 European Personal (Ballistic & CBRNE) Protective Gear Market – 2016-2022
6.1 Scope
6.2 Market & Technology Background
6.2.1 Introduction
6.2.2 Personal Body Armor
6.2.3 CBRN Air-purifying Escape Respirators (CBRN APER)
6.2.4 CBRN and Hazmat Personal Protective Gear
6.2.5 Key Vendors
6.2.6 Main Customers
6.2.7 European Personal (Ballistic & CBRNE) Protective Gear Standards
6.3 European Personal (Ballistic & CBRNE) Protective Gear Market – 2015-2022
6.3.1 Market Forecast
6.3.2 Market by Revenue Category
6.3.3 Market Breakdown
7 European Standoff Explosives & Weapon Detection Market – 2016-2022
7.1 Market Background
7.1.1 Comparison of Standoff IED, PBIED & VBIED Detection Technologies
7.2 Standoff Walk-by & Pass-through Threat Detection Corridors Technologies
7.2.1 Passive Electro Magnetic Signature Corridor
7.2.2 Standoff Passive MMWave Doorways
7.2.3 Focal Plane Array Passive MMWave
7.2.4 Walk-by Passive MMWave Imaging System
7.2.5 Walk-through Corridors: Fourier Transform Infrared (FTIR) Spectroscopy Systems
7.2.6 Covert Walk-through Biometric Identification Corridors
7.2.7 Fused Standoff PBIED Detection &Video-based Biometrics
7.2.8 Walk-by Active Centimeter Range (Ku band) Microwave System
7.3 Open Space Standoff Explosives & Weapon Detection Technologies
7.3.1 Introduction
7.3.2 Open Space Standoff Explosives & Weapon Detection Technologies Challenges
7.3.3 Bi-Modal Standoff IED, PBIED & VBIED Explosives & Weapon Detection Systems
7.3.3.1 Sample: Standoff Fused MMWave & Infrared System
7.4 Standoff Vehicle-Borne Explosives Detection: Technologies
7.4.1 Overview
7.4.2 VBIED Detection: Challenges
7.4.3 Example: Raman Spectroscopy Based Vehicle Standoff Detector – P. Eye
7.5 Standoff IED, PVIED & VBIED UGV Detection Technologies
7.5.1 UGV Expectation Management
7.5.2 UGV Requirements Management
7.5.3 UGV Mobility
7.5.4 UGV Function
7.5.5 The Human Operator
7.5.6 Future IED, PBIED & VBIED Detection UGV
7.5.7 Cobham Antenna Systems Standoff IED, PVIED & VBIED UGV IED Detection Technology
7.5.8 Israel Aerospace Industries CIMS System
7.5.9 Rafael – EZ-K9e Stand-off MMWave IED Detection System
7.6 Multi-Modal Fused IED, PBIED and VBIED Detection Technologies
7.6.1 Technology Review
7.6.2 Example: The CounterBomber® System
8 Standoff IED, PBIED & VBIED Detection Pipeline Technologies
8.1 Introduction
8.2 Standoff Active MMWave PBIED, VBIED & IED Detection
8.2.1 Principle of Operation
8.2.2 Active Standoff MMWave Imaging Systems
8.2.3 Disadvantages of Standoff Active MMWave Technology
8.3 Standoff Passive MMWave Imaging
8.3.1 Principle of Operation
8.3.2 Advantages of a Passive Millimeter Wave (PMMW) System:
8.3.3 TREX Enterprises Standoff Passive MMWave Technology
8.3.4 GEN2 Standoff Passive MMWave PBIED Detection Technology
8.3.5 Standoff “Illuminators of Opportunity” Passive MMWave Imaging
8.3.6 Mechanically Scanning Standoff MMWave PBIED, VBIED & IED Detection
8.4 Standoff MMWave PBIED Gait Characteristics Detection
8.4.1 Infra-red Standoff Detection Technologies
8.4.2 Toyota Standoff IR Detection System
8.5 Standoff Terahertz Explosives & Weapons Detection Technologies
8.5.1 Overview
8.5.2 Standoff Terahertz Contraband Detection Technology
8.5.3 Terahertz Detection Advantages over Other Technologies
8.5.4 Standoff Active Terahertz Heterodyne Concealed Explosives & Weapons Standoff Detection Imagers
8.5.5 Standoff Active Terahertz Absorption Spectroscopy Using Principal Component Analysis
8.5.5.1 Example: Active Terahertz Standoff Explosives Detection System of TeraView
8.5.6 Passive Terahertz Standoff Weapons & Explosives Detection
8.5.7 Passive Terahertz Detection System: ThruVision Systems
8.6 Laser-Based Standoff Explosives Detection
8.6.1 Introduction
8.6.2 Standoff Laser-induced Breakdown Spectroscopy (LIBS)
8.6.3 Next Generation Standoff LIBS Systems
8.6.4 Laser-Based Molecular Signatures Technologies
8.6.5 Laser-Based Stimulated Raman Adiabatic Passage (STIRAP) Technologies
8.6.6 External Cavity Quantum Cascade Lasers Standoff IED Detection
8.6.7 Standoff Laser Induced Fluorescence (PLP/LIF) Technology
8.6.7.1 PLP/LIF Standoff Explosives Detection: Principle of Technology
8.6.7.2 Next-Generation Standoff PLP/LIF Systems
8.7 Standoff Raman Spectroscopy
8.7.1 Introduction
8.7.2 Standoff Coherent Anti-Stokes Raman Spectroscopy
8.7.3 Standoff Resonant Raman Spectroscopy
8.7.4 Next-Generation Standoff CARS Systems
8.8 Standoff Non-linear Wave Mixing Detection Technology
8.8.1 Principle of Operation
8.8.2 Next-Generation Standoff Non-linear Wave Mixing PBIED, VBIED & IED Detection Technology
8.9 Standoff Light Detection and Ranging (LIDAR) Explosives Detection
8.9.1 Overview
8.9.2 Next-Generation LIDAR Systems
8.1 Triple Modality Standoff Detection Technology
8.11 Differential Phase-Contrast X-ray Imaging
8.12 The University of Puerto Rico Advanced Detection Techniques R&D
8.13 European Standoff Explosives & Weapon Detection Market – 2015-2022
8.13.1 Market Forecast
8.13.2 Market by Revenue Category
8.13.3 Market Breakdown
9 European Tomographic Explosive Detection Systems (EDS) & BHS Market – 2016-2022
9.1 Explosive Detection Systems: Technology Background
9.1.1 Explosive Detection Systems: Throughput
9.1.2 EDS Principle of Operation
9.1.3 Hybrid Tomographic EDS & 2D X-Ray Screening
9.1.4 EDS EU Standard-3 Certification
9.1.5 EDS Throughput vs. Price
9.1.6 Aviation Security: EDS Checked Luggage Screening
9.2 Security-related Airport Baggage Handling Systems (BHS)
9.3 EDS Market Background
9.4 European Tomographic Explosive Detection Systems & BHS Market – 2015-2022
9.4.1 Market Forecast
9.4.2 Market by Revenue Category
9.4.3 Market Breakdown
10 European Vehicle & Container Screening Systems Market – 2016-2022
10.1 Vehicle & Container Screening Portals Technologies
10.1.1 Comparison of Container-Vehicle Screening Technologies
10.1.2 X-Ray Container-Vehicle Screening Systems
10.1.3 Dual Energy X-Ray Container-Vehicle Screening
10.1.4 Dual-View X-Ray Container-Vehicle Screening
10.1.5 Backscatter X-Ray Container-Vehicle Screening
10.1.6 Gamma Ray Systems Container-Vehicle Screening
10.1.7 Linac Based X-Ray Container-Vehicle Screening systems
10.1.8 Neutron Activation Container-Vehicle Screening Systems
10.2 Vehicle & Container Screening Portals: Market Background
10.3 European Vehicle & Container Screening Systems Market – 2015-2022
10.3.1 Market Forecast
10.3.2 Market by Revenue Category
10.3.3 Market Breakdown
11 European Video Surveillance (w/o Video Analytics) Market – 2016-2022
11.1 European Video Surveillance Technologies & Market Background
11.1.1 European Video Surveillance: Crime Prevention
11.1.2 Video Surveillance Technologies
11.2 Video Surveillance Stakeholders
11.3 European Video Surveillance Standards
11.4 Video Surveillance Planning and Installation
11.4.1 Planning
11.4.2 Threat, Vulnerability, Risk Assessment
11.4.3 Target Capture and Image Detail
11.4.4 Video Surveillance Design
11.4.5 Equipment Selection
11.5 Video Surveillance: Applications
11.6 European Homeland Security & Public Safety Video Surveillance (w/o Analytics) Market – 2015-2022
11.6.1 Market Forecast
11.6.2 Market by Revenue Category
11.6.3 Market Breakdown
12 European (Security-related) Video Analytics Market – 2016-2022
12.1 Market Background
12.2 Video Analytics: Applications
12.3 Intelligent Video Surveillance: Tracking
12.3.1 Overview
12.3.2 IVS & VA based Behavioral Profiling
12.3.3 Tag and Track – IVS
12.3.4 Intelligent Video Surveillance: Behavior Profiling – Drivers
12.3.5 Intelligent Video Surveillance: Behavior Profiling – Inhibitors
12.4 Video Analytics-based Intelligent Transportation Systems
12.5 Tele-Retail, Amazon Fire Phone FireFly Video Analytics Firmware
12.6 Present and Pipeline Video Analytics (VA) & Video Content Analytics (VCA) Technologies
12.6.1 Video Analytics
12.6.1.1 Introduction
12.6.1.2 Wireless Video Analytics
12.6.1.3 Cloud-based Video Analytics
12.6.1.4 Cloud Platforms
12.6.1.5 Online Video Analytics
12.6.1.6 Behavioral Analysis
12.6.1.7 Video Analytic Applications
12.6.1.8 Video Analytics Architecture
12.6.2 Real Time Automatic Alerts Software
12.6.3 Image Segmentation Software
12.6.4 Item Tracking Intelligent CCTV Surveillance Software
12.6.5 Object Sorting and ID
12.6.6 Item Identification and Recognition
12.6.7 VA Based Face Recognition
12.6.8 License Plate Recognition (LPR)
12.6.9 Sorting Actions and Behaviors
12.6.10 Crowd Surveillance
12.6.11 Multi-Camera Intelligent CCTV Surveillance Systems
12.7 Video Content Analysis (VCA)
12.7.1 Introduction
12.7.2 VCA Systems
12.7.3 Pipeline VCA Research
12.7.4 Video Content Analysis Software
12.7.5 Present Limitations of Video Analytics Software
12.7.6 Automated Analysis of Video Surveillance Data
12.7.7 Item Detection
12.7.8 Background Subtraction: Gaussian Mixture Based Software
12.7.9 Background Subtraction
12.7.10 Item Detection Based on a Single-Image Algorithm
12.7.11 Item Tracking Software
12.7.12 Kalman Filtering Techniques, Region Segmentation
12.7.13 Kalman Filters Application To Track Moving Items
12.7.14 Partially Observable Markov Decision Process, IVS Systems
12.7.15 “Splitting” Items Algorithms
12.7.16 Dimension Based Items Classifiers
12.7.17 Shape Based Item Classifiers
12.7.18 Event Detection Methods
12.7.19 Vision-Based Human Action Recognition
12.7.20 3D Derived Egomotion
12.7.21 Path Reconstruction Software
12.7.22 Video Cameras Gap Mitigation Software
12.7.23 Networked Cameras Tag and Track Software
12.8 Visual Intelligence Technologies
12.8.1 The Visual Intelligence Process
12.8.2 Fusion Engine
12.8.3 Event Description
12.8.4 Reasoning
12.8.5 Reporting
12.9 Smart Cameras
12.1 Pulse Video Analytics
12.11 Underwater ISR
12.12 ROSS Covert Multi-modal Ground ISR System
12.13 Mini ISR Aerostats
12.14 Pirsiavash and Ramanan’s, Activity-Recognition IVS Algorithm
12.15 Camera & Video Analytics-based Advanced Driver Assistance Systems (ADAS) Technology and Market
12.15.1 Camera & VA-based Advanced Driver Assistance Systems Market
12.15.2 Camera & VA -based Advanced Driver Assistance Systems Technology
12.16 IVS Products and Services
12.16.1 Commercial Applications: Present and Pipeline Products
12.16.2 Pipeline Software And Hardware Under Development
12.17 IVS Based Intelligence, Surveillance and Reconnaissance (ISR) Systems
12.17.1 Overview
12.17.2 Portable ISR Video Surveillance Kits
12.18 Video Information Management (PSIM) Systems
12.19 Video Surveillance as a Service (VSaaS)
12.19.1 The VSaaS Technology
12.19.2 The VSaaS Market
12.2 European Homeland Security & Public Safety Video Analytics Market – 2015-2022
12.20.1 Market Forecast
12.20.2 Market by Revenue Category
12.20.3 Market Breakdown
13 European X-Ray Scanners Market – 2016-2022
13.1 X-Ray Screening Technology Background
13.1.1 2D X-Ray, EDS & ETD Explosives Detection Technologies – Pros & Cons
13.1.2 X-Ray Systems – Characteristics
13.2 X-Ray Screening Technologies
13.2.1 Luggage, Baggage & Other Items Screening Technologies
13.2.2 People Screening X-Ray Backscatter (AIT) Technology
13.2.3 Coherent Scatter 2D X-ray
13.2.4 Cast and Artificial Limbs X-ray Backscatter Screening Technologies
13.2.5 Transportable X-RAY Screening Checkpoints
13.2.6 X-ray Technologies: Performance Comparison
13.3 X-Ray Screening Market Background
13.3.1 Airports and Secured Facilities
13.3.2 Europe’s Rail Stations X-Ray Screening
13.3.3 The European Air Cargo Explosive Screening
13.3.3.1 ACES: The European Air Cargo Explosive Screening
13.3.3.2 The European RA3 and ACC3 Regulations
13.4 European X-Ray Scanners Market – 2015-2022
13.4.1 Market Forecast
13.4.2 Market by Revenue Category
13.4.3 Market Breakdown
14 European Automatic Border Control (ABC) Systems Market – 2016-2022
14.1 Automatic Border Control (ABC) Technologies and Market Background
14.1.1 The European Automatic Border Control Market Background
14.2 The European Automated Border Control: ABC4EU Project
14.2.1 ABC4EU Project: Scope
14.2.2 ABC4EU Project Test & Validation:
14.2.3 The ABC4EU Project Proposal
14.2.4 ABC4EU Project Activities
14.2.5 The 2015 European Project Status
14.2.6 The ABC4EU Project Impacts
14.2.7 Biometric Automatic Border Control (ABC) Advantages
14.3 Automated Border Control Technologies
14.3.1 Airport Automated Border Control Market Background
14.3.2 Function of Automated Border Control
14.4 European Automated Border Control Systems Standards
14.5 European Automated Border Control Legislation
14.6 European Automatic Border Control (ABC) Systems Market – 2015-2022
14.6.1 Market Forecast
14.6.2 Market by Revenue Category
14.6.3 Market Breakdown
15 European Border & Perimeter Barriers Market – 2016-2022
15.1 European Border & Perimeter Barriers Technology and Market Background
15.2 European Border Barriers
15.2.1 Hungarian Border Barrier
15.2.2 Greek Border Barrier
15.2.3 Austria Border Barrier
15.2.4 Bulgarian Border Barrier
15.2.5 Macedonian Border Barrier
15.2.6 Slovenian Border Barrier
15.2.7 Northern Ireland Border Barrier
15.2.8 Estonia Border Barrier
15.2.9 Spain Border Barriers
15.2.9.1 Ceuta Border Fence
15.2.9.2 Melilla Border Fence
15.2.10 Gibraltar Border Fence
15.2.11 Russia-Ukraine Barrier
15.3 European Border & Perimeter Barriers Market – 2015-2022
15.3.1 Market Forecast
15.3.2 Market by Revenue Category
15.3.3 Market Breakdown
16 European Counter Terror & Public Safety Related Information Technologies (w/o Cyber & Intelligence IT) Market – 2016-2022
16.1 Scope
16.2 Technology and Market Background
16.2.1 Effects of IT on HLS and Public Safety Agencies Performance
16.2.2 Counter Terror & Public Safety: Data Center Systems
16.2.2.1 Overview
16.2.2.2 Counter Terror and Public Safety: Data Center Services
16.2.2.3 Counter Terror and Public Safety: Support Services
16.2.2.4 Counter Terror and Public Safety: Technical Consulting Services
16.2.2.5 Outsourcing Services
16.2.2.6 Application Services
16.2.3 Counter Terror and Public Safety: Enterprise Software
16.2.4 Counter Terror and Public Safety: IT Services
16.2.5 Counter Terror and Public Safety Agencies: Cloud Storage & Computing
16.3 European Information Technologies (w/o Intel & Cyber) Market – 2015-2022
16.3.1 Market Forecast
16.3.2 Market by Revenue Category
16.3.3 Market Breakdown
17 European Visa Issuance IT Market – 2016-2022
17.1 Scope
17.2 European Visa Issuance IT Technology & Market Background
17.2.1 The 2015 Asylum Database
17.3 The European Visa Information (Technology) System (VIS)
17.4 The Schengen Area Visa
17.4.1 Schengen Area Visa States
17.4.2 On the Road to EU Membership/Candidate Countries
17.4.3 Potential candidates
17.4.4 Visa Exemptions
17.4.5 Who Needs a Schengen Visa?
17.4.6 Schengen Visa Types
17.4.6.1 Uniform Schengen Visas (USV)
17.4.6.2 Limited Territorial Validity Visas (LTV)
17.4.6.3 National Visas
17.4.7 Schengen Visa Fee
17.4.8 Schengen VISA Statistics 2014
17.5 Russian Federation Visa IT
17.6 European Visa Issuance IT Market – 2015-2022
17.6.1 Market Forecast
17.6.2 Market by Revenue Category
17.6.3 Market Breakdown
18 European Intelligence Services IT Market – 2016-2022
18.1 Scope
18.2 Intelligence Services Information Technologies & Market Background
18.2.1 The European Situation Centre
18.2.2 Geospatial Intelligence (GEOINT) Information Technology
18.2.3 Imagery intelligence (IMINT) Information Technology
18.2.4 Measurement and Signature Intelligence (MASINT) Information Technology
18.2.5 Open-source Intelligence (OSINT) Information Technology
18.2.6 Signals Intelligence (SIGINT) Information Technology
18.2.6.1 Communications Intelligence COMINT Information Technology
18.2.6.2 ELINT Electronic Intelligence Information Technology
18.2.7 Foreign Instrumentation Signals Intelligence (FISINT) Information Technology
18.2.8 Financial Intelligence (FININT) Information Technology
18.2.9 Cryptanalysis Information Technology
18.2.10 Traffic Analysis
18.3 European Counter-Terror & Counter-Crime Intelligence Services IT Market – 2015-2022
18.3.1 Market Forecast
18.3.2 Market by Revenue Category
18.3.3 Market Breakdown
19 Scope, Methodology & Disclaimer
19.1 Research Scope
19.2 Research Methodology
20 Disclaimer & Copyright

Tables

[Click here for Figures]

4 Volumes:

European Homeland Security & Public Safety Technologies & Markets – 2016-2022 – Volume 1

European Homeland Security & Public Safety Technologies & Markets – 2016-2022 – Volume 2

European Homeland Security & Public Safety Technologies & Markets – 2016-2022 – Volume 3

European Homeland Security & Public Safety Technologies & Markets – 2016-2022 – Volume 4


European Homeland Security & Public Safety Technologies & Markets – 2016-2022 – Volume 1

Table 1 European Homeland Security & Public Safety Market [$M] by Revenue Source (Sales, Aftersale and Other Revenues) – 2015-2022
Table 2 European Population, Muslim-Population, GDP, GDP/Capita and Defense-Budget 2014 Data by 17 Countries
Table 3 European Police Forces, 1st Responders, Airports & Air-Passengers Statistics by Country
Table 4 European Homeland Security & Public Safety Market [$M] by Major Vertical Markets – 2015-2022
Table 5 European Homeland Security & Public Safety Major Technology Markets [$M] – 2015-2022
Table 6 European Homeland Security & Public Safety Market [$M] by Country – 2015-2022
Table 7 European Homeland Security & Public Safety Market [$M] by Revenue Source (Sales, Aftersale and Other Revenues) – 2015-2022
Table 8 The External Land Borders of the EU
Table 9 The EU Southern Maritime Border
Table 10 Counter Terror & Public Security Market – Competitive Analysis
Table 11 European Homeland Security & Public Safety Market [$M] by Major Vertical Markets – 2015-2022
Table 12 European Homeland Security & Public Safety Market AGR [%] by Major Vertical Markets – 2015-2022
Table 13 European Homeland Security & Public Safety by Major Technology Markets [$M] – 2015-2022
Table 14 European Homeland Security & Public Safety by Major Technology Markets AGR [%] – 2015-2022
Table 15 European Homeland Security & Public Safety Market [$M] by Country – 2015-2022
Table 16 European Homeland Security & Public Safety Market AGR [%] by Country – 2015-2022
Table 17 European Homeland Security & Public Safety Market [$M] by Revenue Source (Sales, Aftersale and Other Revenues) – 2015-2022
Table 18 European Homeland Security & Public Safety Market AGR [%] by Revenue Source – 2015-2022
Table 19 European Homeland Security & Public Safety Market [$M] by Major Vertical Markets – 2015-2022
Table 20 European Homeland Security & Public Safety Market AGR [%] by Major Vertical Markets – 2015-2022
Table 21 European Homeland Security & Public Safety by Major Technology Markets [$M] – 2015-2022
Table 22 European Homeland Security & Public Safety by Major Technology Markets AGR [%] – 2015-2022
Table 23 UK Homeland Security & Public Safety Market [$M] by Revenue Category – 2015-2022
Table 24 UK Homeland Security & Public Safety Market AGR [%] by Revenue Category – 2015-2022
Table 25 France Homeland Security & Public Safety Market [$M] by Revenue Category – 2015-2022
Table 26 France Homeland Security & Public Safety Market AGR [%] by Revenue Category – 2015-2022
Table 27 Belgium Homeland Security & Public Safety Market [$M] by Revenue Category – 2015-2022
Table 28 Belgium Homeland Security & Public Safety Market AGR [%] by Revenue Category – 2015-2022
Table 29 Germany Homeland Security & Public Safety Market [$M] by Revenue Category – 2015-2022
Table 30 Germany Homeland Security & Public Safety Market AGR [%] by Revenue Category – 2015-2022
Table 31 Austria Homeland Security & Public Safety Market [$M] by Revenue Category – 2015-2022
Table 32 Austria Homeland Security & Public Safety Market AGR [%] by Revenue Category – 2015-2022
Table 33 Switzerland Homeland Security & Public Safety Market [$M] by Revenue Category – 2015-2022
Table 34 Switzerland Homeland Security & Public Safety Market AGR [%] by Revenue Category – 2015-2022
Table 35 Italy Homeland Security & Public Safety Market [$M] by Revenue Category – 2015-2022
Table 36 Italy Homeland Security & Public Safety Market AGR [%] by Revenue Category – 2015-2022
Table 37 Spain Homeland Security & Public Safety Market [$M] by Revenue Category – 2015-2022
Table 38 Spain Homeland Security & Public Safety Market AGR [%] by Revenue Category – 2015-2022
Table 39 Poland Homeland Security & Public Safety Market [$M] by Revenue Category – 2015-2022
Table 40 Poland Homeland Security & Public Safety Market AGR [%] by Revenue Category – 2015-2022
Table 41 Hungary Homeland Security & Public Safety Market [$M] by Revenue Category – 2015-2022
Table 42 Hungary Homeland Security & Public Safety Market AGR [%] by Revenue Category – 2015-2022
Table 43 Czech Republic Homeland Security & Public Safety Market [$M] by Revenue Category – 2015-2022
Table 44 Czech Republic Homeland Security & Public Safety Market AGR [%] by Revenue Category – 2015-2022
Table 45 Russia Homeland Security & Public Safety Market [$M] by Revenue Category – 2015-2022
Table 46 Russia Homeland Security & Public Safety Market AGR [%] by Revenue Category – 2015-2022
Table 47 Sweden Homeland Security & Public Safety Market [$M] by Revenue Category – 2015-2022
Table 48 Sweden Homeland Security & Public Safety Market AGR [%] by Revenue Category – 2015-2022
Table 49 Norway Homeland Security & Public Safety Market [$M] by Revenue Category – 2015-2022
Table 50 Norway Homeland Security & Public Safety Market AGR [%] by Revenue Category – 2015-2022
Table 51 Finland Homeland Security & Public Safety Market [$M] by Revenue Category – 2015-2022
Table 52 Finland Homeland Security & Public Safety Market AGR [%] by Revenue Category – 2015-2022
Table 53 Denmark Homeland Security & Public Safety Market [$M] by Revenue Category – 2015-2022
Table 54 Denmark Homeland Security & Public Safety Market AGR [%] by Revenue Category – 2015-2022
Table 55 Rest of Europe Homeland Security & Public Safety Market [$M] by Revenue Category – 2015-2022
Table 56 Rest of Europe Homeland Security & Public Safety Market AGR [%] by Revenue Category – 2015-2022
Table 57 European Homeland Security and Public Safety Standards
Table 58  Membership in the EU, Eurozone, and Schengen Area


[Back to top]

European Homeland Security & Public Safety Technologies & Markets – 2016-2022 – Volume 2

Table 1 Aviation Security Market – Competitive Analysis
Table 2 Aviation Security Vendors and Product Lines
Table 3 European Airport Security Market [$M] by Revenue Source (Sales, Aftersale and Other Revenues) – 2015-2022
Table 4 European CBRN Security & Safety Market [$M] by Revenue Source (Sales, Aftersale and Other Revenues) – 2015-2022
Table 5 Notifications of the Temporary Reintroduction of Border Control at Internal Borders by Country
Table 6 Border Security Market – Competitive Analysis
Table 7 European Border Security & Immigration Enforcement Security Market [$M] by Revenue Category (Sales, Aftersale and Other Revenues) – 2015-2022
Table 8 Counter Terror & Crime Intelligence Market – Competitive Analysis
Table 9 European Intelligence Agencies Security Market [$M] by Revenue Category (Sales, Aftersale and Other Revenues) – 2015-2022
Table 10 Nuclear Power Plants by Country by # of Reactors & % of Power Generation By Country
Table 11 Critical Infrastructure Protection (CIP) Sub-Market Growth Sectors
Table 12 European Critical Infrastructure Protection Security Market [$M] by Revenue Source (Sales, Aftersale and Other Revenues) – 2015-2022
Table 13 Ranking of Manmade & Natural Disasters, Crime and Terror Threats as a Market Driver
Table 14 Law Enforcement & 1st Responder Market – Competitive Analysis
Table 15 European Police & Other 1st Responders Security Market [$M] by Revenue Source (Sales, Aftersale and Other Revenues) – 2015-2022
Table 16 European Maritime Security Market [$M] and AGR [%] – 2015-2022
Table 17 European Mass Transportation Security Market [$M] and AGR [%] – 2015-2022
Table 18  European Public Events Security Market [$M] and AGR [%] – 2015-2022


[Back to top]

European Homeland Security & Public Safety Technologies & Markets – 2016-2022 – Volume 3

Table 1 Oil-Gas Industry Security Market – Competitive Analysis
Table 2 European Oil-Gas Industry Security Market [$M] by Revenue Category (Sales, Aftersale and Other Revenues) – 2015-2022
Table 3 Crime Statistics for Germany – 2011-2012
Table 4 Crime Statistics in Spain – Jan-Sept 2013
Table 5 European Safe Cities Market: Competitive Analysis
Table 6 European Safe City Market [$M] by Revenue Category (Sales, Aftersale and Other Revenues) – 2015-2022
Table 7 European Buildings Security Market [$M] by Revenue Category (Sales, Aftersale and Other Revenues) – 2015-2022
Table 8 Perimeter Security Technologies Performance, Device Cost, Installation & Aftersales Costs Comparison
Table 9 Comparison of Perimeter Security Standoff Threat Detection Technologies
Table 10 European Perimeter Security (w/o CIP) Market [$M] by Revenue Category (Sales, Aftersale and Other Revenues) – 2015-2022
Table 11 2015 Mediterranean Sea Arrivals by Country
Table 12 European Immigration Enforcement Market [$M] by Revenue Category (Sales, Aftersale and Other Revenues) – 2015-2022
Table 13 European Other Homeland Security & Public Safety Vertical Markets [$M] by Revenue Category (Sales, Aftersale and Other Revenues) – 2015-2022
Table 14 European Bio-Agents & Infectious Disease Mitigation Market [$M] by Revenue Category (Sales, Aftersale and Other Revenues) – 2015-2022
Table 15 Biometric Modalities: Pros & Cons
Table 16 Comparison of the Biometric Modalities
Table 17 Retica Remote Biometric System Performance
Table 18 Data Types and Associated Biometric Technologies
Table 19 Biometrics Market: Business Opportunities
Table 20 European Counter Terror, Counter Crime & Immigration Enforcement Biometrics Security Market [$M] by Country – 2015-2022
Table 21 European Counter Terror, Counter Crime & Immigration Enforcement: Biometrics Security Market [$M] by Revenue Source (Sales, Aftersale and Other Revenues) – 2015-2022
Table 22 European C2-C4ISR Systems Market [$M] by Revenue Category (Sales, Aftersale and Other Revenues) – 2015-2022
Table 23 Nuclear Terror Detection Roadmap
Table 24 European Chemical, Hazmat & Nuclear Detection Market [$M] by Revenue Category (Sales, Aftersale and Other Revenues) – 2015-2022
Table 25 Interoperability Levels, Level 1 – Swap Radios. Advantages & Disadvantages
Table 26 Interoperability Levels, Level 2 – Talkaround or “Directed Net”. Advantages & Disadvantages
Table 27 Interoperability Levels, Level 3 – Mutual Aid. Advantages & Disadvantages
Table 28 Interoperability Levels Advantages & Disadvantages
Table 29 Interoperability Levels, Level 5 – System-Specific-Roaming (Trunked & Conventional). Advantages & Disadvantages
Table 30 Interoperability Levels, Level 6 – Standards Based Shared Systems (Trunked & Conventional). Advantages & Disadvantages
Table 31 Europe – Interoperability Communications – Bandwidths, Spectrums and Technologies
Table 32 European Homeland Security & Public Safety Communication Systems & Devices Security Market [$M] by Country – 2015-2022
Table 33 European Homeland Security & Public Safety Communication Systems & Devices Market AGRs [%] by Country – 2016-2022
Table 34 European Homeland Security & Public Safety Communication Systems & Devices Market Shares [%] by Country – 2015-2022
Table 35 European Homeland Security & Public Safety Communication Systems & Devices Security Market [$M] by Revenue Source (Sales, Aftersale and Other Revenues) – 2015-2022
Table 36 European Counter-IED Technologies Market [$M] by Revenue Category (Sales, Aftersale and Other Revenues) – 2015-2022
Table 37 Control Objectives vs. PCI DSS Requirements
Table 38 ISO 27001 – 27006 Standards
Table 39 ISO/IEC Standards
Table 40 Cybersecurity Market: Counter-Terror & Crime Business Opportunities
Table 41 European Cybersecurity Security Market [$M] by Revenue Source (Sales, Aftersale and Other Revenues) – 2015-2022
Table 42 European Decontamination of CBRN & Hazmat Incidents Market [$M] by Revenue Category (Sales, Aftersale and Other Revenues) – 2015-2022
Table 43 Electronic Fencing Market: Business Opportunities
Table 44  European Electronic Fencing Market [$M] by Revenue Category (Sales, Aftersale and Other Revenues) – 2015-2022


[Back to top]

European Homeland Security & Public Safety Technologies & Markets – 2016-2022 – Volume 4

Table 1 ETD vs. Bulk Explosives and Narcotics Detection Technologies
Table 2 Quantum Sniffer: Features & Benefits
Table 3 European Explosives Trace Detection (ETD) Market [$M] by Revenue Category (Sales, Aftersale and Other Revenues) – 2015-2022
Table 4 European Intrusion Detection Systems Security Market [$M] by Revenue Source (Sales, Aftersale and Other Revenues) – 2015-2022
Table 5 Enhanced (Matrix) Metal Detection Portal
Table 6 European Metal Detectors Market [$M] by Revenue Category (Sales, Aftersale and Other Revenues) – 2015-2022
Table 7 Natural Disaster Vulnerability Analysis Example
Table 8 Typical Goals of an EMS System: Daily vs. Disaster
Table 9 Notification Systems Technologies Characteristics
Table 10 European Natural & Manmade Disaster Mitigation Market [$M] by Revenue Category (Sales, Aftersale and Other Revenues) – 2015-2022
Table 11 NLW Technologies
Table 12 Non-Lethal Weapons Counter-Personnel Means
Table 13 Electromagnetic NLW Technologies
Table 14 Mechanical & Kinetic, Acoustic, Ancillary and Chemical NLW Technologies
Table 15 NLW Counter-Personnel Means
Table 16 NLW Counter-Material Technologies
Table 17 European Non-Lethal Weapons Market [$M] by Revenue Category (Sales, Aftersale and Other Revenues) – 2015-2022
Table 18 European Personal (Ballistic & CBRNE) Protective Gear Market [$M] by Revenue Category (Sales, Aftersale and Other Revenues) – 2015-2022
Table 19 Comparison of Standoff IED, PBIED & VBIED Detection Technologies
Table 20 Retica Standoff Biometric System Performance
Table 21 Standoff IED, PVIED & VBIED UGV Detection Technology: Features & Benefits
Table 22 Mechanically Scanning MMWave Camera Performance
Table 23 Comparison of Laser Based Standoff Explosives Detection Technologies
Table 24 European Standoff Explosives & Weapon Detection Market [$M] by Revenue Category (Sales, Aftersale and Other Revenues) – 2015-2022
Table 25 Explosive Detection Systems vs. Other Luggage Screening Technologies
Table 26 European Tomographic Explosive Detection Systems & BHS Market [$M] by Revenue Category (Sales, Aftersale and Other Revenues) – 2015-2022
Table 27 Container-Vehicle Screening – Technologies Comparison
Table 28 European Vehicle & Container Screening Systems Market [$M] by Revenue Category (Sales, Aftersale and Other Revenues) – 2015-2022
Table 29 Levels of Video Surveillance Image Detail
Table 30 European Video Surveillance (w/o Analytics) Market [$M] by Revenue Category (Sales, Aftersale and Other Revenues) – 2015-2022
Table 31 Video Content Analysis Functions and Description
Table 32 Pipeline VCA: Sub-Systems, Technology, Technology Challenges & Target Performance
Table 33 European Video Analytics Market [$M] by Revenue Category (Sales, Aftersale and Other Revenues) – 2015-2022
Table 34 EDS, ETD and 2D X-Ray Technologies – Pros and Cons
Table 35 Comparison of X-ray Detection Technologies
Table 36 European X-Ray Scanners Market [$M] by Revenue Category (Sales, Aftersale and Other Revenues) – 2015-2022
Table 37 European Automatic Border Control (ABC) Systems Market [$M] by Revenue Category (Sales, Aftersale and Other Revenues) – 2015-2022
Table 38 European Border & Perimeter Barriers Market [$M] by Revenue Category (Sales, Aftersale and Other Revenues) – 2015-2022
Table 39 European Information Technologies (w/o Intel & Cyber) Market [$M] by Revenue Category (Sales, Aftersale and Other Revenues) – 2015-2022
Table 40 Countries Nationals Who Need a Schengen Visa
Table 41 Uniform Schengen Visa (including MEV) Statistics 2014
Table 42 Visa Application by Third Country – 2014
Table 43 European Visa Issuance IT Market [$M] by Revenue Category (Sales, Aftersale and Other Revenues) – 2015-2022
Table 44  European Intelligence Services IT Market [$M] by Revenue Category (Sales, Aftersale and Other Revenues) – 2015-2022

Figures

4 Volumes:

European Homeland Security & Public Safety Technologies & Markets – 2016-2022 – Volume 1

European Homeland Security & Public Safety Technologies & Markets – 2016-2022 – Volume 2

European Homeland Security & Public Safety Technologies & Markets – 2016-2022 – Volume 3

European Homeland Security & Public Safety Technologies & Markets – 2016-2022 – Volume 4


[Back to top]

European Homeland Security & Public Safety Technologies & Markets – 2016-2022 – Volume 1

Figure 1 Europe Homeland Security & Public Safety Market 2010-2020
Figure 2 European Homeland Security & Public Safety Market [$M] by Revenue Source (Sales, Aftersale and Other Revenues) – 2015-2022
Figure 3 The Report Structure
Figure 4 Europe Three-Key Challenges
Figure 5 Number of European ISIS-Da’esh Fighters by Country
Figure 6 2014-2015 Refugee Applications to Europe by Month
Figure 7 2015 Migrant Applications to Europe by Country of Origin
Figure 8 Main Routes of Migration to Europe
Figure 9 European Asylum-Seeker Decisions by Country
Figure 10 Refugee Acceptance by Country 2015
Figure 11 Asylum Claims per 100.000 Local Populations 2015
Figure 12 EU Defense Expenditure [%] Drop- 2007-2014 [Constant 2005 Euros]
Figure 13 European Homeland Security & Public Safety Market [$M] by Major Vertical Markets – 2015-2022
Figure 14 European Homeland Security & Public Safety Market [$M] by Country – 2015-2022
Figure 15 Europe Major Terror Attacks-2001 to March 2016
Figure 16 Percentage of Europe Muslim Population: By Country
Figure 17 Fragility and Instability in Europe Neighborhood MEA Countries
Figure 18 Europe Inflows of Threats
Figure 19 Asylum Claims in Europe 2015
Figure 20 Asylum Claims per 100.000 Local Populations 2015
Figure 21 Top 10 Origins of Asylum Seeking Migrants Jan-Oct. 2015
Figure 22 Numbers of Refugees EU Member States are Requested to Take
Figure 23 Asylum Applications Granted By European Countries 2014
Figure 24 The Mediterranean- European Refugee Routes 2014 & 2015
Figure 25 Mediterranean Refugees Deaths by Route 2014 & 2015
Figure 26 Syrian Refugees in the Middle East and Europe (November 2015)
Figure 27 The Frontex Organization
Figure 28 The Frontex Border Map
Figure 29 Details of a Passport Stamp Confirming Border Crossing
Figure 30 European Homeland Security & Public Safety Market [$M] by Major Vertical Markets – 2015-2022
Figure 31 European Homeland Security & Public Safety Major Vertical Market Shares [%] – 2015-2022
Figure 32 European Homeland Security & Public Safety Market [$M] by Country – 2015-2022
Figure 33 European Homeland Security & Public Safety Market Shares [%] by Country – 2015-2022
Figure 34 European Homeland Security & Public Safety Market [$M] by Revenue Source (Sales, Aftersale and Other Revenues) – 2015-2022
Figure 35 European Homeland Security & Public Safety Market Share [%] by Revenue Category – 2015-2022
Figure 36 European Homeland Security & Public Safety Market [$M] by Major Vertical Markets – 2015-2022
Figure 37 European Homeland Security & Public Safety Major Vertical Market Shares [%] – 2015-2022
Figure 38 UK Homeland Security & Public Safety Market [$M] by Revenue Category – 2015-2022
Figure 39 UK Homeland Security & Public Safety Market Shares [%] by Revenue Category – 2015-2022
Figure 40 France Homeland Security & Public Safety Market [$M] by Revenue Category – 2015-2022
Figure 41 France Homeland Security & Public Safety Market Shares [%] by Revenue Category – 2015-2022
Figure 42 Belgium Homeland Security & Public Safety Market [$M] by Revenue Category – 2015-2022
Figure 43 Belgium Homeland Security & Public Safety Market Shares [%] by Revenue Category – 2015-2022
Figure 44 Germany Homeland Security & Public Safety Market [$M] by Revenue Category – 2015-2022
Figure 45 Germany Homeland Security & Public Safety Market Shares [%] by Revenue Category – 2015-2022
Figure 46 Austria Homeland Security & Public Safety Market [$M] by Revenue Category – 2015-2022
Figure 47 Austria Homeland Security & Public Safety Market Shares [%] by Revenue Category – 2015-2022
Figure 48 Switzerland Homeland Security & Public Safety Market [$M] by Revenue Category – 2015-2022
Figure 49 Switzerland Homeland Security & Public Safety Market Shares [%] by Revenue Category – 2015-2022
Figure 50 Italy Homeland Security & Public Safety Market [$M] by Revenue Category – 2015-2022
Figure 51 Italy Homeland Security & Public Safety Market Shares [%] by Revenue Category – 2015-2022
Figure 52 Spain Homeland Security & Public Safety Market [$M] by Revenue Category – 2015-2022
Figure 53 Spain Homeland Security & Public Safety Market Shares [%] by Revenue Category – 2015-2022
Figure 54 Poland Homeland Security & Public Safety Market [$M] by Revenue Category – 2015-2022
Figure 55 Poland Homeland Security & Public Safety Market Shares [%] by Revenue Category – 2015-2022
Figure 56 Hungary Homeland Security & Public Safety Market [$M] by Revenue Category – 2015-2022
Figure 57 Hungary Homeland Security & Public Safety Market Shares [%] by Revenue Category – 2015-2022
Figure 58 Czech Republic Homeland Security & Public Safety Market [$M] by Revenue Category – 2015-2022
Figure 59 Czech Republic Homeland Security & Public Safety Market Shares [%] by Revenue Category – 2015-2022
Figure 60 Russia Homeland Security & Public Safety Market [$M] by Revenue Category – 2015-2022
Figure 61 Russia Homeland Security & Public Safety Market Shares [%] by Revenue Category – 2015-2022
Figure 62 Sweden Homeland Security & Public Safety Market [$M] by Revenue Category – 2015-2022
Figure 63 Sweden Homeland Security & Public Safety Market Shares [%] by Revenue Category – 2015-2022
Figure 64 Norway Homeland Security & Public Safety Market [$M] by Revenue Category – 2015-2022
Figure 65 Norway Homeland Security & Public Safety Market Shares [%] by Revenue Category – 2015-2022
Figure 66 Finland Homeland Security & Public Safety Market [$M] by Revenue Category – 2015-2022
Figure 67 Finland Homeland Security & Public Safety Market Shares [%] by Revenue Category – 2015-2022
Figure 68 Denmark Homeland Security & Public Safety Market [$M] by Revenue Category – 2015-2022
Figure 69 Denmark Homeland Security & Public Safety Market Shares [%] by Revenue Category – 2015-2022
Figure 70 Rest of Europe Homeland Security & Public Safety Market [$M] by Revenue Category – 2015-2022
Figure 71 Rest of Europe Homeland Security & Public Safety Market Shares [%] by Revenue Category – 2015-2022
Figure 72 Size & Percentage of Muslim Population in 21 European Countries
Figure 73 EU 10 Largest Muslim Populations
Figure 74 The European Union: Member States and Candidate Countries
Figure 75 EU Countries Currency Status – 2016
Figure 76 European 2015-2016 GDP Growth Forecast [%] By Country
Figure 77 Europe GDP per Capita By Country
Figure 78 2015 Refugee Applications to Europe by Month
Figure 79 2015 Migrant Applications to Europe by Country of Origin
Figure 80 Main Routes of Migration
Figure 81 European Asylum-Seeker Decisions by Country
Figure 82 Refugee Acceptance by Country 2015
Figure 83 Asylum Claims per 100.000 Local Populations 2015
Figure 84 Fragility and Instability in Europe Neighborhood MEA Countries
Figure 85 Europe Inflows of Threats
Figure 86 European Borders
Figure 87 The 2016 Schengen Border Map
Figure 88 The Advanced Passenger Analysis (APA) System
Figure 89  Migrant Arrivals by Sea and Land Borders in 2015


[Back to top]

European Homeland Security & Public Safety Technologies & Markets – 2016-2022 – Volume 2

Figure 1 Aviation Passenger Traffic Correlation with GDP Change
Figure 2 Global Air Travel Growth
Figure 3 Boeing Global Air Traffic Forecast – 1991-2031
Figure 4 European Air Travel Growth Forecast to 2020
Figure 5 Airport Security Roadmap
Figure 6 Checked Luggage in-Line Screening Configuration
Figure 7 European Airport Security, 8 Layers of Security
Figure 8 Aircraft Security – Points of Potential Vulnerability
Figure 9 The EU Airport Automated Border Control Concept
Figure 10 Automated Border Control Process
Figure 11 Face Recognition Based Automated Border Control
Figure 12 Airport Surface Movement Radar
Figure 13 Airport Surface Movement Radar Imaging Field
Figure 14 An Airport Security Command, Control & Communication Meta-System
Figure 15 Airport Perimeter
Figure 16 Airport Perimeter Security Infrastructure
Figure 17 Qylatron Multi-Modal Multi Threat Passenger Screening Portal
Figure 18 Fused Technologies – Concealed Weapons Detection
Figure 19 Map of MANPADS Attacks on Civil Aircraft – 1975-2012
Figure 20 An IR MANPAD View of a Civilian Aircraft
Figure 21 Overview of MANPADS
Figure 22 Flare-based MANPAD Countermeasures
Figure 23 DIRCAM CONOPS
Figure 24 The “Skyshield” Counter MANPADS
Figure 25 BAE Systems and Northrop Grumman Counter MANPAD Systems
Figure 26 Average X-ray Screening Rate [Passengers per Hour] by Region.
Figure 27 The IATA “Checkpoint of the Future” Lanes
Figure 28 IATA “Checkpoint of the Future” Concept
Figure 29 Global Average Air Cargo Growth [Million Tons]: 2001-2020
Figure 30 Air Cargo Supply Chain
Figure 31 Airport Perimeter Security Systems
Figure 32 Multi-Level Airport Security
Figure 33 European Airport Security Market [$M] by Revenue Source (Sales, Aftersale and Other Revenues) – 2015-2022
Figure 34 European Airport Security Market Share [%] by Revenue Source – 2015-2022
Figure 35 CBRN Incident Delimitation of the Functional Sectors
Figure 36 CBRN Attack, Risk Assessment Process
Figure 37 Characteristics of NATO CBRN Security Concept
Figure 38 European CBRN Security & Safety Market [$M] by Revenue Source (Sales, Aftersale and Other Revenues) – 2015-2022
Figure 39 European CBRN Security & Safety Market Share [%] by Revenue Source – 2015-2022
Figure 40 European Borders
Figure 41 The 2015 Schengen Map
Figure 42 2015 Refugee Applications to Europe by Month
Figure 43 2015 Migrant Applications to Europe by Country of Origin
Figure 44 Main Routes of Migration
Figure 45 European Asylum-Seeker Decisions by Country
Figure 46 Refugee Acceptance by Country 2015
Figure 47 Asylum Claims per 100.000 Local Populations 2015
Figure 48 Fragility and Instability in Europe Neighborhood MEA Countries
Figure 49 Europe Inflows of Threats
Figure 50 European Borders
Figure 51 The 2016 Schengen Border Map
Figure 52 The Advanced Passenger Analysis (APA) System
Figure 53 Migrant Arrivals by Sea and Land Borders in 2015
Figure 54 Automatic Border Control (ABC) Airport Facility
Figure 55 An Automatic Border Control (ABC) Kiosk
Figure 56 FRONTEX Procurement Categories by Market Share [%]
Figure 57 Border Security, Layers of Security
Figure 58 Border Security Threat Detection Scheme
Figure 59 European Border Security & Immigration Enforcement Security Market [$M] by Revenue Category (Sales, Aftersale and Other Revenues) – 2015-2022
Figure 60 European Smart Borders, Immigration Enforcement & Border Security Market Share [%] by Revenue Category – 2015-2022
Figure 61 The Intelligence Cycle
Figure 62 European Intelligence Agencies Security Market [$M] by Revenue Category (Sales, Aftersale and Other Revenues) – 2015-2022
Figure 63 European Intelligence Agencies Homeland Security & Public Safety Market Share [%] by Revenue Category – 2015-2022
Figure 64 Hierarchy of Critical Infrastructures
Figure 65 Critical Infrastructure Security Investment Priorities Scheme
Figure 66 A National Critical Infrastructure Protection Infrastructure: Example the U.S.A. CIP
Figure 67 Critical Infrastructure Protection, Layers of Security
Figure 68 Three Classes of the Private Sector Critical Infrastructure Risk Assessments
Figure 69 Overview of the Electric Power System and Control Communications
Figure 70 Energy Related Interdependencies across the Economy
Figure 71 Nuclear Power Plants in Europe
Figure 72 Chemical Industry Dependencies and Interdependencies
Figure 73 Chemical Industry by Segment
Figure 74 European Critical Infrastructure Protection Security Market [$M] by Revenue Source (Sales, Aftersale and Other Revenues) – 2015-2022
Figure 75 European Critical Infrastructure Protection Market Share [%] by Revenue Source – 2015-2022
Figure 76 Future 1st Responders Communications Services
Figure 77 First Responders’ Mobile Devices Network
Figure 78 European Police & Other 1st Responders Security Market [$M] by Revenue Source (Sales, Aftersale and Other Revenues) – 2015-2022
Figure 79 European Police Modernization & Other 1st Responders Market Share [%] by Revenue Source – 2015-2022
Figure 80 Europe’s Sea Lines of Communication
Figure 81 Maritime Security – Mixed Mode Approach
Figure 82 Maritime Supply Chain vs. Security Legislation
Figure 83 Maritime Security Infrastructure
Figure 84 Map and List of 154 Countries Committed to Implement the WCO Customs Security Practices
Figure 85 Partners Involved in Port Operations
Figure 86 European Maritime Security Market [$M] – 2015-2022
Figure 87 Mass Transportation Systems Sector Risk Management Framework
Figure 88 The Mass Transportation Industry Security Capability Gap Process
Figure 89 The SaferCash Operation
Figure 90 European Mass Transportation Security Market [$M] – 2015-2022
Figure 91  European Public Events Security Market [$M] – 2015-2022


[Back to top]

European Homeland Security & Public Safety Technologies & Markets – 2016-2022 – Volume 3

Figure 1 Oil-Gas Industry Terror Targets
Figure 2 Oil-Gas Industry Security Systems, Layers of Security
Figure 3 European Oil-Gas Industry Security Market [$M] by Revenue Category (Sales, Aftersale and Other Revenues) – 2015-2022
Figure 4 European Oil-Gas Industry Security Market Share [%] by Revenue Category – 2015-2022
Figure 5 Safe City Emergency Information Warning System
Figure 6 Stuttgart Safe City Steering Committee
Figure 7 Madrid PoC
Figure 8 Madrid PoC Architecture
Figure 9 A Typical Process for Collecting, Disseminating, and Utilizing Suspicious Activity Reports
Figure 10 Safe City Cloud Computing Architecture
Figure 11 European Safe City Market [$M] by Revenue Category (Sales, Aftersale and Other Revenues) – 2015-2022
Figure 12 European Safe City Market Share [%] by Revenue Category – 2015-2022
Figure 13 Electronic Building Security System
Figure 14 A Secured Building Architecture
Figure 15 European Buildings Security Market [$M] by Revenue Category (Sales, Aftersale and Other Revenues) – 2015-2022
Figure 16 European Buildings Security Market Share [%] by Revenue Category – 2015-2022
Figure 17 Integrated Perimeter Security System
Figure 18 Perimeter Security by Sector
Figure 19 Eurotunnel Perimeter Security
Figure 20 Perimeter Security Infrastructure
Figure 21 Intersection of Risk Assessment
Figure 22 Perimeter Multi-Layer Security
Figure 23 Perimeter Fence Sensors
Figure 24 European Perimeter Security (w/o CIP) Market [$M] by Revenue Category (Sales, Aftersale and Other Revenues) – 2015-2022
Figure 25 European Perimeter Security (w/o CIP) Market Share [%] by Revenue Category – 2015-2022
Figure 26 Number of European ISIS Fighters by Country
Figure 27 European Illegal Border-Crossers 2015 by Main Nationalities
Figure 28 Video Analytics Modes Used For Border Crossing Surveillance
Figure 29 Border Fence
Figure 30 Land Border Migration
Figure 31 Future Asylum Seekers European Border Control System Architecture
Figure 32 The Frontex Organization
Figure 33 The Frontex Border Map
Figure 34 Details of a Passport Stamp Confirming Border Crossing
Figure 35 European Immigration Enforcement Market [$M] by Revenue Category (Sales, Aftersale and Other Revenues) – 2015-2022
Figure 36 European Immigration Enforcement Market Share [%] by Revenue Category – 2015-2022
Figure 37 European Other Homeland Security & Public Safety Vertical Markets Market [$M] by Revenue Category (Sales, Aftersale and Other Revenues) – 2015-2022
Figure 38 European Other Homeland Security & Public Safety Vertical Markets Share [%] by Revenue Category – 2015-2022
Figure 39 Biosecurity and Safety Agencies & Processes Roadmap
Figure 40 Airborne Bacterial Concentration Fluctuation in a Single Day
Figure 41 Cross-section of Cascade Impactor: PIXE International Corporation
Figure 42 TSI’s Model 3317 System with Concentrator, GPS Receiver & Wireless Data Radio
Figure 43 Bio-Detection Generic Architecture
Figure 44 National Biosurveillance Components
Figure 45 Bio-Detection Strategy
Figure 46 Bio-Detection Modalities
Figure 47 The European Bio-Detection Surveillance and Situational Awareness: Areas of Responsibility
Figure 48 European Bio-Agents & Infectious Disease Mitigation Market [$M] by Revenue Category (Sales, Aftersale and Other Revenues) – 2015-2022
Figure 49 European Bio-Agents & Infectious Disease Mitigation Market Share [%] by Revenue Category – 2015-2022
Figure 50 Performance of Four Biometric Security Systems
Figure 51 Operation of a Generic Biometric System
Figure 52 Performance Criteria for Biometrics Security Technologies
Figure 53 Types of Fingerprints
Figure 54 Eigen Faces Process
Figure 55 The Iris Anatomy
Figure 56 Iris Recognition Based Automatic Border Control (ABC) System
Figure 57 Hand Geometry Recognition System
Figure 58 Several Measurements for Signature Comparison
Figure 59 A Pictorial Representation of the Regions of the Palm.
Figure 60 Transmission Imaging of a Hand
Figure 61 Multimodal Biometrics
Figure 62 Multimodal Biometrics Fusion (a): Decision-level Fusion, (b): Score-level Fusion, (c): Feature-level Fusion and (d): Sample-level Fusion
Figure 63 Field of View of a Fused Video Surveillance and Biometrics
Figure 64 A Corridor CCTV Based Biometric Portal Layout
Figure 65 People Screening Biometric Checkpoints
Figure 66 Components of a Common Biometric System
Figure 67 People Screening in an Open Space Environment
Figure 68 European Counter Terror, Counter Crime & Immigration Enforcement Biometrics Security Market [$M] by Country – 2015-2022
Figure 69 European Counter Terror, Counter Crime & Immigration Enforcement: Biometrics Security Market Shares [%] by Country – 2015-2022
Figure 70 European Counter Terror, Counter Crime & Immigration Enforcement: Biometrics Security Market [$M] by Revenue Source (Sales, Aftersale and Other Revenues) – 2015-2022
Figure 71 European Counter Terror, Counter Crime & Immigration Enforcement: Biometrics Market Share [%] by Revenue Source – 2015-2022
Figure 72 Interrelationship of a C2/C4ISR Components
Figure 73 A Border Security Command, Control & Communication System
Figure 74 Perimeter Security C3I System Topology
Figure 75 A Seaport Security C3I System Block Diagram
Figure 76 Automated C2-I Architecture
Figure 77 Command Functional View
Figure 78 Communications View
Figure 79 Client/server Model
Figure 80 C2/C4ISR Assessment Process
Figure 81 European C2-C4ISR Systems Market [$M] by Revenue Category (Sales, Aftersale and Other Revenues) – 2015-2022
Figure 82 European C2-C4ISR Systems Market Share [%] by Revenue Category – 2015-2022
Figure 83 Multi-Tiered Chemical, Hazmat & Nuclear Detection and Mitigation
Figure 84 Nuclear-Radiological Threats Weapon Sophistication vs. Consequence
Figure 85 The Three-tiered Port of Entry Nuclear Threat Screening Architecture
Figure 86 European Chemical, Hazmat & Nuclear Detection Market [$M] by Revenue Category (Sales, Aftersale and Other Revenues) – 2015-2022
Figure 87 European Chemical, Hazmat & Nuclear Detection Market Share [%] by Revenue Category – 2015-2022
Figure 88 Present and Pipeline Emergency Communication: Technologies
Figure 89 Public Safety Communication Technology Development
Figure 90 A City Emergency Communication Topology
Figure 91 City Communication Network
Figure 92 Wireless Communication Point-to-Multipoint
Figure 93 Interoperable Communications Network
Figure 94 Public Safety Communication: Obstacles to Interoperability
Figure 95 Interoperability Model – Interactions between Technical & Organizational Components
Figure 96 Interfaces Needed to Access Emergency Communication Services
Figure 97 Gateway/Console Patch Interoperable Network
Figure 98 System – Specific Roaming
Figure 99 Standard Based Shared Systems
Figure 100 TETRA’s European Public Safety Network
Figure 101 European Homeland Security & Public Safety Communication Systems & Devices Security Market [$M] by Country – 2015-2022
Figure 102 European Homeland Security & Public Safety Communication Systems & Devices Security Market Shares [%] by Country – 2015-2022
Figure 103 European Homeland Security & Public Safety Communication Systems & Devices Security Market [$M] by Revenue Source (Sales, Aftersale and Other Revenues) – 2015-2022
Figure 104 European Homeland Security & Public Safety Communication Systems & Devices Market Share [%] by Revenue Source – 2015-2022
Figure 105 IED Ready for Detonation
Figure 106 IED “Kill Chain” and Its Relevant Time Frame
Figure 107 European Counter-IED Technologies Market [$M] by Revenue Category (Sales, Aftersale and Other Revenues) – 2015-2022
Figure 108 European Counter-IED Technologies Market Share [%] by Revenue Category – 2015-2022
Figure 109 Cybersecurity Targets and Related Interests
Figure 110 Security Information and Event Management (SIEM) Architecture
Figure 111 Security Information and Event Management Solutions
Figure 112 IBM QRadar Security Intelligence Platform
Figure 113 The European “Computer Emergency Response Teams & Command Centre” (CERTs .CERT/CCs)
Figure 114 Elements Required for a Premium Cybersecurity Set-up
Figure 115 Cyber Risks Roadmap
Figure 116 European Cybersecurity Security Market [$M] by Revenue Source (Sales, Aftersale and Other Revenues) – 2015-2022
Figure 117 European Cybersecurity Market Share [%] by Revenue Source – 2015-2022
Figure 118 Comparison in Weight of Pathogens between BW Agents and CW Agents [mg]
Figure 119 Closed Area (e.g., building) Decontamination Boundaries
Figure 120 Open Area Decontamination Boundaries
Figure 121 Decontamination Corridor
Figure 122 Decontamination Core Technologies Overview
Figure 123 The Decontamination Cycle
Figure 124 Decontamination Strategy: from Sample Collection to Decontamination Clearance
Figure 125 Basic Phases of Response and Recovery to a CBRN & HAZMAT Incident
Figure 126 The Bio Attack Response Timeline
Figure 127 European Decontamination of CBRN & Hazmat Incidents Market [$M] by Revenue Category (Sales, Aftersale and Other Revenues) – 2015-2022
Figure 128 European Decontamination of CBRN & Hazmat Incidents Market Share [%] by Revenue Category – 2015-2022
Figure 129 Barrier at Hungarian Border Crossing
Figure 130 Diagram of Physical Security Fence Functions
Figure 131 European Electronic Fencing Market [$M] by Revenue Category (Sales, Aftersale and Other Revenues) – 2015-2022
Figure 132  European Electronic Fencing Market Share [%] by Revenue Category – 2015-2022


[Back to top]

European Homeland Security & Public Safety Technologies & Markets – 2016-2022 – Volume 4

Figure 1 A Multi-lane People Screening Site
Figure 2 Explosive Trace Detection: Principle of Operation
Figure 3 ETD Operational Workflow
Figure 4 Explosive Materials Classification
Figure 5 The Most Commonly Used Explosives Classification
Figure 6 Explosives Detection Technologies: Bulk vs. Trace Detection
Figure 7 Explosives Trace Detection Configuration: Hand Held ETD, & Tabletop ETD,
Figure 8 Stand-Alone Checked Luggage ETD System
Figure 9 Boarding Card ETD Reader
Figure 10 Airport Boarding Gate with Built-in ETD Screening Technology
Figure 11 ETD Based Vehicle Screening System
Figure 12 Free-surface Microfluidic Control of Surface-enhanced Raman Spectroscopy Based ETD
Figure 13 Surface Enhanced Raman Spectroscopy System
Figure 14 Microfluidic Control Surface-Enhanced Raman Spectroscopy Based ETD Process
Figure 15 Falcon First Responder Kit
Figure 16 Cantilever (a) Without Detection. (b) With Detection of Molecules at its Surface
Figure 17 Schematic of Basic Sensor Design
Figure 18 Schematic Diagram of an ETD Based on a Sensor Array and Neural Network
Figure 19 Non-Contact ETD Explosives and Narcotics Harvesting, Transport, Analysis and Reporting Process
Figure 20 European Explosives Trace Detection (ETD) Market [$M] by Revenue Category (Sales, Aftersale and Other Revenues) – 2015-2022
Figure 21 European Explosives Trace Detection (ETD) Market Share [%] by Revenue Category – 2015-2022
Figure 22 Video Surveillance Technologies Timeline
Figure 23 Multi-Modal Intrusion Detectors
Figure 24 Example of Intrusion Detection System Architecture
Figure 25 European Intrusion Detection Systems Security Market [$M] by Revenue Source (Sales, Aftersale and Other Revenues) – 2015-2022
Figure 26 European Intrusion Detection Systems Market Share [%] by Revenue Source – 2015-2022
Figure 27 Passengers Walk through a Metal Detector at the Gare du Nord Train Station in Paris
Figure 28 Metal Detection Portals Technologies
Figure 29 Hand-Held Weapon Detector – Proper Scanning Path
Figure 30 European Metal Detectors Market [$M] by Revenue Category (Sales, Aftersale and Other Revenues) – 2015-2022
Figure 31 European Metal Detectors Market Share [%] by Revenue Category – 2015-2022
Figure 32 Emergency Alert System
Figure 33 Multimodal Mass Emergency Notification
Figure 34 European Natural & Manmade Disaster Mitigation Market [$M] by Revenue Category (Sales, Aftersale and Other Revenues) – 2015-2022
Figure 35 European Natural & Manmade Disaster Mitigation Market Share [%] by Revenue Category – 2015-2022
Figure 36 NLW Measures of Effectiveness Framework
Figure 37 Near Term Counter-Personnel NLW
Figure 38 Less-Lethal Weapons Clinical Effects
Figure 39 Mid-Term Counter-Personnel Non-Lethal Weapons
Figure 40 Far-Term Counter-Personnel Non-Lethal Weapons
Figure 41 Near term Counter-Personnel NLW
Figure 42 Mid-term Counter-Personnel NLW
Figure 43 Far-term Counter-Personnel NLW
Figure 44 Near-term Counter-Material Non-Lethal Technologies
Figure 45 Mid-term Counter-Material Non-Lethal Technologies
Figure 46 Long-term Counter-Material Non-Lethal Technologies
Figure 47 European Non-Lethal Weapons Market [$M] by Revenue Category (Sales, Aftersale and Other Revenues) – 2015-2022
Figure 48 European Non-Lethal Weapons Market Share [%] by Revenue Category – 2015-2022
Figure 49 Personal Body Armor
Figure 50 Respiratory Protective Equipment Segments
Figure 51 CBRN Personal Protective Gear
Figure 52 European Personal (Ballistic & CBRNE) Protective Gear Market [$M] by Revenue Category (Sales, Aftersale and Other Revenues) – 2015-2022
Figure 53 European Personal (Ballistic & CBRNE) Protective Gear Market Share [%] by Revenue Category – 2015-2022
Figure 54 Suicide Attack Sequence
Figure 55 Spectrum of Evolving PBIED, VBIED & IED Detection Technologies
Figure 56 Standoff Electromagnetic Concealed Weapons Detection
Figure 57 Magnetic Signature Analysis System: Functional Block Diagram
Figure 58 Covert MMWave Sensor at a Door
Figure 59 Screening of Hand-held Baggage
Figure 60 Focal Plane Array Passive Standoff MMWave System
Figure 61 A Walk-by Passive MMWave Imaging System
Figure 62 Covert Walk-by Passive MMWave Images
Figure 63 Example of FTIR Application at Border Checkpoint Facilities
Figure 64 Biometric PBIED Detection Corridor
Figure 65 Field of View of a Fused Video Surveillance and Biometrics
Figure 66 Active MMWave HSR Bi-portal
Figure 67 Active MMWave HSR Bi-Portal on Mass Transit Object
Figure 68 Automatic PBIED Detection of Multiple Persons, Test Ground
Figure 69 Cobham Antenna Systems Standoff IED, PVIED & VBIED UGV IED Detection System
Figure 70 Cobham Antenna Systems Standoff IED, PVIED & VBIED UGV IED Detection Operation
Figure 71 IAI CIMS System
Figure 72 IAI CIMS System Performance
Figure 73 Multi-Modal Fused Standoff Explosives Detection System
Figure 74 The CounterBomber® System
Figure 75 Atmospheric Transmission Windows of Electromagnetic Radiation
Figure 76 Active Standoff MMWave Imaging Technologies Using Separate and Integrated Sources of Scene Illumination
Figure 77 Standoff Open Space Threat Detection
Figure 78 Active Standoff MMWave Imaging Experiment
Figure 79 A Passive MMWave Imager
Figure 80 Standoff MMWave Technology Used in a Tactical Checkpoint Environment
Figure 81 Passive MM-Wave Image of a Person with a Concealed Weapon
Figure 82 CCTV, IR & MMWave Images
Figure 83 PMC-2 Imager, System Architecture
Figure 84 PMC-2 Imager System Flowchart
Figure 85 Standoff Infrared Radiation Measurement from a Human
Figure 86 Open-Path FTIR Method
Figure 87 Top View of Toyota PBIED, VBIED & IED Detection Zones
Figure 88 Illustration of Sensor Locations at Toyota Center
Figure 89 Standoff IR Crowd Surveillance
Figure 90 Toyota Standoff System Architecture
Figure 91 The Electromagnetic Spectrum Showing the THz-Region
Figure 92 “Terahertz Fingerprints” of Explosives
Figure 93 “Terahertz Fingerprints” of Clothing
Figure 94 Ceiling Mounted Standoff Passive Terahertz Imager
Figure 95 Illustration of a Terahertz Standoff Imaging System at 50m Target Distance
Figure 96 Basic Terahertz Standoff Person-borne Explosives & Weapon Detection Technology Concept
Figure 97 Block Diagram of Frequency Modulate Continuous Wave (FMCW) RADAR
Figure 98 The Sub MMWave Multiplier and Mixer
Figure 99 Radar Photograph and Optics Schematic
Figure 100 Active Terahertz Concealed Explosives & Weapons Standoff Detection
Figure 101 A Standoff Passive Terahertz Weapons and Explosives System
Figure 102 Short Range Standoff Vehicle-Borne Explosives Detection Setup
Figure 103 Vapor Pressure of Important Explosives
Figure 104 LIBS Principle of Operation
Figure 105 Standoff Laser-Induced Breakdown Spectroscopy Real-time Explosive Detection
Figure 106 LIBS Emission Temporal Resolution as a Tool to Discriminate Between Different Explosives.
Figure 107 Absorbance Spectra of Various Explosives and Tuning Range of External Cavity Quantum Cascade Laser Source
Figure 108 PLP/LIF Technology: Principle of Operation
Figure 109 Fluorescence Energy Levels
Figure 110 Micro Raman Spectroscopy
Figure 111 Example of Raman Spectroscopy Systems
Figure 112 Comparison of Excitation Wavelengths for TNT
Figure 113 Comparison Between 4- Nitrotoluene & 2,4,6-Trinitrotoluene
Figure 114 Some LIDAR Measurement Techniques Distances are not Applicable to Explosives
Figure 115 European Standoff Explosives & Weapon Detection Market [$M] by Revenue Category (Sales, Aftersale and Other Revenues) – 2015-2022
Figure 116 European Standoff Explosives & Weapon Detection Market Share [%] by Revenue Category – 2015-2022
Figure 117 Whole-Object EDS Scheme
Figure 118 EDS Throughput [BPH] vs. System Price [$K]
Figure 119 Aviation Security: “100% EDS” Screening Flow Scheme
Figure 120 European Tomographic Explosive Detection Systems & BHS Market [$M] by Revenue Category (Sales, Aftersale and Other Revenues) – 2015-2022
Figure 121 European Tomographic Explosive Detection Systems & BHS Market Share [%] by Revenue Category – 2015-2022
Figure 122 Container/Vehicle Screening Technologies
Figure 123 X-Ray Screening – Block Diagram
Figure 124 Dual Energy X-Ray
Figure 125 Dual View X-Ray – Principles of Operation
Figure 126 Backscatter X-Ray + Penetrating X-Ray
Figure 127 Gamma Ray Screening – Block Diagram
Figure 128 Linac Screening System Block Diagram
Figure 129 Pulsed Fast Neutron Activation Container/Vehicle Screening System Block Diagram
Figure 130 European Vehicle & Container Screening Systems Market [$M] by Revenue Category (Sales, Aftersale and Other Revenues) – 2015-2022
Figure 131 European Vehicle & Container Screening Systems Market Share [%] by Revenue Category – 2015-2022
Figure 132 Video Surveillance Technologies Timeline
Figure 133 A Wireless Video Surveillance System
Figure 134 Key Stakeholders for Video Surveillance
Figure 135 Video Surveillance Planning Flowchart
Figure 136 Video Surveillance Design Flowchart
Figure 137 Video Surveillance Design Complete Flowchart
Figure 138 European Video Surveillance (w/o Analytics) Market [$M] by Revenue Category (Sales, Aftersale and Other Revenues) – 2015-2022
Figure 139 European Video Surveillance (w/o Analytics) Market Share [%] by Revenue Category – 2015-2022
Figure 140 Video Analytics System: Block Diagram
Figure 141 Standoff Biometric People Screening Using Video Analytics
Figure 142 Video Analytics Architecture
Figure 143 Profiling and Behavior Tracking – Principles of Operation
Figure 144 Highway Monitored by an Intelligent Transportation System
Figure 145 Police Application of Wireless Video Analytics
Figure 146 Cloud Based Video Analytics Architecture
Figure 147 Architecture of Video Understanding Systems
Figure 148 Video Analytics Architecture
Figure 149 VCA Block Diagram and Data Flow
Figure 150 Unattended Item Detection Algorithm Flow Chart
Figure 151 Visual Intelligence Process
Figure 152 ROSS Covert Multi Modal Ground ISR System
Figure 153 SkyStar 100 Mini Aerostat
Figure 154 Capture of Hierarchical Temporal Structure
Figure 155 Mobileye Detects: Lane Departure, Forward Collision Monitoring, Headway Monitoring, Speed Indication, Intelligent High Beam and Pedestrian Collision Monitoring
Figure 156 “Lane Keeping” Mode
Figure 157 A Portable ISR Video Surveillance Kit
Figure 158 European Video Analytics Market [$M] by Revenue Category (Sales, Aftersale and Other Revenues) – 2015-2022
Figure 159 European Video Analytics Market Share [%] by Revenue Category – 2015-2022
Figure 160 Major Explosives Detection Technologies: Bulk vs. Trace
Figure 161 X-Ray Conveyor-Based Screening Systems – Principles of Operation
Figure 162 Multi-View Dual Energy X-Ray Screening
Figure 163 X-Ray Backscatter (AIT) Principle of Operation
Figure 164 Backscatter People Screening Portal
Figure 165 Coherent X-ray Scheme
Figure 166 Cast and Artificial Limbs Screening System
Figure 167 A Prosthetic Limbs Backscatter Image Showing a Gun Hidden Underneath a Cast
Figure 168 Rapiscan Mobile Check ES002 Contains Two Screening Lanes
Figure 169 X-Ray Screening of Checked Luggage and Cabin Baggage as part of a Layered Aviation Security Infrastructure
Figure 170 European X-Ray Scanners Market [$M] by Revenue Category (Sales, Aftersale and Other Revenues) – 2015-2022
Figure 171 European X-Ray Scanners Market Share [%] by Revenue Category – 2015-2022
Figure 172 The EU Airport Automated Border Control Concept
Figure 173 Automatic Border Control Enable Identity Management throughout a Border Checkpoint
Figure 174 Automatic Border Control (ABC) Installations
Figure 175 Automatic Border Control (ABC) Block Diagram
Figure 176 Automated Border Control Process
Figure 177 Face Recognition Based Automated Border Control
Figure 178 European Automatic Border Control (ABC) Systems Market [$M] by Revenue Category (Sales, Aftersale and Other Revenues) – 2015-2022
Figure 179 European Automatic Border Control (ABC) Systems Market Share [%] by Revenue Category – 2015-2022
Figure 180 Border Barrier Architecture
Figure 181 The Greek Border Barrier
Figure 182 Estonia-Russia Border
Figure 183 European Border & Perimeter Barriers Market [$M] by Revenue Category (Sales, Aftersale and Other Revenues) – 2015-2022
Figure 184 European Border & Perimeter Barriers Market Share [%] by Revenue Category – 2015-2022
Figure 185 European Information Technologies (w/o Intel & Cyber) Market [$M] by Revenue Category (Sales, Aftersale and Other Revenues) – 2015-2022
Figure 186 European Information Technologies (w/o Intel & Cyber) Market Share [%] by Revenue Category – 2015-2022
Figure 187 The ABC Visa IT Reader
Figure 188 The Schengen Area Visa Member States
Figure 189 Global European Visa Status
Figure 190 European Visa Issuance IT Market [$M] by Revenue Category (Sales, Aftersale and Other Revenues) – 2015-2022
Figure 191 European Visa Issuance IT Market Share [%] by Revenue Category – 2015-2022
Figure 192 European Intelligence Services IT Market [$M] by Revenue Category (Sales, Aftersale and Other Revenues) – 2015-2022
Figure 193  European Intelligence Services IT Market Share [%] by Revenue Category – 2015-2022

Questions about this report?

Contact Sales: 1-571-527-1010 or Analysts: 1-202-455-0966

  • Have a question about European Homeland Security & Public Safety Market & Technologies - 2016-2022
    Please fill out all fields in the form below and click "Submit" to send your question.
    Our representative will review your question and contact you with an answer as soon as possible.
  • 2+2=
  • This field is for validation purposes and should be left unchanged.
1
Interested in this report? Need more information?

You may also like…

X
Powered By